Probing the Nuclear and Circumnuclear Activity of NGC 1365 in the Infrared††thanks: Herschel is an ESA space observatory with science instruments provided by European-led Principal Investigator consortia and with important participation from NASA.
Abstract
We present new far-infrared (m) Herschel PACS and SPIRE imaging observations as well as new mid-IR Gemini/T-ReCS imaging (8.7 and m) and spectroscopy of the inner Lindblad resonance (ILR) region (kpc) of the spiral galaxy NGC 1365. We complemented these observations with archival Spitzer imaging and spectral mapping observations. The ILR region of NGC 1365 contains a Seyfert 1.5 nucleus and a ring of star formation with an approximate diameter of 2 kpc. The strong star formation activity in the ring is resolved by the Herschel/PACS imaging data, as well as by the Spitzer m continuum emission, [Ne ii]m line emission, and 6.2 and m PAH emission. The AGN is the brightest source in the central regions up to m, but it becomes increasingly fainter in the far-infrared when compared to the emission originating in the infrared clusters (or groups of them) located in the ring. We modelled the AGN unresolved infrared emission with the clumpy torus models and estimated that the AGN contributes only to a small fraction () of the infrared emission produced in the inner kpc. We fitted the non-AGN m spectral energy distribution of the ILR region and found that the dust temperatures and mass are similar to those of other nuclear and circumnuclear starburst regions. Finally we showed that within the ILR region of NGC 1365 most of the on-going star formation activity is taking place in dusty regions as probed by the m emission.
keywords:
Galaxies: evolution — Galaxies: nuclei — Galaxies: Seyfert — Galaxies: structure — Infrared: galaxies — Galaxies: individual: NGC 1365.1 Introduction
| Obsid | Instrument | Bands | Start time | Duration |
|---|---|---|---|---|
| (µm) | (UTC) | (s) | ||
| 1342201436 | SPIRE-P | 250, 350, 500 | 2010-07-14 20:20:45.0 | 999 |
| 1342222495 | PACS-P | 70, 160 | 2011-06-11 12:59:25.0 | 1217 |
| 1342222496 | PACS-P | 70, 160 | 2011-06-11 13:20:45.0 | 1217 |
| 1342222497 | PACS-P | 100, 160 | 2011-06-11 13:42:05.0 | 1217 |
| 1342222498 | PACS-P | 100, 160 | 2011-06-11 14:03:25.0 | 1217 |
The fueling of the nuclear and circumnuclear activity of galaxies has been a topic of extensive discussion. Such activity not only includes the accretion of matter onto a supermassive black hole with the accompanying active galactic nucleus (AGN), but also the presence of intense nuclear and circumnuclear starbursts. Both types of activity require gas to be transported from the host galaxy on physical scales of a few kiloparsecs down to less than one kiloparsec for the nuclear starburst activity and even further in for the nuclear activity. Interactions, mergers, and large-scale bars, among others, have been proposed as possible mechanisms to transport gas from kiloparsec scales to the nuclear and circumnuclear regions (see the review by Jogee, 2006, and references therein).
In isolated galaxies with a large-scale bar the gas is believed to flow inwards between corotation and the inner Lindblad resonance (ILR). Indirect evidence of this is the presence of star formation rings and hot spots near the ILR of barred galaxies (see the review of Buta & Combes, 1996). The direction of the flows inside the ILR is generally outwards. This implies the existence of a gravity torque barrier at this resonance. However, if there is a “spatially-extended” ILR region, this translates into the existence of an inner ILR (IILR) and outer ILR (OILR). Numerical simulations predict that in this case a gas ring can be formed in between these two resonances. Furthermore, in the scenario of a double ILR the dynamical decoupling of an embedded nuclear bar can drive the gas further in (Shlosman et al., 1989; Hunt et al., 2008; García-Burillo et al., 2009). The combined action of gravity torques due to embedded structures (bars-within-bars) and viscous torques could be a viable mechanism to drive the gas to the inner few parsecs and feed the AGN (García-Burillo et al., 2005; Hopkins & Quataert, 2010).
NGC 1365 is a giant isolated barred galaxy at a distance of 18.6 Mpc (Lindblad, 1999, therefore pc). This galaxy hosts a Seyfert 1.5 nucleus (Schulz et al., 1999). Jubgwiert et al. (1997) showed that in NGC 1365 there is also a nuclear bar () embedded in the the large-scale bar (). Lindblad et al. (1996) used hydrodynamical simulations to reproduce the kinematics and the offset dust lanes along the large-scale bar of this galaxy with an outer ILR at a radius of kpc. There is also an inner ILR at a radius of kpc. Henceforth we refer to the ILR region as the region interior to the OILR of NGC 1365. As predicted by simulations, there is a ring of star formation inside the ILR region of this galaxy.
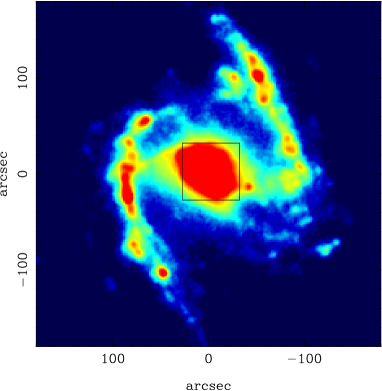
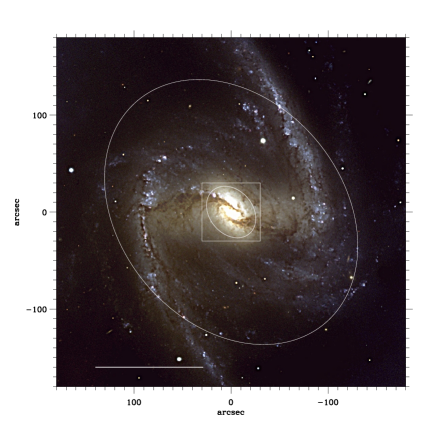
The star formation activity in the central regions of NGC 1365 has been revealed by the presence of hot spots (Sérsic & Pastoriza, 1965), intense H emission (Alloin et al., 1981; Kristen et al., 1997), non-thermal radio continuum sources associated with H ii regions and supernova remnants (Sandqvist et al., 1995; Forbes & Norris, 1998), large amounts of molecular gas (Sakamoto et al., 2007), and point-like and diffuse extended X-ray emission not associated with the AGN (Wang et al., 2009). Moreover, there is evidence that a significant fraction of the circumnuclear star formation activity might be obscured based on the prominent dust lane crossing the nuclear region (see Fig. 1, right panel) and the bright and extended mid-infrared (mid-IR) emission in this region (Telesco et al., 1993; Galliano et al., 2005).
In this paper we present new far-infrared (far-IR) imaging observations of NGC 1365 performed with the ESA Herschel Space Observatory (Pilbratt et al., 2010) and new mid-IR imaging and spectroscopy obtained with the camera/spectrograph Thermal-Region Camera Spectrograph (T-ReCS; Telesco et al., 1998) instrument on the Gemini-South telescope. The Herschel images were obtained using the Photodetector Array Camera and Spectrometer (PACS; Poglitsch et al., 2010) and the Spectral and Photometric Imaging REceiver (SPIRE; Griffin et al., 2010) instruments. We also use archival Spitzer data taken with the Infrared Array Camera (IRAC; Fazio et al., 2004), the Multi-Band Imaging Photometer for Spitzer (MIPS; Rieke et al., 2004), and the InfraRed Spectrograph (IRS; Houck et al., 2004) instruments. Using IR observations to study the nuclear and circumnuclear activity in the ILR region of NGC 1365 is crucial because the central region is crossed by a prominent dust lane that obscures from our view in the optical a significant fraction of emission produced there. This paper is organized as follows. We describe the observations in Section 2. We analyze the AGN IR emission and the spatially resolved IR emission in Sections 3 and 4, respectively, and we summarize our conclusions in Section 5.
2 Observations
2.1 Herschel/PACS and SPIRE imaging
We obtained Herschel far-IR imaging observations of NGC 1365 using PACS at 70, 100, and m and SPIRE at 250, 350, and m. The data are part of the guaranteed time program entitled “Herschel imaging photometry of nearby Seyfert galaxies: testing the coexistence of AGN and starburst activity and the nature of the dusty torus” (PI: M. Sánchez-Portal).
The PACS observations were carried out using the standard scan map mode that takes two concatenated scan line maps at 45∘ and 135∘ (in array coordinates), at a speed of 20 arcsec/sec, each one with 26 lines of length and cross-scan step of . This mode produces a rather homogeneous exposure map within a square region of about . The set of maps were duplicated to observe through both the 70 µm (“blue”) and 100 µm (“green”) filters. Therefore the galaxy was observed twice through the 160 µm (“red”) filter. With the SPIRE photometer we observed the three available bands simultaneously using the “large map” mode, with two nearly orthogonal scan maps (2 scan lines each), at a scan speed of 30 arcsec/sec, and three repetitions. The homogeneous exposure area for scientific use is approximately . Table 1 gives the summary of the observations.
| Instrument | Pixel size | FWHM | (r=15”) | (r=30”) | |
|---|---|---|---|---|---|
| (arcsec) | (arcsec) | (Jy) | (Jy) | ||
| MIPS | 24 | 2.45 | 5.9 | 7.2 | 8.7 |
| PACS | 70 | 1.4 | 5.6 | 85.5 | 102.7 |
| PACS | 100 | 1.7 | 6.8 | 110.1 | 141.7 |
| PACS | 160 | 2.8 | 11.3 | 87.4 | 123.7 |
| SPIRE | 250 | 6.0 | 18.1 | 33.4 | 53.3 |
| SPIRE | 350 | 10.0 | 25.2 | 10.4 | 21.0 |
| SPIRE | 500 | 14.0 | 36.9 | – | 5.6 |
Note.— The reported values of the FWHM are the nominal values. The errors in the aperture photometry are dominated by the photometric calibration uncertainty of the instruments that is typically 10%.
We reduced the data with the Herschel Interactive Processing Environment (HIPE) v8.0.1 and Scanamorphos (Roussel, 2012) v15. For the PACS instrument, we used HIPE and the Calibration Database V32 to build Level 1 products. These included detecting and flagging bad pixels, converting the ADU readings to flux units (Jy/pixel), and adding the pointing information. We did not attempt to perform deglitching at this stage to prevent the bright AGN nucleus to be affected by the MMT deglitching process. The final maps were built from the Level 1 products using Scanamorphos, which performs a baseline subtraction, correction of the striping effect due to the scan process, removal of global and individual pixel drifts, and finally the map assembly using all the nominal and cross-direction scans. For SPIRE we used the standard (small) map script and Calibration Database v8.1. The processing included detection of thermistor jumps in the time line, frame deglitching, low pass filter correction, conversion of readings to flux units (Jy/beam), temperature drift and bolometer time response corrections, and addition of pointing information. We built the final maps using the “naïve” scan mapper task. Colour corrections (for PACS, see Poglitsch et al. 2010; please refer to the Observer’s Manual for the SPIRE ones) are small for blackbodies at the expected temperatures (e.g., Pérez García & Rodríguez Espinosa 2001) and have been neglected. More details on the processing of Herschel data are given in Sánchez-Portal et al. (in preparation).
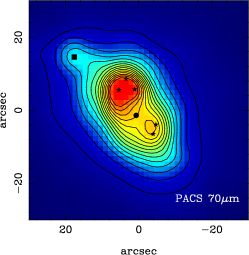
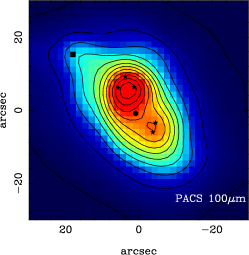
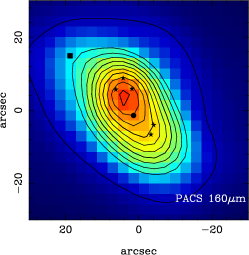
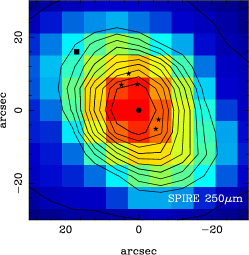
Figure 1 shows the fully reduced PACS m image of NGC 1365 together with the optical BVR image from Elmegreen et al. (2009). Fig. 2 shows the PACS images together with the SPIRE m with a field of view (FoV) covering the approximate extent of the ILR region of NGC 1365 (see also Section 2.5). We performed aperture photometry on all the Herschel images using two different radii, and . The latter encompasses the ILR region, whereas the former includes mostly the ring of star formation. Table 2 lists the measured flux densities.
2.2 Gemini/T-ReCS imaging and spectroscopy
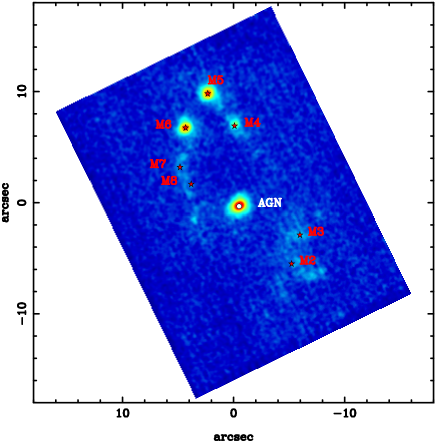
We obtained mid-IR imaging of NGC 1365 using T-ReCS on the Gemini-South telescope on September 8 and 9, 2011 as part of proposal GS-2011B-Q-20 (PI: N. Levenson). We used the Si-2 (m) and the Qa (m) filters and mid-IR standard observation techniques. The plate scale of the T-ReCS imaging observations is 0.089″/pixel with a FoV of . The total integration times (on-source) were 145 s and 521 s in the Si-2 and Qa filters, respectively. The Qa filter observations were split between the two nights, whereas those in the Si-2 filter were done on the second night. We observed standard stars immediately before or after the science observations in the same filters, to both flux-calibrate the galaxy observations and to estimate the unresolved nuclear emission (see below). The observations were diffraction limited, with a full width half maximum (FWHM) of in the Si-2 filter and in the Qa filter, as measured from the standard star observations. We reduced the imaging data using the CanariCam data reduction package RedCan (González-Martín et al., in preparation). We refer the interested reader to this work and Ramos Almeida et al. (2011b) for details. Fig. 3 shows the fully reduced T-ReCS Qa image resulting from the combination of the data taken during the two observing nights. The T-ReCS m image (not shown here) shows a similar morphology.
We also retrieved archival T-ReCS spectroscopic observations in the -band (m) using a slit width as part of proposal GS-2009B-Q-19 (PI: M. Pastoriza). The total on-source integration time was 600 s. We reduced the galaxy and corresponding standard star observations using the RedCan package following the steps described in Alonso-Herrero et al. (2011). Finally we extracted the nuclear spectrum as a point source.
To estimate the nuclear unresolved emission from the mid-IR imaging data we followed the point spread function (PSF) scaling technique implemented by Ramos Almeida et al. (2009, 2011b). This unresolved emission which is assumed to represent the torus emission (see Section 3.1). To do so, we scaled the observation of the corresponding standard star to the peak of the nuclear emission of the galaxy in each of the two filters. This represents the maximum contribution of the unresolved source (100%), whereas the residual of the total emission minus the scaled PSF accounts for the extended emission. In both filters we found that a 90% PSF scaling provided a realistic estimate of the extended emission. The estimated errors in the T-ReCS unresolved flux densities reported in Table 3 are 15% and 25% in the Si-2 and Qa filters, respectively, and account for both the flux calibration and PSF subtraction uncertainties (see Ramos Almeida et al., 2009, for more details). The unresolved m emission computed this way is in good agreement with the flux density at the same wavelength obtained from the T-ReCS nuclear spectrum.
2.3 Archival Spitzer/IRAC and MIPS imaging
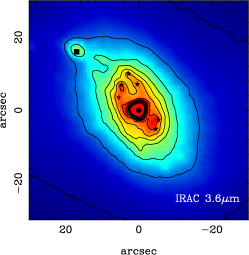
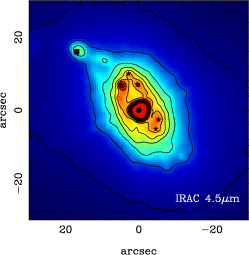
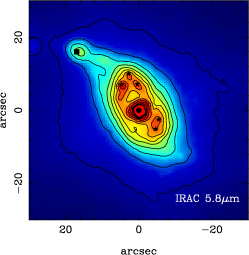
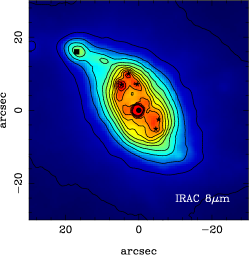
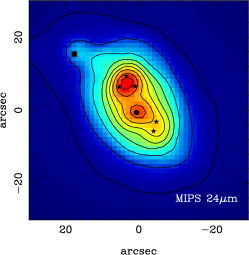
We retrieved from the Spitzer archive imaging data of NGC 1365 observed with all four IRAC bands (3.6, 4.5, 5.8, and m) and with MIPS at m (Program ID: 3672, PI: J. Mazzarella). These observations were part of The Great Observatories All-Sky LIRG Survey (GOALS, see Armus et al., 2009). We retrieved the basic calibrated data (BCD) from the Spitzer archive. The BCD processing includes corrections for the instrumental response (pixel response linearization, etc.), flagging of cosmic rays and saturated pixels, dark and flat fielding corrections, and flux calibration based on standard stars. We combined the BCD images into mosaics using the MOsaicker and Point source EXtractor (MOPEX) software provided by the Spitzer Science Center using the standard parameters. The final mosaics were repixeled to half of the original pixel size of the images, that is, the IRAC mosaics have /pixel, whereas the MIPS m mosaic has /pixel. In Fig. 2 we show the Spitzer images with a FoV covering the approximate extent of the ILR region, as done with the PACS images and the SPIRE m image. The angular resolutions of the IRAC images are between 1.7 and (FWHM) and that of the MIPS m is .
2.4 Archival optical ground-based imaging
We retrieved from the ESO archive optical images obtained with the WFI instrument on the MPG/ESO 2.2m telescope using the narrow-band Halpha/7 filter (Å, FWHM=70Å) obtained as part of proposal 065.N-0076 (PI: F. Bresolin). We combined a total of 6 images, each of them with a 350 s exposure. The plate scale of the images is /pixel. The filter contains the H and [N ii] emission lines plus adjacent continuum. Since we use this image for morphological purposes only, we did not attempt to either subtract the continuum or calibrate it photometrically. The positions of the H hot spots identified by Alloin et al. (1981) in the central region of NGC 1365 are displayed in Fig. 4 (upper panel).
2.5 Alignment of the images
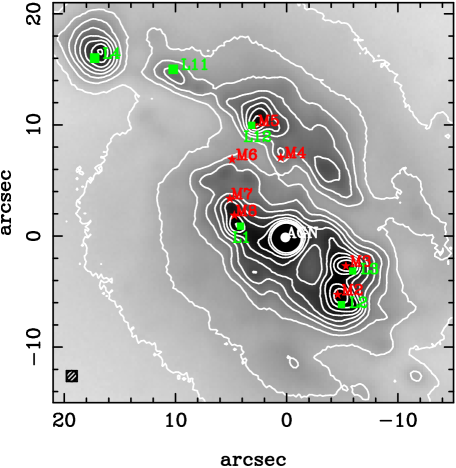
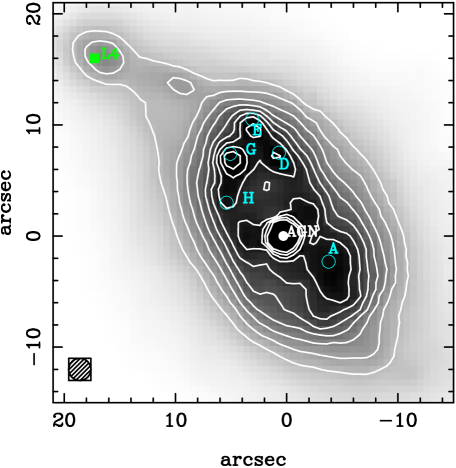
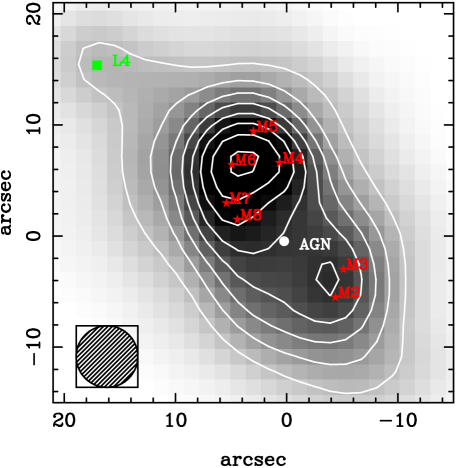
The alignment of the Spitzer/IRAC and the Gemini/T-ReCS images is straightforward because the AGN and the mid-IR clusters detected by Galliano et al. (2005) are clearly identified in all these images. The AGN is also bright in the optical image and therefore we used it as our reference. In Fig. 4 we present a close-up of the ILR region in the IRAC m band and the optical narrow-band H image. We marked the positions of the bright (designated as M4, M5, and M6) and faint mid-IR (designated as M2, M3, M7, and M8) clusters and the nucleus using the relative positions given by Galliano et al. (2005). We also indicated the positions of radio sources and H sources (see Section 4.1). Although the Spitzer/MIPS m image has a poorer angular resolution when compared to that of IRAC, the AGN is still sufficiently bright at m that can be distinguished from the mid-IR clusters.
The alignment of the Herschel/PACS images is not as simple because the AGN does not appear to be a bright source in the far-IR. We used the astrometry information in the Herschel image headers and the optical position of the nucleus of NGC 1365 given by Sandqvist et al. (1995): RA(J2000)= and Dec(J2000)=, for the initial alignment. These coordinates placed the AGN to the southwest of the bright source detected in the PACS images and in the MIPS m image that appears to coincide with the region containing clusters M4, M5, and M6. Additionally we compared the morphologies of the PACS m and the MIPS m images as they have similar angular resolutions (see Table 2). We used the mid-IR source located N, E of the AGN identified in the IRAC and MIPS images and also seen in the PACS m and m images for a finer alignment. This source appears to be coincident with the L4 H ii region or H hot spot (see Fig. 4 and Table 4) identified by Alloin et al. (1981) and also seen in our archival H image. The PACS m image was aligned relative to the other PACS images with the astrometry information in the headers. Finally since the bright mid-IR clusters cannot be resolved in the SPIRE m image, we placed the center of image at the position of the AGN. We note that the alignment of the PACS images in Figs. 2 and 4 is only good to within 1 pixel in each band. Since the main goal of this work is to study the processes giving rise to the IR emission within the ILR region of NGC 1365, in Fig. 2 we show the aligned IR images with a FoV covering the approximate extent of this region. We do not show the SPIRE 350 and m images because of the small number of pixels covering the ILR region of NGC 1365.
2.6 Spitzer/IRS spectral mapping
We retrieved from the Spitzer archive low spectral resolution () observations (Program ID: 3269, PI: J. Gallimore) of NGC 1365 obtained with the spectral mapping capability of IRS. These observations were part of the Spitzer study of the spectral energy distributions (SED) of the m sample of active galaxies (Gallimore et al., 2010). The observations were obtained with the Short-Low (SL1; m and SL2; m) and Long-Low (LL1; m and LL2; m) modules. The plate scales of the SL and LL modules are /pixel and /pixel, respectively.
| Name | Spectral | Rel. Position | Ref. |
|---|---|---|---|
| Range | arcsec, arcsec | ||
| M2, L2 | mid-IR, H | -4.7, -5.1 | 1, 2 |
| M3, L3 | mid-IR, H | -5.4, -2.6 | 1, 2, 3 |
| M4, D | mid-IR, radio | 0.4, 7.1 | 1, 4 |
| M5, E, L12 | mid-IR, radio, H | 2.8, 10.0 | 1, 4, 3 |
| M6, G | mid-IR, radio | 4.8, 7.0 | 1, 4 |
| M7, H | mid-IR, radio | ∗ | 1, 4 |
| M8, L1 | mid-IR, H | ∗ | 1, 2 |
| L11 | H | 10, 15 | 3 |
| L4 | H | 17, 16 | 3 |
| A | radio | -4.1, -2.4 | 4 |
The positions are relative to that of the AGN and correspond to those of the first listed source. ∗The positions shown in Figs. 3 and 4 are estimated from the mid-IR images of Galliano et al. (2005). References.— 1. Galliano et al. (2005). 2. Kristen et al. (1997). 3. Alloin et al. (1981). 4. Sandqvist et al. (1995).
The data were processed using the Spitzer IRS pipeline. The IRS data cubes were assembled using cubism (the CUbe Builder for IRS Spectra Maps, Smith et al., 2007a) v1.7 from the individual BCD spectral images obtained from the Spitzer archive. cubism also provides error data cubes built by standard error propagation, using, for the input uncertainty, the BCD-level uncertainty estimates produced by the IRS pipeline from deviations of the fitted ramp slope fits for each pixel. We used these uncertainties to provide error estimates for the extracted spectra, and the line and continuum maps (see Smith et al., 2007a, for full details) discussed in the next two sections.
2.6.1 Extraction of the 1D spectra
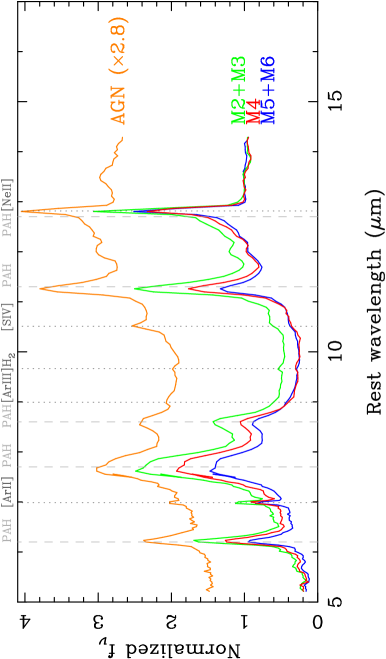
We used cubism to extract spectra of regions of interest using small apertures taking advantage of the angular resolution of the spectral mapping observations obtained with the SL1+SL2 modules ( FWHM, see Pereira-Santaella et al., 2010b). We used square or rectangular apertures in the original orientation of the SL data cubes with sizes of two or three pixels (see Table 5 for the extraction apertures used for each region). The selected regions include the AGN, and the regions containing the M2+M3, M4, and M5+M6 mid-IR clusters (see Fig. 4 for the positions) identified by Galliano et al. (2005). We note that we did not attempt to apply a point source correction to the SL spectrum of the AGN because we are mostly interested in the extended features, that is, the polycyclic aromatic hydrocarbon (PAH) features and the [Ne ii]m fine structure line. Fig. 5 shows the SL1+SL2 spectra of the selected regions normalized at m. Finally we extracted the integrated spectrum of the region covered by the observations, i.e. the central .
We measured the fluxes and the equivalent widths (EW) of the [Ne ii]m emission line and the 6.2 and m PAH features fitting Gaussian profiles to the lines and lines to the local continuum. Our measurements of the [Ne ii] flux for clusters M4, M5, M6 are in good agreement with those reported by Galliano et al. (2008a) from ground-based high angular resolution observations. Since the PAH features are broad, it has been noted in the literature that Gaussian profiles might not be appropriate to measure their flux because a large fraction of the energy in these bands in radiated in the wings. A Lorentzian profile might be a better approximation (see Galliano et al., 2008b) to measure their flux, and therefore we repeated the line fits with this method. Table 5 lists the measurements for the extracted spectra for the Gaussian profiles. To illustrate the effect of using different profiles, in this table we give the measured 6.2 to m PAH ratio for the two profiles and the selected regions.
| Region | Extraction | m PAH feature | m PAH feature | [Ne ii]m | |||||
|---|---|---|---|---|---|---|---|---|---|
| Aperture | flux | EW | flux | EW | flux | G | L | ||
| AGN | 8.6 | 0.09 | 5.3 | 0.13 | 1.7 | 1.6 | 1.2 | ||
| M2+M3 | 21.0 | 0.50 | 12.7 | 0.61 | 4.6 | 1.7 | 1.1 | ||
| M4 | 10.7 | 0.45 | 5.8 | 0.63 | 2.3 | 1.8 | 1.7 | ||
| M5+M6 | 20.0 | 0.45 | 10.2 | 0.40 | 6.5 | 2.0 | 1.5 | ||
| Integrated | 265.0 | 0.42 | 161.0 | 0.49 | 60.5 | 1.6 | 1.3 | ||
Notes.— Fluxes (observed, not corrected for extinction) are in units of and EW in units of m for measurements done with Gaussian profiles. The typical errors are 10% for the fluxes and m for the EW. is the strength of the silicate feature (see Section 2.6.2 for the definition). The ratio of the m PAH flux to the m PAH feature flux is given for fits to the features done with Gaussians (G) and Lorentzian (L) profiles (see Section 2.6.1 for more details).

2.6.2 Spectral Maps
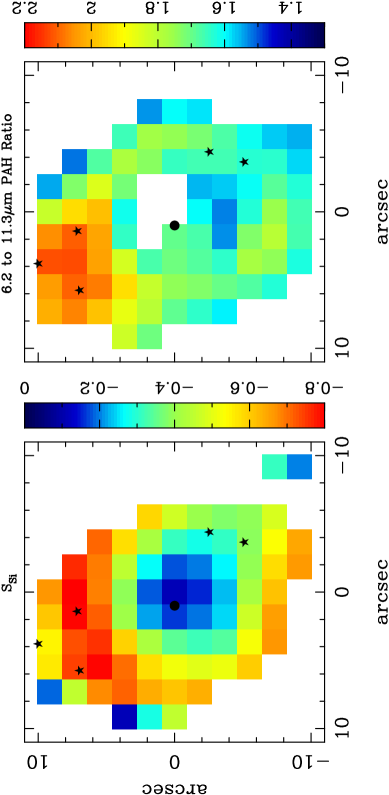
We used cubism to construct spectral maps of the most prominent features in the SL data cubes, namely, the m and m PAH features, and the [Ne ii]m fine structure line. The technique used here was very similar to that of Alonso-Herrero et al. (2009) and involves integrating the line flux over the user-defined emission line regions. Note that, unlike the line measurements in the previous section, the features are not actually fitted with Gaussian or Lorentzian profiles, and therefore these maps are only used for morphological purposes. Since cubism does not fit or deblend emission lines, the SL [Ne ii]m map includes some contribution from the m PAH feature. We also built a continuum map at m. The Spitzer/IRS SL spectral maps shown in Fig. 6 were trimmed and rotated to the usual orientation of north up, east to the left. We used the associated uncertainty maps produced by cubism to compute the relative errors of the spectral maps.
Finally we constructed the map of the silicate feature, which is shown in Fig. 7, following the technique of Pereira-Santaella et al. (2010b). Briefly, it involves fitting the silicate feature from 1D spectra extracted in boxes from the IRS SL data cubes. The map is then constructed by moving by 1 pixel in the x and y directions until the FoV of the IRS SL data cubes is completely covered. We measured the apparent strength of the silicate feature in the IRS spectra following Spoon et al. (2007): , where is the flux density at the feature and is the flux density of the underlying continuum. The latter was fitted as a power law between 5.5 and m. We evaluated the strength of the silicate feature at m. When the silicate strength is negative, the silicate feature is in absorption, whereas a positive silicate strength indicates that the feature is seen in emission. The uncertainties of the measured strengths in the spectral map and the extracted 1D spectra of previous section are .
3 AGN Infrared Emission
A number of works have studied in detail the mid-IR emission of the AGN hosted by NGC 1365 using high angular resolution observations, including imaging, spectroscopy, and interferometry. Our T-ReCS nuclear () mid-IR spectrum of NGC 1365 (see Fig. 8) is an almost featureless continuum with no clear evidence of the presence of the m silicate feature or PAH features (see also Siebenmorgen et al., 2004; Tristram et al., 2009). By contrast, the spectrum integrated over several arcseconds is rich in spectral features related to star formation activity, such as, PAH features and the [Ne ii] line (see Fig. 5). Tristram et al. (2009) modelled mid-IR interferometric observations of the nuclear region and derived a size (diameter) of pc for the m emitter. Up until now, there has been no estimates of the far-IR emission arising from the AGN of NGC 1365, and thus the main goal of this section is to provide such an estimate.
On scales of a few arcseconds the AGN of NGC 1365 is surrounded by a number of mid-IR bright clusters and extended and diffuse emission (see Figs. 2 and 4, and Section 4). Moreover, in the far-IR AGN emission becomes less luminous for increasing wavelengths when compared to that of the clusters (see Fig. 2). This together with the limited angular resolution of the PACS images (i.e., the best angular resolution is FWHM at m) prevents us from doing aperture photometry on the PACS images to derive the far-IR flux densities of the AGN. Instead, in this section we estimate the AGN emission by both fitting the nuclear near- and mid-IR SED with torus models and doing a spectral decomposition of the Spitzer/IRS nuclear spectrum.
| Parameter | Interval |
|---|---|
| Torus radial thickness | [5, 100] |
| Torus angular width (deg) | [15, 70] |
| Number clouds along an equatorial ray | [1, 15] |
| Index of the radial density profile | [0, 3] |
| Viewing angle (deg) | [0, 90] |
| Optical depth per single cloud | [5, 150] |
3.1 Fit to the nuclear SED and mid-IR spectrum using clumpy torus models
Clumpy torus models (e.g., Hönig et al., 2006; Schartmann et al., 2008) and in particular the Nenkova et al. (2008a, b) models (also known as clumpy models) have been shown to fit well the near and mid-IR SEDs and spectroscopy of Seyfert galaxies (Ramos Almeida et al., 2009, 2011b; Mason et al., 2009; Nikutta et al., 2009; Alonso-Herrero et al., 2011; Sales et al., 2011; Lira et al., 2012). The clumpy torus models are described by six parameters to account for the torus geometry and the properties of the dusty clouds (see Table 6). The geometry of the torus is defined with the torus radial thickness , which is the ratio between the outer and inner radii of the torus 111The inner radius of the torus in these models is set by the dust sublimation temperature, which is assumed to be K, and the AGN bolometric luminosity . Then the dust sublimation radius in pc is , where the AGN bolometric luminosity is in units of ., and the width of the angular distribution of the clouds , that is, the angular size of the torus as measured from its equator. The clouds have an optical depth and are arranged with a radial distribution expressed as a declining power law with index (), with giving the mean number of clouds along a radial equatorial ray. The last parameter is the viewing angle to the torus . We refer the reader to the sketch of the clumpy model geometry in Figure 1 of Nenkova et al. (2008a).
We updated the fit of Ramos Almeida et al. (2011b) with two main differences. First, we used the higher angular resolution mid-IR unresolved flux densities inferred in Section 2.2 and also included the T-ReCS mid-IR spectrum for the fit. Second, this galaxy is classified as a Seyfert 1.5 (it shows a broad component in H, Schulz et al., 1999) and therefore there is an unobscured view to the AGN. To account for it, we added an AGN component to the resulting torus model (see below) and allowed for a small amount of foreground extinction (mag, see Alloin et al., 1981), to redden the fitted models. We also included in the nuclear SED the HST/NICMOS m unresolved flux (Carollo et al., 2002).
Similarly to our previous work (Ramos Almeida et al., 2011b; Alonso-Herrero et al., 2011), we took a Bayesian approach to both fit the torus models to the data and derive meaningful confidence levels for the fitted parameters. To this end, we used the BayesClumpy (BC) fitting routine, an interpolated version of the clumpy models (Asensio Ramos & Ramos Almeida, 2009). The new version of BC allows to fit both photometric points and spectra. For the modelling we used the whole range of parameters probed by the clumpy models. We list them in Table 6. Unlike in some of our previous work, here we allowed for the torus extent to vary in the range , instead of restricting the models to small tori. This is because larger tori may be required to reproduce the far-IR emission of AGN (Ramos Almeida et al., 2011a). In addition to the six torus model parameters to be fitted plus the foreground extinction, there is an extra parameter to account for the vertical displacement needed to match the fluxes of a given model to the observations. This vertical shift, which we allow to vary freely, scales with the AGN bolometric luminosity (see Nenkova et al., 2008b). We assumed uniform distributions in the ranges given in Table 6 for the prior distributions of the torus model parameters.
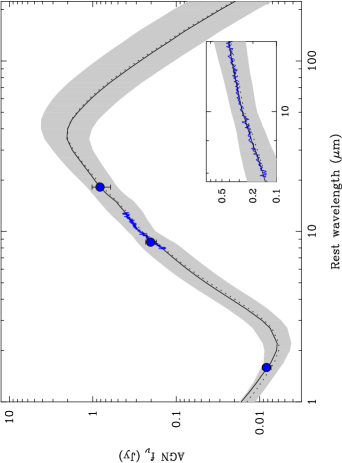
The BC fitting routine translates the probability distributions of the fitted torus model parameters into two model spectra. The first corresponds to the maximum-a-posteriori (MAP) values that represent the best fit to the data, while the second is the model produced with the median value of the probability distribution of each parameter. Fig. 8 shows the best fit to the nuclear near and mid-IR SED and the mid-IR spectrum of the NGC 1365 AGN. We also plot in this figure the range of acceptable torus models at the confidence level. As can be seen from this figure, the fit to the photometric and spectroscopic data is very good. Specifically, the clumpy models reproduce well the flat silicate feature at around m (see Nenkova et al., 2008b, their figures 16 and 17).
We can now compare the inferred torus model parameters with observations. We start with the AGN bolometric luminosity. As explained above, we chose to keep the scaling of the torus models to the observations as a free parameter. Because the scaling is proportional to the AGN bolometric luminosity, when compared with the observations it provides information about the goodness of the fit (see Alonso-Herrero et al., 2011, for more details). The derived AGN bolometric luminosity from our fit is . Risaliti et al. (2005) infered a keV luminosity in the range (corrected for the assumed distance in this work). Our derived AGN bolometric luminosity is consistent with the values from X-rays after applying a bolometric correction.
We can also compare the torus radius pc and torus angular width from the modelling with observations. The width of the angular distribution of the clouds in the torus is related to the opening angle of the ionization cones, with some dependence with the geometry of the gas (see discussion in Alonso-Herrero et al., 2011). The half opening angle of the NGC 1365 ionization cone modeled by Lindblad (1999) is deg (measured from the pole), which is compatible with the derived angular size of the torus. The size (diameter) of the m emitting source inferred from the modelling of the mid-IR interferometric observations of this galaxy is pc (Tristram et al., 2009). We note that the size of the m emitting source, which traces the warm dust within the torus, is expected to be smaller than the true size of the torus. This is because the m emission is rather insensitive to cooler material further from the nucleus (see discussion in Alonso-Herrero et al., 2011). Given the good agreement with the observations, we conclude that the fitted torus model provides a good representation of the AGN torus emission.
3.2 AGN torus emission in the far-IR
To estimate the AGN far-IR flux density in the PACS bands, we extrapolated the fitted torus model beyond m. As can be seen from Fig. 8, the torus model flux density peaks at m and falls off rapidly at longer wavelengths. This is similar to results for other AGN (see e.g., Mullaney et al., 2011). In Table 3 we list the extrapolated AGN far-IR flux densities together with those in the mid-IR from the T-ReCS imaging and spectroscopy. The ranges given in this table for the far-IR fluxes from the BC fit of the NGC 1365 take into account the confidence region of the fitted clumpy torus models.
A quick comparison between the extrapolated AGN far-IR fluxes and the aperture photometry of the central regions (Table 2) clearly shows that the AGN contribution at these wavelengths is small and decreases for increasing wavelengths. Within the central 5.4 kpc () the AGN is predicted to contribute (, ) of the total m emission. At m the AGN accounts for at most 2% of the emission in the same region and less than 1% at 100 and m. Using the flux densities measured for and the following equation from Dale & Helou (2002),
| (1) |
we estimate a m luminosity within the ILR region of . The ratio between the AGN bolometric luminosity and the IR luminosity of this region is then . This is in good agreement with findings for the majority of local LIRGs hosting an AGN (Alonso-Herrero et al., 2012).
4 Spatially-resolved IR emission in the ILR region
4.1 Morphology
The central region of NGC 1365 is a bright source of mid- and far-IR emission (see e.g., Telesco et al., 1993; Galliano et al., 2005; Wiebe et al., 2009), although its contribution to the integrated emission of the galaxy decreases significantly at longer wavelengths. The mid-IR morphology, especially in the IRAC 5.8 and m and in the T-ReCS images, resembles that of a circumnuclear ring of star formation with a diameter of approximately 1.8 kpc (see Figs. 2 and 3). The AGN and the bright mid-IR clusters M4, M5, and M6 identified (see Table 4) by Galliano et al. (2005) out to m are also clearly identified in the Gemini/T-ReCS image at m (see Fig. 3). The region to the southwest of the AGN is more diffuse and similar to the H morphology (see Fig. 4, upper panel). We do not, however, identify any bright compact sources there. This diffuse emission is reminiscent of the optical morphology of the region containing superstar clusters SSC3 and SSC6 along with a number of less luminous optical clusters (Kristen et al., 1997; Lindblad, 1999).
In the Spitzer/MIPS m image the emission from the AGN is still differentiated from that of the mid-IR clusters, although the latter are not resolved individually because of the decreased angular resolution. The Herschel observations of NGC 1365 show that the far-IR AGN emission becomes faint when compared to that of the clusters. This is not only because the clusters in the central region of NGC 1365 are still intrinsically bright in the far-IR, but also because in general the AGN emission is observed to fall steeply in the far-IR (see e.g., Netzer et al., 2007; Mullaney et al., 2011, and references therein). Moreover, in general the far-IR emission of AGN appears to be dominated by a starburst component (Hatziminaoglou et al., 2010). It is also apparent from Fig. 2 that the group of clusters M5…M8 are brighter than the group of M2 and M3 in the far-IR, as is also the case in the mid-IR. This implies, as will be discussed further in Section 4.5, that the obscured star formation rate (SFR) is higher in the former group than in the latter. Moreover, the morphology of the SFR tracers (e.g., the , , and m emissions) is similar to that of the molecular gas, especially that of the rare C18O(J=2-1) isotope (Sakamoto et al., 2007), where a “twin-peak” morphology is observed. Such molecular gas twin peaks are observed in barred galaxies (Kenney et al., 1992) and are formed where dust lanes intersect nuclear rings of star formation, as is the case of NGC 1365.
We can also compare the IR morphology, in particular at 8, 24, and m, of the ILR region with that of H222Note that the H+[N ii] image shown in Fig. 4 has not been continuum subtracted, and thus we restrict our discussion to the H bright hot spots identified by other works (e.g., Alloin et al., 1981; Kristen et al., 1997).. Since all these emissions probe the SFR in galaxies (Kennicutt, 1998; Kennicutt et al., 2009; Alonso-Herrero et al., 2006; Calzetti et al., 2007; Rieke et al., 2009; Li et al., 2010), a good morphological correspondence on scales of hundreds of parsecs is expected. Fig. 4 indeed shows that the H hot spots in the ILR region (Table 4, and also Alloin et al., 1981; Kristen et al., 1997) are clearly associated with IR emitting regions (compare with the IRAC m image as it has the best angular resolution). This seems to be the case out to m. At longer wavelengths the decreased angular resolution of the Herschel images does not allow us to compare the morphologies. The opposite is not necessary true because the H emission is strongly affected by extinction caused by the prominent dust lane crossing the ILR region. Mid-IR clusters M4 and M5 appear to be detected in the H image, but they are very faint. This is because they are in one of the regions with the highest extinction, as we shall see in more detail in Section 4.2.
The Spitzer/IRS map of the [Ne ii]m emission covering the central 2.2 kpc of NGC 1365 is shown in Fig.6. This emission line is a good tracer of the current SFR because its luminosity is proportional to the number of ionizing photons (Roche et al., 1991; Ho & Keto, 2007). The [Ne ii] emission appears as a partial ring and it is enhanced in the mid-IR clusters. Its morphology is similar to the PACS m morphology and the CO “twin peaks” discussed by Sakamoto et al. (2007). The AGN of NGC 1365, on the other hand is not a bright [Ne ii]m source, as found for other active galaxies (see e.g., Pereira-Santaella et al., 2010a). Analogously to other SFR indicators, namely the 24 and m emissions, the region to the northeast of the AGN (clusters M4, M5, and M6) is brighter in [Ne ii] than the region of clusters M2 and M3. The regions containing these bright mid-IR clusters account for approximately of the total [Ne ii]m emission in the central 2.2 kpc (see Table 5). Note, however that the emission from the clusters is unresolved at the Spitzer/IRS SL angular resolution and we did not apply a correction for unresolved emission. Therefore this contribution from the clusters should be taken as a lower limit.
Figure 6 also shows the maps of the 6.2 and the m PAH features. Both features probe mostly the emission from B stars rather than that from massive on-going star formation (O stars, see Peeters et al., 2004). The m PAH morphology is very similar to [Ne ii], whereas the m PAH map appears to have a deficit of emission in the region to the northeast of the AGN. The map of the ratio between these two features is in Fig. 7. Although several works found variations in the PAH ratios of galaxies not explained by changes in the extinction (see e.g., Galliano et al., 2008a; Pereira-Santaella et al., 2010b), in the case of the central region of NGC 1365 it might be entirely due to extinction. The 6.2 to m PAH ratio is strongly increased in the region enclosing clusters M4, M5, M6, which is also the region suffering the highest extinction (see Section 4.2 and Fig. 7). Since the relative absorption at m is higher than at m (see e.g., table 5 in Brandl et al., 2006), correcting the m PAH map for extinction would produce a morphology similar to that of the m PAH map. The measured EW and PAH ratios of the regions not affected by strong extinction are similar to those measured in other starburst galaxies (see e.g., Brandl et al., 2006; Spoon et al., 2007; Sales et al., 2010). We conclude that the star formation activity inside the ILR region of NGC 1365 has been taking place for at least a few tens of million years, as the PAH features trace the emission from B stars (Peeters et al., 2004), and is taken place currently because of the bright [Ne ii]m emission requires the presence of young ionizing stars.
4.2 Extinction: Silicate Feature
The circumnuclear region of NGC 1365 is crossed by a prominent dust lane entering the ring (see Lindblad, 1999, and references therein and also Figs. 1 and 4). This dust lane is still apparent in the shortest wavelength IRAC bands and can be seen passing between clusters M5 and M6 at m (see Fig. 2). The brightest mid-IR clusters M4, M5, and M6 are located at the edge of the dust features where the bar dust lane enters the ILR region to the northeast of the AGN (Elmegreen et al., 2009, and also Figs. 2 and 4). Mid-IR clusters M2 and M3 to the southwest of the nucleus are in a region less affected by extinction and are likely to be associated with optical super star clusters and optically-detected H ii regions (Kristen et al., 1997; Sakamoto et al., 2007).
The broad feature at m is believed to be produced by amorphous silicate grains and in normal star-forming galaxies is observed in mild absorption (Roche et al., 1991; Smith et al., 2007b). In the simplest dust geometry of a purely absorbing foreground screen the observed apparent depth of this feature is proportional to the optical extinction. The general variation of the obscuration inside the ILR region of NGC 1365 revealed by the optical imaging can be traced with the spectral map of the silicate feature. As can be seen from Fig. 7, the apparent strength of the silicate feature is high (in absorption) in the region encompassing clusters M4, M5, and M6 to the northeast of the AGN, almost zero at the location of the AGN, and intermediate (also in absorption) around clusters M2 and M3.
In Table 5 we list the strength of the silicate feature measured in the SL 1D spectra of selected regions. Assuming a foreground screen of dust and adopting the Rieke et al. (1985) extinction law (), the observed apparent depths of the star-forming regions in the circumnuclear region of NGC 1365 imply values of the visual extinction of between mag and mag for the regions of clusters M2+M3,and M4+M5+M6, respectively. The high value of the extinction derived for the latter region is entirely consistent with the values derived by Galliano et al. (2008a) for the individual clusters using hydrogen recombination lines. Our value of the extinction in the region containing M2 and M3 is higher than the optical estimate for the L2 and L3 H ii regions from Kristen et al. (1997).
The apparent strength of the silicate feature of the AGN measured from the Spitzer/IRS SL spectrum is (Table 5) indicating that the feature is present slightly in absorption. This value, however, is contaminated by extended emission as is apparent from the m image (see Fig. 4) and the presence of PAH features in the IRS nuclear spectrum (Fig. 5). Indeed, the Gemini/T-ReCS high angular resolution spectrum of the AGN is mostly a featureless continuum with no evidence of PAH feature emission (Fig. 8). Finally, the relatively moderate strength of the silicate feature of the integrated kpc central region (, Table 5) of NGC 1365333The m IR luminosity of this galaxy is using the IRAS flux densities from Sanders et al. (2003). is typical of the observed nuclear silicate strengths measured in other local LIRGs (Pereira-Santaella et al., 2010b; Alonso-Herrero et al., 2012) and indicates an average visual extinction in this region of mag.
4.3 Dust Color Temperatures
The Herschel images can be used to trace the spatial variations of the temperature of the dust inside the ILR region of NGC 1365. If we assume that the far-IR emission of a galaxy can be approximated with a modified blackbody, then in the case of optically thin emission the flux density can be expressed as
| (2) |
where is the blackbody function for a dust temperature of and is the dust emissivity. In the simplest approximation we can calculate the color temperature of the dust using the ratio of the surface brightness at two wavelengths with the following equation expressed in terms of wavelengths
| (3) |
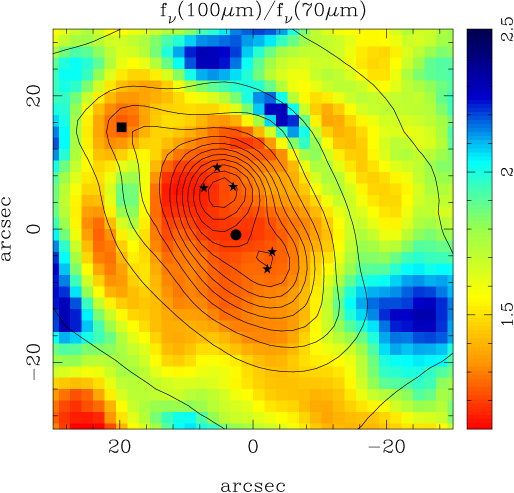
We chose to construct a map of the PACS m to the PACS m ratio as these two wavelengths provide the best angular resolutions with Herschel. We rebinned the PACS m image to the pixel size of the PACS m image. We matched the PSF of the two images by smoothing the m with a Gaussian function, although this may introduce some artifacts (see e.g., Bendo et al., 2010, 2012). We then calculated the dust color temperature by solving Equation 3. We fixed the value of the dust emissivity , as it is found to fit well the integrated SEDs of local IR galaxies (Dunne & Eales, 2001).
The map of the PACS m to m ratio of the inner is shown in Fig 9. The observed range of in the central region translates into values of the dust color temperature of between K and K. Within the ILR region of NGC 1365 the highest color temperatures correspond to regions actively forming stars, that is, the regions containing the mid-IR star clusters and the L4 H hot spot. These bright star forming regions have color temperatures similar to, although slightly higher than, those of H ii regions in the spiral arms. The regions with the coldest in the ILR region might be associated with some of the foreground dust features seen in the optical images (see Fig. 1). Finally, the region of the AGN does not appear different in terms of the color temperature when compared to the bright star forming regions. This is probably because the AGN is faint in the far-IR (see next section) coupled with the relatively coarse angular resolution of this map (i.e., that of the PACS m).
4.4 Dust Properties
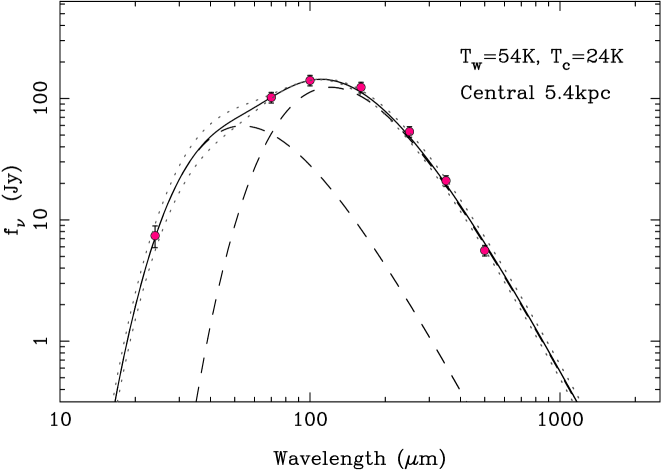
In this section we study the properties of the dust in the ILR region of NGC 1365, particularly the dust heated by processes other than the AGN. To do so, we first subtracted the AGN emission (see Table 3) from the observed fluxes in the Spitzer/MIPS m band and all the Herschel bands. We then fitted the observed non-AGN mid- and far-IR SED using a combination of two modified blackbody following Dunne & Eales (2001) and Clements et al. (2010):
| (4) |
where and are the relative masses of the warm and cold dust components and and are their temperatures. As done in Section 4.3, we fixed the dust emissivity and then used a standard minimization technique to fit the two dust temperatures and the relative masses of the two dust components. For the fit we used the fluxes measured through an aperture, and normalized them to that at m. For the Spitzer/MIPS m flux density, we added in quadrature the photometric error and the uncertainty associated with subtracting the AGN component at this wavelength to a total error budget of . For the Herschel data points because the AGN emission in the far-IR is very small compared to the total emission inside the ILR region, the dominant source of error is that associated with the photometric calibration of the data: .
Fig. 10 shows the best fit to the AGN-subtracted SED of the ILR region of NGC 1365, which was obtained with K and K, and relative masses of cold to warm dust of . It is worth noting that the fit using two modified blackbodies is formally better than a fit to the far-IR data (i.e., excluding the m data point) using a single modified blackbody. This can be explained because there is a non-negligible contribution from the warm dust component to the Herschel PACS m flux density, as found for the integrated emission of other nearby galaxies (see e.g., Bendo et al., 2010; Smith et al., 2010). However, the temperature of the warm component is not tightly constrained since varying the warm dust temperature by as much as K produces statistically similar good fits (). This is because the peak of this component at around m is not well sampled with the present data and the mass contribution of the warm component is small. The temperature of the cold component, on the other hand is well constrained. To get an estimate of the uncertainties on the fitted cold dust temperature, we changed it while fixing the temperature of the warm component. As can be seen from Fig. 10, cold dust temperatures in the range K provide acceptable fits to the SED.
Previous works showed that the integrated mid-IR and far-IR SEDs of Seyfert galaxies could be fitted with a combination of various dust temperatures probing different heating mechanisms. These include warm dust associated with the AGN torus, cold dust similar to that observed in starburst galaxies, and very cold dust at temperatures characteristic of dust heated by the interstellar medium (Pérez García & Rodríguez Espinosa, 2001; Spinoglio et al., 2002). With the superior angular resolution of the Herschel observatory we can now obtain spatially resolved observations of nearby Seyfert galaxies and star forming galaxies. The dust temperature of the ring of star formation in NGC 1365 is similar to that of other nuclear and circumnuclear starbursts with or without an AGN with similar IR luminosities and physical sizes, for instance, the ring of NGC 3081 (Ramos Almeida et al., 2011a) and the nuclear region of M83 (Foyle et al., 2012). On the other hand, the dust of Mrk 938, which is part of our survey of Seyfert galaxies, has a considerably higher dust temperature of K, probably due to the smaller size of the IR emitting region of this galaxy and higher IR luminosity (Esquej et al., 2012).
We calculated the dust mass () within the ILR region of NGC 1365 using the following equation from Clements et al. (2010) (adapted from Hildebrand, 1983):
| (5) |
where is the observed flux density, is the luminosity distance, is the blackbody emission for the best fitting dust temperatures, and is the dust absorption coefficient. As done by Esquej et al. (2012), we evaluated this expression at m using an absorption coefficient of , as interpolated from the dust model of Li & Draine 2001 (2001). We derived a dust mass in the ILR region of , which accounts for approximately 25% of the total dust mass of this galaxy . The latter estimate is from Wiebe et al. (2009) but recalculated for the absorption coefficient used in this work.
4.5 Star Formation Rate
The ages and masses of the mid-IR clusters (Myr and , Galliano et al., 2008a) and the large amount of molecular gas available in the central regions of this galaxy (Sakamoto et al., 2007) indicate that there is intense on-going star formation activity there. We can use the IR observations of NGC 1365 to estimate the obscured SFR in the ILR region, and compare it with the unobscured SFR. As discussed by Kennicutt et al. (2009), a combination of the observed (not corrected for extinction) H luminosity and a mid-IR monochromatic luminosity (preferably m) will provide the best estimate of the total SFR in a moderately obscured environment (see Section 4.2), such as the ILR region of NGC 1365. We note that this empirically calibrated recipe includes contributions from dust heating from all stars and not only the youngest (see Kennicutt et al., 2009, for a full discussion). Using the H flux of Förster Schreiber et al. (2004) for a 40″-diameter aperture and our m flux (after subtracting the AGN component) we estimated a total SFR within the ILR region (inner kpc, ) of NGC 1365 of SFR for a Salpeter initial mass function (IMF). Approximately 85% of this SFR is contributed by the m emission, and thus it originates from dust-obscured star forming regions.
Most of the IR emission in the ILR region comes from the star formation ring containing the bright mid-IR clusters identified by Galliano et al. (2005). Indeed, we estimate that within the inner the total SFR is . This has been calculated using the AGN-subtracted m flux density () and the 24″-diameter aperture H flux from Förster Schreiber et al. (2004). This corresponds to a SFR surface density in the ring of , for a ring radius of 900 pc. This value of the SFR density is similar to those of other circumnuclear starbursts (Kennicutt, 1998) and is expected to be larger by factors of compared to the disk of the galaxy (Elmegreen, 1994).
5 Summary and Conclusions
In this paper we have studied the IR emission associated with the star formation activity in the ILR region of NGC 1365, as well as the IR emission of the AGN. To this end we have analyzed new far-IR (m) Herschel/PACS and SPIRE imaging, and high angular resolution () Gemini/T-ReCS mid-IR imaging and spectroscopy of this galaxy. We have also made use of archival Spitzer/IRAC and MIPS imaging and IRS spectral mapping data. Our main findings for the inner kpc region of NGC 1365 are:
-
•
The new Herschel PACS imaging data at 70, 100, and m reveal that the ring of star formation in the ILR region is bright in the far-IR. The AGN is the brightest mid-IR source in the inner 2 kpc up to m, but it becomes increasingly fainter in the far-IR when compared with the mid-IR clusters or groups of them in the ring.
-
•
The 24 and m emissions as well as the [Ne ii]m line and PAH features trace the star-forming ring in the ILR region and have morphologies similar to the CO “twin-peaks”. This all indicates that there is intense on-going star formation taking place in the inner few kpc of NGC 1365.
-
•
The unresolved near and mid-IR nuclear emission and mid-IR spectrum (i.e., AGN-dominated emission) of NGC 1365 are well reproduced with a relatively compact torus (outer radius of pc) with an opening angle of deg, and an AGN bolometric luminosity using the clumpy torus models. These parameters are in good agreement with independent estimates in the literature.
-
•
Using the fitted torus model we quantified the AGN emission in the far-IR. The AGN only contributes at most 1% of the m emission within the inner 5.4 kpc (), and less than 1% at longer wavelengths. At m the AGN accounts for of the emission in the same region. We estimated that the AGN bolometric contribution to the m luminosity in the inner 5.4 kpc is approximately 5%.
-
•
The non-AGN 24 to m SED of the ILR region (inner 5.4 kpc) of NGC 1365 is well fitted with a combination of two modified blackbodies with warm and cold temperatures of 54 K and 24 K, respectively. However, the cold dust component accounts for most of total dust mass inferred in this region () and has a temperature similar to that of other nuclear and circumnuclear starbursts of similar sizes and IR luminosities.
-
•
From the comparison between the SFR from H (unobscured) and the SFR from m (obscured) we infer that up to of the on-going SFR inside the ILR region of NGC 1365 is taking place in dust-obscured regions in the ring of star formation.
Acknowledgments
We are grateful to B. Elmegreen and E. Galliano for providing us with the BVR map of NGC 1365 shown in the right panel of Figure 1. We also thank Andrés Asensio Ramos for developing the BayesClumpy fitting routine. We thank an anonymous referee for comments that helped improve the paper.
A.A.-H., M.P.-S., and P.E. acknowledge support from the Spanish Plan Nacional de Astronomía y Astrofísica under grant AYA2009-05705-E. A.A.-H. also acknowledges support from the Universidad de Cantabria through the Augusto González Linares Program and AYA2010-21161-C02-01. C.R.A. acknowledges the Spanish Ministry of Science and Innovation (MICINN) through project Consolider-Ingenio 2010 Program grant CSD2006-00070: First Science with the GTC (http://www.iac.es/consolider-ingenio-gtc/) and the Spanish Plan Nacional grant AYA2010-21887-C04.04. M.P. acknowledges the Junta de Andalucía and the Spanish Ministry of Science and Innovation through projects PO8-TIC-03531 and AYA2010-15169, respectively.
Herschel is an ESA space observatory with science instruments provided by European-led Principal Investigator consortia and with important participation from NASA. PACS has been developed by a consortium of institutes led by MPE (Germany) and including UVIE (Austria); KU Leuven, CSL, IMEC (Belgium); CEA, LAM (France); MPIA (Germany); INAF-IFSI/OAA/OAP/OAT, LENS, SISSA (Italy); IAC (Spain). This development has been supported by the funding agencies BMVIT (Austria), ESA-PRODEX (Belgium), CEA/CNES (France), DLR (Germany), ASI/INAF (Italy), and CICYT/MCYT (Spain). SPIRE has been developed by a consortium of institutes led by Cardiff Univ. (UK) and including: Univ. Lethbridge (Canada); NAOC (China); CEA, LAM (France); IFSI, Univ. Padua (Italy); IAC (Spain); Stockholm Observatory (Sweden); Imperial College London, RAL, UCL-MSSL, UKATC, Univ. Sussex (UK); and Caltech, JPL, NHSC, Univ. Colorado (USA). This development has been supported by national funding agencies: CSA (Canada); NAOC (China); CEA, CNES, CNRS (France); ASI (Italy); MCINN (Spain); SNSB (Sweden); STFC, UKSA (UK); and NASA (USA).
Based on observations obtained at the Gemini Observatory, which is operated by the Association of Universities for Research in Astronomy, Inc., under a cooperative agreement with the NSF on behalf of the Gemini partnership: the National Science Foundation (United States), the Science and Technology Facilities Council (United Kingdom), the National Research Council (Canada), CONICYT (Chile), the Australian Research Council (Australia), Ministério da Ciéncia, Tecnologia e Inovação (Brazil) and Ministerio de Ciencia, Tecnología e Innovación Productiva (Argentina).
This research has made use of the NASA/IPAC Extragalactic Database (NED) which is operated by the Jet Propulsion Laboratory, California Institute of Technology, under contract with the National Aeronautics and Space Administration.
References
- Alloin et al. (1981) Alloin D., Edmunds M. G., Lindblad P. O., Pagel B. E. J., 1981, A&A, 101, 377
- Alonso-Herrero et al. (2012) Alonso-Herrero A., Pereira-Santaella M., Rieke G. H., Rigopoulou D., 2012, ApJ, 744, 2
- Alonso-Herrero et al. (2011) Alonso-Herrero A., Ramos Almeida C., Mason R. et al., 2011, ApJ, 736, 82
- Alonso-Herrero et al. (2009) Alonso-Herrero A. et al., 2009, ApJ, 697, 660
- Alonso-Herrero et al. (2006) Alonso-Herrero A. et al., 2006, ApJ, 650, 835
- Armus et al. (2009) Armus L. et al., 2009, PASP, 121, 559
- Asensio Ramos & Ramos Almeida (2009) Asensio Ramos A., Ramos Almeida C., 2009, ApJ, 696, 2075
- Bendo et al. (2012) Bendo G. J. et al., 2012, MNRAS, 419, 1833
- Bendo et al. (2010) Bendo G. J. et al., 2010, A&A, 518, L65
- Brandl et al. (2006) Brandl B. et al., 2006, ApJ, 653, 1129
- Buta & Combes (1996) Buta R., Combes, F., 1996, Fundam. Cosm. Phys., 17, 95
- Calzetti et al. (2007) Calzetti D. et al., 2007, ApJ, 666, 870
- Carollo et al. (2002) Carollo C. M., Stiavelli M., Seigar M., de Zeeuw P. T., Dejonghe H., 2002, AJ, 123,159
- Clements et al. (2010) Clements D. L., Dunne L., Eales S., 2010, MNRAS, 403, 274
- Dale & Helou (2002) Dale D., Helou G., 2002, ApJ, 576, 159
- Dunne & Eales (2001) Dunne L., Eales S. A., 2001, MNRAS, 327, 697
- Elmegreen et al. (2009) Elmegreen B. G., Galliano E., Alloin D., 2009, ApJ, 703, 1297
- Elmegreen (1994) Elmegreen B. G., 1994, ApJ, 425, L73
- Esquej et al. (2012) Esquej P., Alonso-Herrero A., Pérez-García A. M. et al., 2012, MNRAS, in press (astro-ph/1202.4577)
- Fazio et al. (2004) Fazio G. G. et al., 2004, ApJS, 154, 10
- Forbes & Norris (1998) Forbes D. A., Norris R. P., 1998, MNRAS, 300, 757
- Förster Schreiber et al. (2004) Förster Schreiber N. M., Roussel H., Sauvage M., Charmandaris V., 2004, A&A, 419, 501
- Foyle et al. (2012) Foyle K., et al., 2012, MNRAS, 421, 2917
- Galliano et al. (2005) Galliano E., Alloin D., Pantin E., Lagage P. O., & Marco O., 2005, A&A, 438, 803
- Galliano et al. (2008a) Galliano E., Alloin D., Pantin E., Granato G. L., Delva P., Silva L., Lagage P. O., Panuzzo P., 2008a, A&A, 492, 3
- Galliano et al. (2008b) Galliano F., Madden S. C., Tielens A. G. G. M., Peeters E., Jones A. P., 2008b, ApJ, 679, 310
- Gallimore et al. (2010) Gallimore J. F. et al., 2010, ApJS, 187, 172
- García-Burillo et al. (2005) García-Burillo S., Combes F., Schinnerer E., Boone F., Hunt L. K., 2005, A&A, 441, 1011
- García-Burillo et al. (2009) García-Burillo S., Fernández-García S., Combes F. et al., 2009, A&A, 496, 85
- Griffin et al. (2010) Griffin M.J., Abergel A., Abreu A. et al., 2010, A&A, 518, L3
- Hatziminaoglou et al. (2010) Hatziminaoglou E. et al., 2010, A&A, 518, L33
- Hildebrand (1983) Hildebrand R. H., 1983, QJRAS, 24, 267
- Ho & Keto (2007) Ho L. C., Keto E., 2007, ApJ, 658, 314
- Hönig et al. (2006) Hönig S. F., Beckert T., Ohnaka K., Weigelt G., 2006, A&A, 452, 459
- Hopkins & Quataert (2010) Hopkins P. F., Quataert E., 2011, MNRAS, 415, 1027
- Houck et al. (2004) Houck J. R. et al., 2004, ApJS, 154, 18
- Hunt et al. (2008) Hunt L. K., Combes F., García-Burillo S. et al., 2008, A&A, 482, 133
- Jogee (2006) Jogee S., 2006, in Alloin D., ed., Lecture Notes in Physics Vol. 693, Physics of Active Galactic Nuclei at all Scales. Springer-Verlag, Berlin , p. 143
- Jubgwiert et al. (1997) Jungwiert B., Combes F., Axon D. J., 1997, A&AS, 125, 479
- Kenney et al. (1992) Kenney J. D. P., Wilson C. D., Scoville N. Z., Devereux N. A., Young, Y. S., 1992, ApJ, 395, L79
- Kennicutt (1998) Kennicutt R. C. Jr., 1998, ARA&A, 36, 189
- Kennicutt et al. (2009) Kennicutt R. C. Jr. et al., 2009, ApJ, 703, 1672
- Kristen et al. (1997) Kristen H., Jörsäter S., Lindblad P. O., Boksenberg A., 1997, A&A, 328, 483
- Li et al. (2010) Li Y. et al., 2010, ApJ, 725, 677
- Li & Draine 2001 (2001) Li A., Draine B. T., 2001, ApJ, 554, 778
- Lindblad et al. (1996) Lindblad P. A. B., Lindblad P. O., Athanassoula E., 1996, A&A, 313, 65
- Lindblad (1999) Lindblad P. O., 1999, A&ARv, 9, 221
- Lira et al. (2012) Lira P., Videla L., Wu Y., Alonso-Herrero A., Alexander D. M., Ward M., 2012, ApJ, submitted
- Mason et al. (2009) Mason R. E., Levenson N. A., Shi,Y., Packham C., Gorjian V., Cleary K., Rhee J., Werner M., 2009, ApJ, 693, L136
- Mullaney et al. (2011) Mullaney J. R., Alexander D. M., Goulding A. D., Hickox R. C., 2011, MNRAS, 414, 1082
- Nenkova et al. (2008a) Nenkova M., Sirocky M. M., Ivezić Z., Elitzur M., 2008a, ApJ, 685, 145
- Nenkova et al. (2008b) Nenkova, M., Sirocky M. M., Nikkuta R., Ivezić Z., Elitzur M., 2008b, ApJ, 685, 160
- Netzer et al. (2007) Netzer H. et al., 2007, ApJ, 666, 806
- Nikutta et al. (2009) Nikutta R., Elitzur M., Lacy M., 2009, ApJ, 707, 1550
- Peeters et al. (2004) Peeters E., Spoon H. W. W., Tielens A. G. G. M., 2004, ApJ, 613, 986
- Pereira-Santaella et al. (2010b) Pereira-Santaella M., Alonso-Herrero A., Rieke G. H., Colina L. et al., 2010b, ApJS, 188, 447
- Pereira-Santaella et al. (2010a) Pereira-Santaella M., Diamond-Stanik A. M., Alonso-Herrero A., Rieke G. H., 2010a, ApJ, 725, 2270
- Pérez García & Rodríguez Espinosa (2001) Pérez García A. M., Rodríguez Espinosa J. M., 2001, ApJ, 557, 39
- Pilbratt et al. (2010) Pilbratt G.L., Riedinger J.R., Passvogel T. et al., 2010, A&A, 518, L1
- Poglitsch et al. (2010) Poglitsch A., Waelkens C., Geis N. et al., 2010, A&A, 518, L2
- Ramos Almeida et al. (2011a) Ramos Almeida C., Sánchez-Portal M., Pérez-García A. M. et al., 2011a, MNRAS, 417, L46
- Ramos Almeida et al. (2011b) Ramos Almeida C., Levenson N. A., Alonso-Herrero A., et al., 2011b, ApJ, 731, 92
- Ramos Almeida et al. (2009) Ramos Almeida C., Levenson N. A., Rodríguez Espinosa J. M. et al., 2009, ApJ, 702, 1127
- Rieke et al. (1985) Rieke G. H., Lebofsky M. J., 1985, ApJ, 288, 618
- Rieke et al. (2004) Rieke G. H. et al., 2004, ApJS, 154, 25
- Rieke et al. (2009) Rieke G. H., Alonso-Herrero A., Weiner B. J., Pérez-González P. G., Blaylock M., Donley J. L., Marcillac D., 2009, ApJ, 692, 556
- Risaliti et al. (2005) Risaliti G., Elvis M., Fabbiano G., Baldi A., Zezas, A., 2005, ApJ, 623, L93
- Roche et al. (1991) Roche P. F., Aitken D. K., Smith C. H., Ward M. J., 1991, MNRAS, 248, 606
- Roussel (2012) Roussel H. 2012, in press (astro-ph/1205.2576)
- Sakamoto et al. (2007) Sakamoto K., Ho P. T. P., Mao R.-Q., Matsushita S., Peck A. B., 2007, ApJ, 654, 782
- Sales et al. (2010) Sales D. A., Pastoriza M. G., Riffel R., Winge C., 2010, ApJ, 725, 605
- Sales et al. (2011) Sales D. A., Pastoriza M. G., Riffel R., Winge C., Rodríguez-Ardila A., Carciofi A. C., 2011, ApJ, 738, 109
- Sanders et al. (2003) Sanders D. B., Mazzarella J. M., Kim D.-C., Surace J. A., Soifer B. T., 2003, AJ, 126, 1607
- Sandqvist et al. (1995) Sandqvist Aa., Jörsäter S., Lindblad P. O., 1995, A&A, 295, 585
- Schartmann et al. (2008) Schartmann M., Meisenheimer K., Camenzind M., Wolf S., Tristram K. R. W., Henning T., 2008, A&A, 482, 67
- Schulz et al. (1999) Schulz H., Komossa S., Schmitz C., Mücke A., 1999, A&A, 346, 764
- Sérsic & Pastoriza (1965) Sérsic J. L., Pastoriza, M., 1965, PASP, 77, 287
- Shlosman et al. (1989) Shlosman I., Frank J., Begelman M. C., 1989, Nature, 338, 45
- Siebenmorgen et al. (2004) Siebenmorgen R., Krügel E., Spoon H. W. W., 2004, A&A, 414, 123
- Smith et al. (2010) Smith M. W. L. et al., 2010, A&A, 518, L51
- Smith et al. (2007a) Smith J. D. T. et al., 2007a, PASP, 119, 1133
- Smith et al. (2007b) Smith J. D. T. et al., 2007b, ApJ, 656, 770
- Spinoglio et al. (2002) Spinoglio L., Andreani P., Malkan M. A., 2002, ApJ, 572, 105
- Spoon et al. (2007) Spoon H. W. W. et al., 2007, ApJ, 654, L49
- Telesco et al. (1993) Telesco C. M., Dressler L. L., Wolstencroft R. D., 1993, ApJ, 414, 120
- Telesco et al. (1998) Telesco C. M., Piña R. K., Hanna K. T., Julian J. A., Hon D. B., Kisko T. M., 1998, Proc. SPIE, 3354, 534
- Tristram et al. (2009) Tristram K. R. W., et al. 2009, A&A, 502, 67
- Wang et al. (2009) Wang J., Fabbiano G., Elvis M., Risaliti G., Mazzarella J. M., Howell J. H., Lord S., 2009, ApJ, 694, 718
- Wiebe et al. (2009) Wiebe D. W., et al. 2009, ApJ, 707, 1809