Terahertz Radiation Induced Ballistic Electron Transport in Graphene
Abstract
We investigated ultrafast carrier dynamics in graphene with near-infrared transient absorption measurement after intense half-cycle terahertz pulse excitation. The terahertz electric field efficiently drives the carriers, inducing large transparency in the near-infrared region. Theoretical calculations using the Boltzmann transport equation quantitatively reproduce the experimental findings. This good agreement suggests that the intense terahertz field should promote remarkable impact ionization process, which leads to suppression of optical phonon emission and results in efficient carrier transport in graphene.
pacs:
72.80.Vp, 42.65.-k, 72.20.Ht, 72.40.+wGraphene possesses many unique properties arising from its truly 2D honeycomb structure, and offers us a solid state playground of Dirac fermionsNovoselov et al. (2005). One exciting property in graphene is its high mobility even at room temperature owing to its massless band structure and high Fermi velocityChen et al. (2008), leading to long-range ballistic transport Du et al. (2008), which is significant for both fundamental physics and industrial applications. Although great achievements of DC electron transport in graphene Sarma et al. (2011); Chen et al. (2008); Du et al. (2008); Berciaud et al. (2010); Meric et al. (2008), current saturation restricts electron transport under a high electric field with field strength over 10 kV/cm, and has been attributed to optical phonon emission in high-energy state of Dirac electronsBerciaud et al. (2010); Meric et al. (2008); Barreiro et al. (2009); Tse et al. (2008). For anticipated graphene based nanoelectronics devices, the phonon scattering may restrict high field operations.
Thanks to recent advances in high-power and time-resolved terahertz (THz) technologies Hoffmann et al. (2011), we can apply electric fields of high strength (MV/cm) with a pulse width of 100 fs to probe the ultrafast nonlinear optical properties of materials in the THz frequency region. For instance, novel carrier dynamics in semiconductors have been reported such as THz-field-driven mass anisotropy in doped InGaAs Blanchard et al. (2011), and highly efficient carrier multiplication in GaAs quantum wells Hirori et al. (2011), to name only two. In graphene, S.Winnerl et al. has performed THz-pump THz-probe measurement, revealing that the excitation and relaxation dynamics of carriers strongly depend on the excitation frequency in the THz regionWinnerl et al. (2011). In these studies, THz pulses are of picosecond duration, which is longer than the typical optical phonon emission timescale in graphene. Shorter pulse is required to prevail over current saturation caused by optical phonon emission.
In this work, we succeeded in ballistic electron transport in graphene using 200-fs half-cycle THz excitation pulses and monitoring their dynamics with 50-fs long near-infrared (NIR) probing pulses. Large THz induced transparency is observed in the NIR region for the first time. Numerical calculations using the Boltzmann equation quantitatively reproduce the experimental findings and demonstrate the importance of efficient carrier multiplication by impact ionization in graphene. This multiplication achieved by ultrashort THz pulse excitation drastically suppresses the current saturation effect.
The sample used in our experiment is a commercial CVD graphene grown on Cu foil, which is transferred onto a substrate. We have confirmed the sample’s single-layer nature and uniformity by confocal Raman imaging microscope Ferrari et al. (2006). The transmissivity of our sample at 800 nm is 97 , comparable with the value obtained from universal conductivity of intrinsic single layer graphene Novoselov et al. (2005). Because graphene is deposited on , substrate-induced inhomogeneity at the graphene-oxide interface gives rise to p-type doping with Fermi energy over 200 meV Ryu et al. (2010).
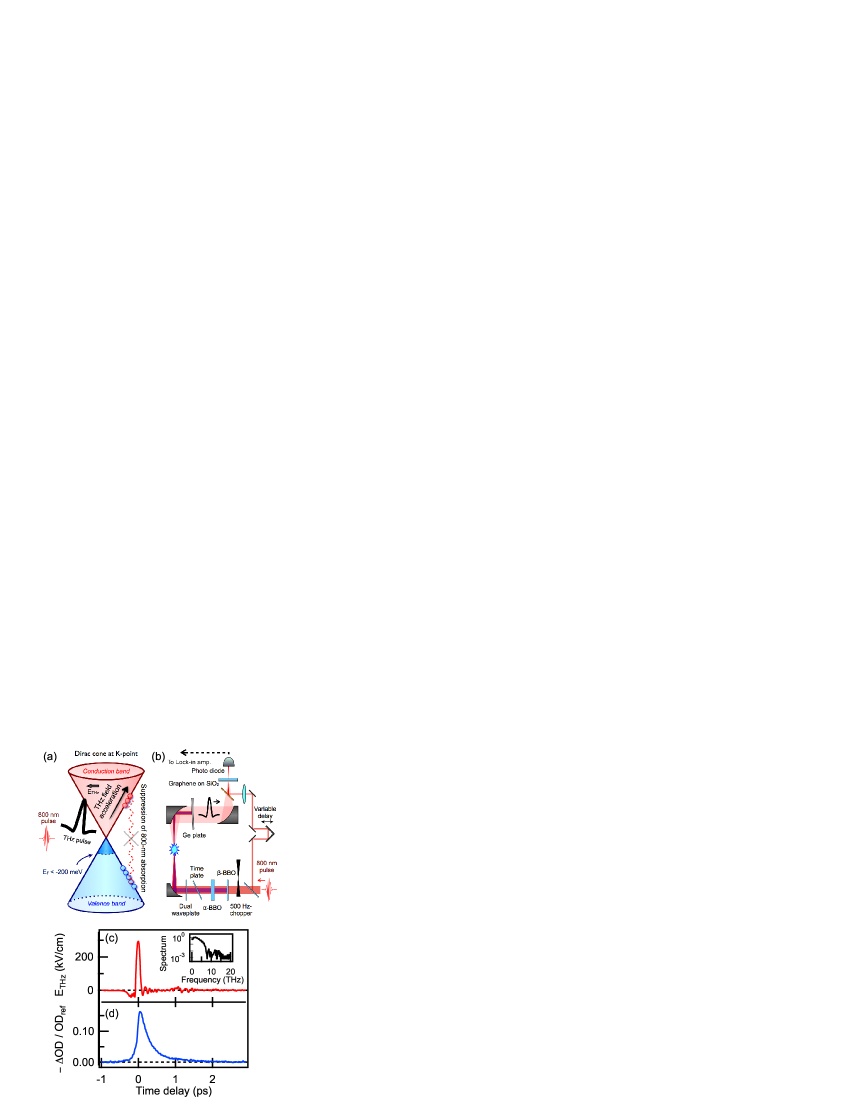
To investigate hot electron transport properties in graphene, we performed transient absorption measurement in the NIR region under intense THz excitation, as illustrated in Fig. 1(a). We used a collinear air plasma method for generation of intense half-cycle THz pulses Dai et al. (2009) (Fig. 1(b)). A 800-nm laser pulse (Ti:Sapphire laser that delivers 3 mJ with 35-fs duration laser pulses) was split into two pulses for THz excitation and time-resolved NIR transmissivity measurements. An undoped germanium substrate was inserted in the THz excitation line to reject any remaining 800 nm-pump beam after plasma generation. The laser pump and probe energy are 2.4 mJ and 1 nJ per pulse, and spot sizes of THz pulse and 800-nm pulse at the sample position are 80 m and 30 m, respectively. Figure 1(c) shows a temporal profile of the THz pulse with a peak electric field of 300 kV/cm and a full-width at half-maximum of 100 fs. Notice that spectrum of THz pulse is ranging from 0.5 to 7 THz (inset of Fig. 1(c)) with the photon energy several tens of times smaller than that of the probing pulse. All measurements were performed at room temperature and under dehydrated air to suppress THz absorption from water vapor. Temporal evolutions of 800-nm probe transmission through graphene after THz pulse excitation could be reconstructed by scanning an optical delay stage. Finally, a lock-in amplifier (SRS SR830) connected to the output of an amplified photodiode, and referenced to the chopper that switched the excitation on and off at 500 Hz, served to probe the change of the NIR transmissivity .
Figure 1(d) shows a typical THz induced differential optical density measurement as a function of time with a peak THz electric field of 300 kV/cm. To clarify the physical meaning observed here, we define the normalized differential optical density by , where is the optical density of graphene at 800 nm without THz pulse excitation, and is that of with THz pulse excitation. The value of corresponds to the population occupation at the energy of 800-nm transition. After THz pulse excitation, the differential optical density immediately goes negative (e.g., graphene becomes transparent in the NIR region under THz pulse excitation) and returns to zero within 2 ps. Experimentally, the maximum value of reaches for a peak electric field of 300 kV/cm. This large induced transparency over 16 was probably caused by to electron filling or hole depletion of the corresponding energy levels.
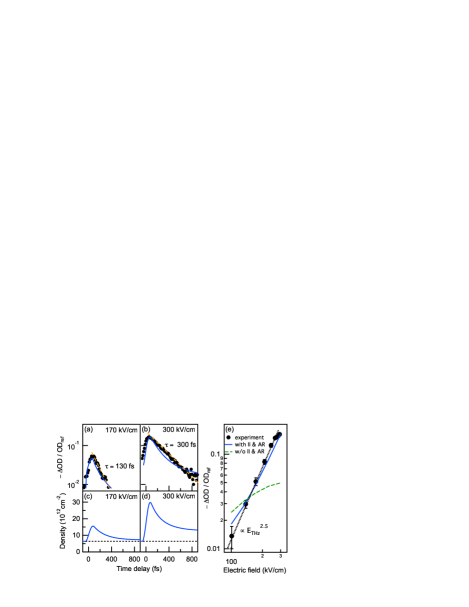
Figures 2(a) and 2(b) show the temporal profile of induced NIR transparency for peak electric fields of 170 kV/cm and 300 kV/cm. The maximum values of induced transparency drastically increase for the higher electric field, while carrier relaxation time tends to increase linearly with field strength. The origins leading to the nonlinearity will be discussed in subsequent paragraphs.
Figure 2(e) shows the maximum values of induced transparency as a function of a peak electric field. A power law with exponent 2.5 is found experimentally. This is in contrast with quadratic dependence observed in ultrafast optical pump-probe experiments Dawlaty et al. (2008); Carbone et al. (2011). The super-quadratic dependence found here suggests nonlinear coupling between the THz field and electronic system, and can be explained by the rapid increase in the number of carriers with field strength.
As examined in detail in previous studies from THz to NIR regions Winnerl et al. (2011); Mak et al. (2008); Sun et al. (2008), electromagnetic wave excitation results in two possible scenarios: interband and intraband transitions. Interband transition creates electron-hole pairs with kinetic energy of the incident photon energy, whereas intraband transition induces athermal distribution of carriers in the momentum space. According to these studies, the dominant mechanism should be determined by photon energy and Fermi energy of graphene. In this study, the dominant mechanism is restricted to intraband transition because of large negative Fermi energy below -200 meV coming from the substrate. Since the excited carriers have the kinetic energy corresponding to NIR excitation, their relaxation dynamics can be compared with photo-excitation studies such as ultrafast saturation absorptionXing et al. (2010), single-color and two-color pump-probe measurementKampfrath et al. (2005); George et al. (2008); Dawlaty et al. (2008); Carbone et al. (2011); Breusing et al. (2011), and ultrafast photoluminescence measurementLui et al. (2010), where 8 fs carrier-carrier scattering, 50-120 fs carrier thermalization, 0.1-1 ps carrier cooling and 3 - 15 ps carrier recombination have been reported .
To understand the carrier dynamics based on our observations, we have calculated the distribution function of carriers in k-space using the following semi-classical Boltzmann equation:
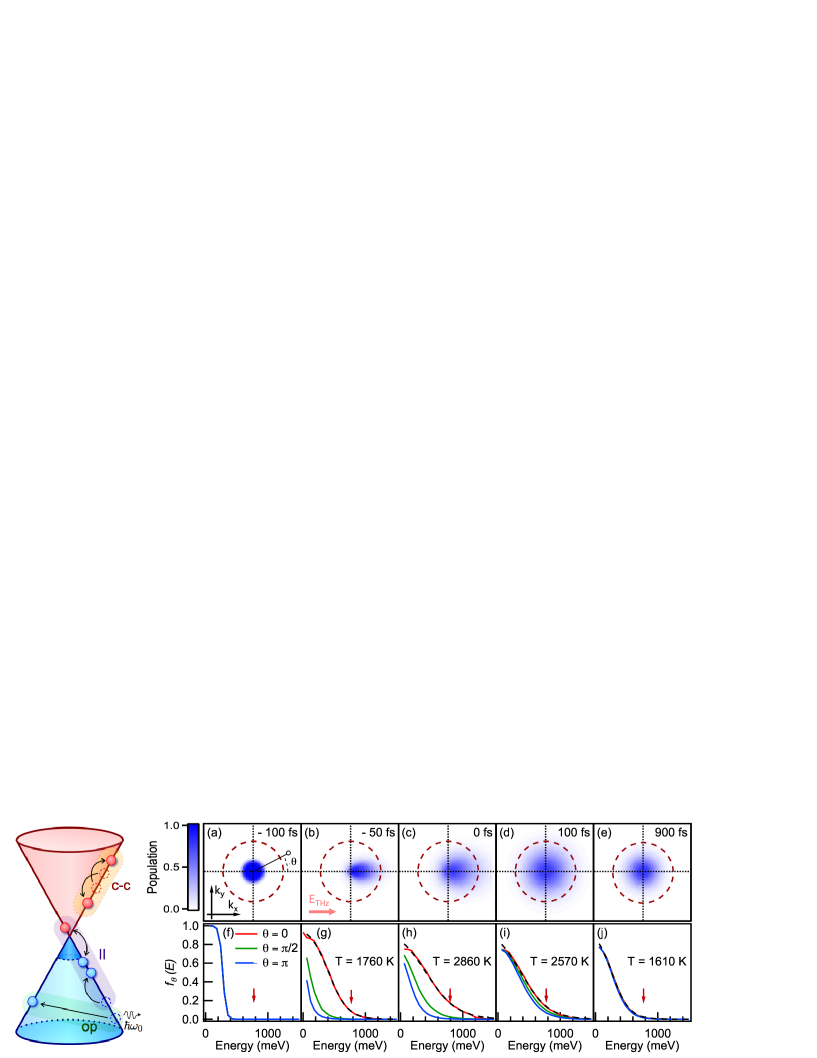
where is a distribution function of electrons and holes (), is the charge of carrier, and is the incident THz electric field on graphene at time . represents intraband carrier-carrier (c-c) scattering rates with coulomb interactions Girdhar et al. (2011). Intervalley K-K’ scattering is neglected for large momentum exchange Malic et al. (2011). represents intra- and inter-band phonon scattering rate with and K optical phonon modes Malic et al. (2011). Electron-phonon coupling strength is from Ref. Piscanec et al. (2004). and represent impact ionization (II) and Auger recombination (AR) rates Rana (2007), respectively. The last two terms (II and AR) change the number of carriers through interband c-c scattering. The II process creates an extra electron-hole pair while losing the kinetic energy of another electron or hole, as schematically shown in Fig. 3. The AR is the inverse process of II, which reduces the number of carriers. The first term represents carrier acceleration on linear dispersion relation (Dirac cone) with an electric field, where is the energy of the carrier and is the Fermi energy in graphene. In the second term, momentum-resolved hot phonon effects are included Malic et al. (2011). Acoustic phonon scattering negligibly contributes in our observation time scale and was not included in our calculations Winnerl et al. (2011); Malic et al. (2011).
The occurrence of II and AR in graphene is controversial because of restrictions from energy and momentum conservation laws in the Dirac cone. Although some authors have stated that these processes are prohibited because of a limited number of possible initial and final momentum configurationsFoster et al. (2009), some experimental and theoretical studies have indicated the possibility of using these processesWinnerl et al. (2011); Girdhar et al. (2011); Rana (2007); George et al. (2008); Breusing et al. (2011); Winzer et al. (2010). Here, we allow these processes by loosening the momentum conservation law by ( 1 meV in kinetic energy). This may come from imperfection of our CVD graphene, which possibly results in larger II and AR processes George et al. (2008); Grein et al. (2003).
Calculated induced NIR transparency is plotted as a function of a peak electric field in Fig. 2(e) (solid line). The experimental results are quantitatively reproduced when II and AR processes are included. For comparison, the calculations by strictly applying conservation laws (without II and AR) are also plotted as a dashed line. In the latter case, the sub-linear scaling with field strength clearly deviates from the experiment for the higher electric field because of rapid optical phonon scattering. We have to stress here that the only adjustable parameter is the initial Fermi energy, which is tuned to reproduce the magnitude of induced transparency in Fig. 2(e). The best-fitted Fermi energy is -280 meV, which is a reasonable value for graphene on a substrateRyu et al. (2010). Note that the changes of the initial Fermi energy only offset the field dependence without affecting the power law. This good agreement indicated that efficient carrier multiplication by II prevails over AR under the high electric field condition.
To emphasize the effect of carrier multiplication, we plot the calculated carrier density as a function of time in Figs. 2(c) and 2(d). The number of carriers becomes almost five times larger than the initial number of carriers with a peak electric field of 300 kV/cm, resulting in the observed large induced transparency. Recovery of the absorption change at 800 nm is also calculated and shown as solid lines in Figs. 2(a) and 2(b). Our calculations qualitatively reproduce the field dependent relaxation time, which confirm the longer relaxation time at higher excitation density. This is due to the hot phonon effect Sun et al. (2008); Malic et al. (2011).
Figures 3(a)-(e) show calculated distribution of holes in k-space at various time delays for the maximum applied electric field of 300 kV/cm. Figures 3(f)-(j) show the corresponding angle-resolved energy distribution of holes defined as with the angle in Fig. 3(a). Before THz pulse excitation, holes are distributed within Fermi energy with 300 K thermal fluctuation (Figs. 3(a) and 3(f)). As a THz electric field is applied, the carrier distribution becomes an asymmetric shape (Figs. 3(b) and 3(g)), and keeps its asymmetry until the peak electric field (Figs. 3(c) and 3(h)), although the asymmetry decreases rapidly by optical phonon scattering. After the THz excitation pulse is passing through the sample, the distribution immediately recovers its symmetric shape (Figs. 3(d) and 3(i)) and returns back to the initial distribution by emitting optical phonons (Figs. 3(e) and 3(j)). This argument is well confirmed by angle-resolved energy distributions fitted with Fermi-Dirac distribution in the THz field direction (Figs. 3(f)-(j)). For instance, temperature in direction is 300 K before excitation and is increased to 2860 K after THz pulse excitation, though temperature in other direction remains low even at the peak electric field (Fig. 3(h)). After THz pulse excitation, energy distributions immediately thermalize in all directions and return back to the initial distribution through phonon emission. Notice that the dashed circles in Figs. 3(a)-(e) represent momenta corresponding to the energy of 800-nm transition, also indicated with arrows in Figs. 3(f)-(j).
The characteristic feature of half-cycle THz pulse excitation is field-induced asymmetry in the momentum distribution, which induces current in the direction of the THz electric field. In the linear dispersion relation, a carrier with the momentum direction induces current by . With this expression, we can estimate how the scattering processes affect current. In short, optical phonon scattering efficiently damps current, whereas c-c scattering, II and AR processes conserve current.
In contrast to high DC electric field studies in which rapid optical emission restricts current flow Berciaud et al. (2010); Meric et al. (2008); Barreiro et al. (2009); Tse et al. (2008), current is not saturated under intense THz pulse excitation. This can be understood as follows: In our high field conditions, carriers can gain enough kinetic energy to induce impact ionization before optical phonon emission. Because impact ionization process efficiently reduces kinetic energies of carriers while conserving current, carriers have less chance to emit optical phonons. This suppresses the current saturation and leads to longer ballistic transport of carriers in graphene under high electric fields.
In conclusion, we reported the first observation of large THz-induced near-infrared transparency in graphene. Our results were compared with simulations using the Boltzmann equation and we proved that carrier multiplication occurs in graphene driven by high field and ultrashort THz pulse. The observed dependence of the rise in charge density on THz peak field strength indicates an interband impact ionization mechanism in graphene. The impact ionization process may suppress optical phonon emission and lead to ballistic carrier transport in graphene.
Acknowledgements.
We thank G.Asai for the preparation technique of our sample. This work was supported by Grant-in-Aid for Scientific Research on Innovative Area ’Optical science of dynamically correlated electrons (DYCE)’ (Grant No. 20104007), and Grant-in-Aid for Scientific Research (A) (Grant No. 23244065).References
- Novoselov et al. (2005) K. S. Novoselov et al., Nature (London) 438, 197 (2005).
- Chen et al. (2008) J. H. Chen et al., Nat. Nanotechnol. 3, 206 (2008).
- Du et al. (2008) X. Du et al., Nat. Nanotechnol. 3, 491 (2008).
- Sarma et al. (2011) S. D. Sarma et al., Rev. Mod. Phys. 83, 407 (2011).
- Berciaud et al. (2010) S. Berciaud et al., Phys. Rev. Lett. 104, 227401 (2010).
- Meric et al. (2008) I. Meric et al., Nat. Nanotechnol. 3, 654 (2008).
- Barreiro et al. (2009) A. Barreiro et al., Phys. Rev. Lett. 103, 076601 (2009).
- Tse et al. (2008) W. K. Tse et al., Appl. Phys. Lett. 93, 023128 (2008).
- Hoffmann et al. (2011) M. C. Hoffmann et al., J. Phys. D 44, 083001 (2011).
- Blanchard et al. (2011) F. Blanchard et al., Phys. Rev. Lett. 107, 107401 (2011).
- Hirori et al. (2011) H. Hirori et al., Nat. Commun. 2, 594 (2011).
- Winnerl et al. (2011) S. Winnerl et al., Phys. Rev. Lett. 107, 237401 (2011).
- Ferrari et al. (2006) A. C. Ferrari et al., Phys. Rev. Lett. 97, 187401 (2006).
- Ryu et al. (2010) S. Ryu et al., Nano Lett. 10, 4944 (2010).
- Dai et al. (2009) J. Dai et al., Phys. Rev. Lett. 103, 023001 (2009).
- Dawlaty et al. (2008) J. Dawlaty et al., Appl. Phys. Lett. 92, 042116 (2008).
- Carbone et al. (2011) F. Carbone et al., Chem. Phys. Lett. 504, 37 (2011).
- Mak et al. (2008) K. F. Mak et al., Phys. Rev. Lett. 101, 196405 (2008).
- Sun et al. (2008) D. Sun et al., Phys. Rev. Lett. 101, 157402 (2008).
- Xing et al. (2010) G. Xing et al., Opt. Express 18, 4564 (2010).
- Kampfrath et al. (2005) T. Kampfrath et al., Phys. Rev. Lett. 95, 187403 (2005).
- George et al. (2008) P. A. George et al., Nano Lett. 8, 4248 (2008).
- Breusing et al. (2011) M. Breusing et al., Phys. Rev. B 83, 153410 (2011).
- Lui et al. (2010) C. Lui et al., Phys. Rev. Lett. 105, 127404 (2010).
- Girdhar et al. (2011) A. Girdhar et al., Appl. Phys. Lett. 99, 043107 (2011).
- Malic et al. (2011) E. Malic et al., Phys. Rev. B 84, 205406 (2011).
- Piscanec et al. (2004) S. Piscanec et al., Phys. Rev. Lett. 93, 185503 (2004).
- Rana (2007) F. Rana, Phys. Rev. B 76, 155431 (2007).
- Foster et al. (2009) M. S. Foster et al., Phys. Rev. B 79, 085415 (2009).
- Winzer et al. (2010) T. Winzer et al., Nano Lett. 10, 4839 (2010).
- Grein et al. (2003) C. H. Grein et al., J. Appl. Phys. 93, 1075 (2003).