]}
Herschel / HIFI observations of CO, H2O and NH3 in Mon R2††thanks: Herschel is an ESA space observatory with science instruments provided by European-led Principal Investigator consortia and with important participation from NASA.,††thanks: Based on observations carried out with the IRAM 30m Telescope. IRAM is supported by INSU/CNRS (France), MPG (Germany) and IGN (Spain).
Abstract
Context. Mon R2, at a distance of 830 pc, is the only ultracompact H ii region (UCH ii) where the associated photon-dominated region (PDR) can be resolved with Herschel. Owing to its brightness and proximity, it is one of the best-suited sources for investigating the chemistry and physics of highly UV-irradiated PDRs.
Aims. Our goal is to estimate the abundance of H2O and NH3 in this region and investigate their origin.
Methods. We present new observations ([C ii ], 12CO, 13CO, C18O, o-H2O, p-H2O, o-HO and o-NH3) obtained with the HIFI instrument onboard Herschel and the IRAM-30 m telescope. We investigated the physical conditions in which these lines arise by analyzing their velocity structure and spatial variations. Using a large velocity gradient approach, we modeled the line intensities and derived an average abundance of H2O and NH3 across the region. Finally, we modeled the line profiles with a non-local radiative transfer model and compared these results with the abundance predicted by the Meudon PDR code.
Results. The variations of the line profiles and intensities indicate complex geometrical and kinematical patterns. In several tracers ([C ii ], CO 98 and H2O) the line profiles vary significantly with position and have broader line widths toward the H ii region. The H2O lines present strong self-absorption at the ambient velocity and emission in high-velocity wings toward the H ii region. The emission in the o-HO ground state line reaches its maximum value around the H ii region, has smaller linewidths and peaks at the velocity of the ambient cloud. Its spatial distribution shows that the o-HO emission arises in the PDR surrounding the H ii region. By modeling the o-HO emission and assuming the standard OO, we derive a mean abundance of o-H2O of relative to H2. The ortho-H2O abundance, however, is larger () in the high-velocity wings detected toward the H ii region. Possible explanations for this larger abundance include an expanding hot PDR and/or an outflow. Ammonia seems to be present only in the envelope of the core with an average abundance of relative to H2.
Conclusions. The Meudon PDR code, which includes only gas-phase chemical networks, can account for the measured water abundance in the high velocity gas as long as we assume that it originates from a 1 mag hot expanding layer of the PDR, i.e. that the outflow has only a minor contribution to this emission. To explain the water and ammonia abundances in the rest of the cloud, the molecular freeze out and grain surface chemistry would need to be included.
Key Words.:
ISM: structure – ISM: molecules – ISM: individual object: Mon R2 – HII regions – ISM: photon-dominated region (PDR) – Submillimeter1 Introduction
| Line | HPBM | a𝑎aa𝑎a | Telescope | |
|---|---|---|---|---|
| [GHz] | [″] | |||
| 12CO (98) | 1036.912 | 20.4 | 0.77 | Herschel |
| 13CO (21) | 220.398 | 10.0 | 0.67 | IRAM |
| 13CO (54) | 550.926 | 38.5 | 0.79 | Herschel |
| 13CO (109) | 1101.349 | 19.3 | 0.77 | Herschel |
| C18O (21) | 219.560 | 10.0 | 0.67 | IRAM |
| C18O (54) | 548.830 | 38.6 | 0.79 | Herschel |
| oH2O (1) | 556.936 | 38.1 | 0.79 | Herschel |
| pH2O (1) | 1113.343 | 19.3 | 0.77 | Herschel |
| oHO (1) | 547.676 | 38.0 | 0.79 | Herschel |
| o-NH3 (1) | 572.498 | 37.0 | 0.79 | Herschel |
| H (42) | 85.688 | 29 | 0.63 | IRAM |
| C ii () | 1900.537 | 11.2 | 0.73 | Herschel |
.
Although the processes that lead to the formation of massive stars are still not fully understood, it is generally agreed that massive stellar objects are formed by the collapse of a dense molecular cloud into one or multiple self-gravitating pre-stellar objects. Once the star is born, the innermost layers of the molecular cloud are heated and ionized by the strong UV radiation field, producing what is called an ultra compact H ii region (UCH ii). These regions are characterized by extreme UV irradiation and very small physical scales ( pc), and are embedded in dense molecular clouds with gas densities often higher than 106 cm-3 (Hoare et al., 2007). Whereas the H-ionizing radiation is absorbed in the H ii region, UV radiation carrying energies less than 13.6 eV penetrates deeper into the molecular cloud, producing a so-called photo-dissociation region (PDR). In these regions, the chemistry and the physics are driven by the extreme impinging radiation field (more than times the Habing field , see Habing, 1968). The study of UC H ii regions is crucial to understanding the different processes in massive star formation.
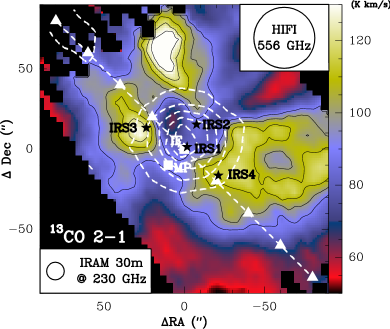
Mon R2 is the UC H ii region created by a B0 star (Downes et al., 1975) within the nearby (830 pc) star-forming region Monoceros. It is the closest UC H ii region and, with an angular diameter of 22″(0.1 pc), the only one that can be resolved by single-dish millimeter and far-IR telescopes. The formation of the star associated to the infrared source IRS1 created a huge bipolar outflow (15 = 3.6 pc long, Massi et al., 1985; Henning et al., 1992; Tafalla et al., 1994), which is now inactive. A compact active bipolar outflow, more likely related to FIRS 3, was observed in the low-J CO (Giannakopoulou et al., 1997) and methanol (Xu et al., 2006) lines. The UC H ii region has a cometary shape and reaches its maximum continuum brightness toward the infrared source Mon R2 IRS 1. The host molecular cloud has been characterized by many previous millimeter spectroscopic and continuum studies (Henning et al., 1992; Giannakopoulou et al., 1997; Tafalla et al., 1997; Choi et al., 2000; Rizzo et al., 2003, 2005). The molecular emission shows an arclike structure surrounding the H ii region, with the bulk of the emission to the southwest (see Fig. 1). The UCH ii appears to be opened to the north, as shown by the very extended emission of small dust particles at 8 m, in a region characterized by a PDR-like chemistry (Ginard et al., 2012). Depending on the tracer, gas densities between a few 105 cm-3 and cm-3 have been determined in the molecular gas, which testifies the presence of large gradients in the gas densities of this region (Rizzo et al., 2003; Berné et al., 2009; Ginard et al., 2012). Recent high spatial resolution observations in the mid-infrared of the H2 rotational lines and of UV-excited polycyclic aromatic hydrocarbons (PAHs) have shown the existence of a thin layer of hot (=100-600 K) and relatively dense molecular gas ( cm-3, (H2)1021 cm-2) in between the ionized region and the dense molecular cloud (Berné et al., 2009). The detection of the reactive ions CO+ and HOC+ toward FIRS 1 using the IRAM-30m telescope constitute additional proof for the existence of a high-density PDR (Rizzo et al., 2003).
Mon R2 has been targeted as part of the Herschel guaranteed-time key program “Warm and Dense Interstellar Medium” (WADI, PI: V. Ossenkopf) as prototype of UC H ii regions. The first Herschel observations of this source were presented by Fuente et al. (2010), who reported the detection of several far-IR/sub-mm lines, including o-H218O 11,100,0, toward the so-called molecular peak (hereafter MP, see Fig. 1). On the basis of these observations they estimated an average water abundance across the PDR of relative to H2. This value is slightly higher than that obtained by Snell et al. (2000), which was based on lower angular resolution observations of the o-H2O ground state line with SWAS ( relative to H2).
In this paper we present new Herschel observations and complementary mm data obtained at the IRAM-30m telescope to improve our knowledge of the molecular gas surrounding the H ii region, and investigate the origin of the CO, H2O and NH3 emission in more details.
2 Observations
Table 1 summarizes the observed transitions with the corresponding frequencies, beam sizes, and beam efficiencies111http://herschel.esac.esa.int/Docs/TechnicalNotes/HIFI_Beam_Efficiencies_17Nov2010.pdf,222http://www.iram.es/IRAMES/mainWiki/Iram30mEfficiencies. In this paper, the intensity scale is main beam temperature (), and offsets were calculated relative to the ionization front (hereafter IF: RAJ2000=06h07m46.2s, DECJ2000=-06°23′08.3′′).
2.1 Herschel observations
The Herschel (Pilbratt et al., 2010) observations presented here were obtained with the heterodyne instrument for the far infrared HIFI (de Graauw et al., 2010) as part of the WADI guaranteed-time key program (Ossenkopf et al., 2011). A single local oscillator (LO) configuration allowed us to simultaneously observe the o-H2O () and o-NH3 (1) lines. A second setup was dedicated to the observation of the p-H2O () and 13CO (109) lines. A third LO setting allowed us to observe the o-HO () line as well as the 13CO (54) and C18O (54) lines. Finally, dedicated setups were used for the 12CO (98) line and the [C ii ] line. All lines were observed in one strip across the region, oriented 45∘ (east of north). The [C ii ], o-H2O, p-H2O and 12CO strips extend 2′ in each direction relative to the IF (see Fig. 1). To achieve a better signal-to-noise ratio (S/N) in the o-HO () line, this strip extended for only 1′ on each side of the IF. The strips were obtained using the on-the-fly (OTF) observing mode using Nyquist sampling and with the reference position at the offset (+10′; 0′), which is free of emission.
The basic data reduction was performed using the standard pipeline provided with the version 7.0 of HIPE333HIPE is a joint development by the Herschel Science Ground Segment Consortium, consisting of ESA, the NASA Herschel Science Center, and the HIFI, PACS and SPIRE consortia (Ott, 2010) and then exported to GILDAS/CLASS (Pety, 2005) for a more detailed analysis. For the 13CO (109) and p-H2O () lines we subtracted a secondary OFF spectrum obtained at a position located at the NE end of the strip that is free of emission. Typical noise rms values are 20 mK (o-H2O and o-NH3), K (12CO), 20 mK (13CO 109 and p-H2O), 7 mK (o-HO, 13CO 54 and C18O 54) and 1 K ([C ii ]), all calculated at the resolution of 0.7 km s-1.
Because HIFI is a double-sideband receiver, but all our spectra are calibrated to the single-sideband scale, the continuum levels need to be corrected for the contribution from the image sideband. For all our spectra, we can assume a sideband gain ratio of unity (Roelfsema et al., 2012), so that the continuum level needs to be divided by a factor two. After this correction, the continuum levels toward the IF are 0.25 and 0.5 K at 550 GHz and 1110 GHz, respectively. The [C ii ] observations showed strong standing waves, which were removed using the FitHifiFringe task within HIPE. These standing waves hinder the determination of the continuum level at these high frequencies.
2.2 IRAM-30m telescope observations
The observations of the 13CO (21) and C18O (21) were performed in February and March 2009 using the HERA 33 1mm receiver array at the IRAM-30m telescope located at Pico de Veleta (Granada, Spain). The observations were performed in OTF mode with the same OFF position as above. The spectrometer was the VESPA autocorrelator, configured to provide a spectral resolution of 40 kHz. Typical noise rms values are 0.2 K for both the 13CO and C18O lines. The integrated intensity maps are shown in Fig. 1. In a different observing run, in July 2009, we observed the H42 recombination line at 85.688 GHz. The spectrometer was the WILMA autocorrelator, which provides a fixed spectral resolution of 2 MHz, 7 km s-1 at this frequency. The noise rms value of these observations is 0.05 K.
3 Results
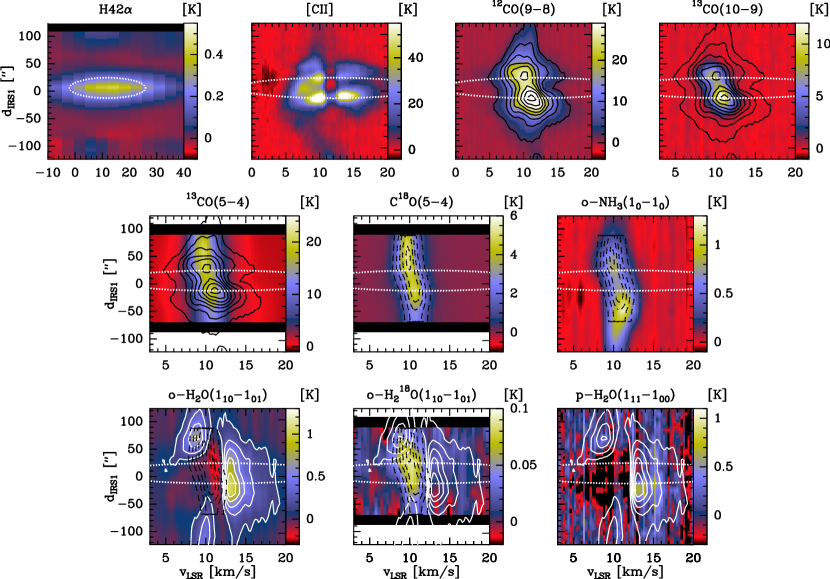
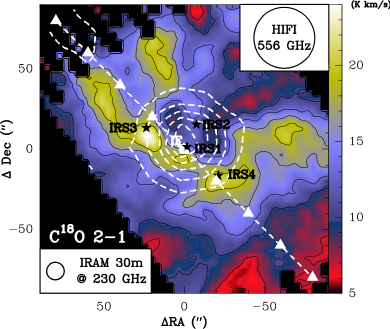
Figure 1 displays the integrated emission of the 13CO and C18O 21 lines in a 160″ 160″field centered at the IF. The emission of the C18O 21 line presents an arclike structure opened to the NW, with several peaks that correspond to regions of enhanced gas density as evidenced by other high-density tracers (Choi et al., 2000; Rizzo et al., 2003). The shape of the integrated intensity of the 13CO 21 line is similar, although the emission is somewhat more extended and less sensitive to individual clumps. Although it shows some symmetry, the gas detected in C18O shows an elongated structure extending northeast of the IF. The HIFI strips follows this structure so that individual clumps are likely to influence the emission of far-IR lines in this direction rather than toward the SW, where the molecular emission is more compact.
In the same figure, we present the integrated intensity of the H42 recombination line, which traces the H ii region. The large beam ( half-power beam width, HPBW) of the 30m telescope at this frequency hinders the detection of the small-scale morphology of this UC H ii region. The peak intensity of the H42 line is located northwest of the IF and the emission extends in a radius of about 20″. Taking into account the large beam of the 30m telescope at this frequency and typical pointing errors of 1″-2″, we do not consider that this shift is significant.
3.1 Kinematics
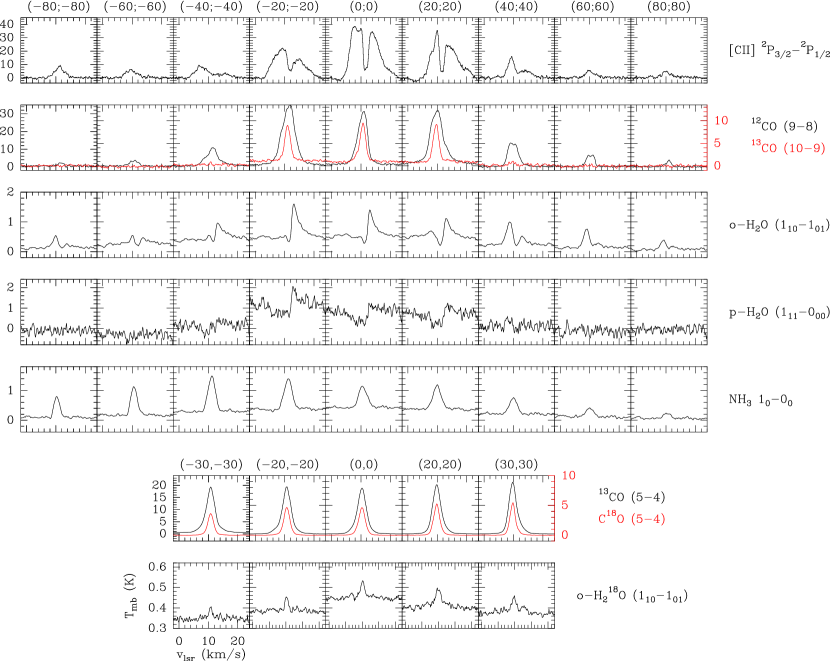
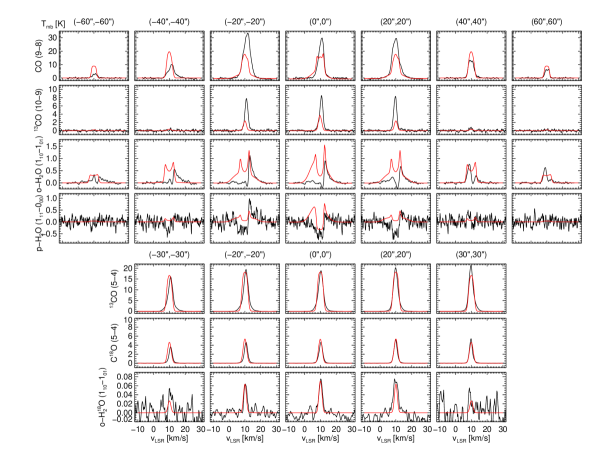
Figure 2 shows the HIFI spectra observed at different offsets along the the strip and Fig. 3 displays their position-velocity (PV) diagrams. Several lines ([C ii ], 12CO 98, o-H2O and o-NH3) are detected across the entire strip up to a distance of . The intensity and velocity structures show systematic variations along the strip, which can be summarized as follows:
-
1.
The [C ii ] line is most intense and broader toward the UC H ii region, where it covers the velocity range from 0 to 20 km s-1. Outside the UC H ii region, the [C ii ] emission remains detected but in a narrower velocity range, between 7 and 15 km s-1. A probable origin of the high-velocity gas around the UC H ii region is a dense PDR layer, accelerated by the radiative pressure from the central source, where carbon is ionized. The extended and narrower emission is likely related to the first quiescent layers of the molecular cloud or to layers in the external envelope.
-
2.
The 12CO and o-H2O lines peak toward the UC H ii region and high-velocity wings are detected in the direction of the ionized gas. Emission in the line wings is also detected at larger offsets toward the southwest (see offset [-40″,-40″]) in Figs. 2 and 3). The origin of this highly accelerated gas is difficult to determine: at small offsets it may be associated to the same expanding layer that emits in [C ii ], whereas the wings toward the southwest are more likely related with the molecular outflow mapped by Xu et al. (2006). Yet the outflow may also contribute to the broad emission toward the H ii region.
-
3.
The C18O and HO and NH3 lines have relatively narrow line widths (between 2.5 and 3.1 km s-1) all along the strip. The 13CO, C18O and HO lines peak a few arcsec northeast of the IF, whereas the NH3 emission presents a dip toward the IF and peaks southwest. This extended emission is consistent with the overall structure of the cloud traced by the 13CO and C18O (21) lines, which present an elongated structure in the NE-SW direction. The dip in the NH3 emission corresponds to a valley in the molecular bar traced by C18O (21).
-
4.
An absorption feature is detected in H2O at the velocity of the molecular cloud, km s-1, toward the UC H ii region, which likely originates in the same quiescent gas that is emitting for instance in NH3 and C18O. The [C ii ] spectra also show a self-absorption feature centered at km s-1 but its origin is more doubtful. In the other cases we do not detect the self-absorption feature.
-
5.
All CO and NH3 lines show a systematic shift of their peak velocities, which suggests that the expansion is not isotropic, and/or that a slow rotation ( km s-1, Loren, 1977) of the cloud may be ongoing.
Summarizing, these observations suggest that the high-velocity wings are coming from a gas that is pushed away from the H ii region. This gas could be associated either to the innermost layers of the expanding PDR, the outflow, or both. On the other hand, the emission and the absorption at central velocities of H2O and HO, as well as the NH3 and the low-J () CO emission are more likely related to the interface of the PDR with the molecular cloud and to the bulk of the molecular cloud, respectively. In the following sections, we model the emission from CO and isotopologues, H2O and NH3 with different degrees of approximation to derive the physical conditions at which they arise and derive an estimate of their abundances. The detailed analysis of the [C ii ] line is postponed for a more detailed study that includes the [13C ii ] observations (Pilleri et al., in prep.).
4 LVG modeling
In this section, we present local radiative transfer calculations to determine the water and ammonia abundance toward Mon R2, by assuming a uniform density and temperature layer. This approach is somewhat simplistic because different phases of gas are mixed along the line of sight, but gives a first rough estimate of the water and ammonia abundance as a function of the physical conditions in the beam.
For the sake of simplicity, we separated the line profiles into three velocity intervals, and analyzed each of them independently. This allowed us to separate the optically thick and self-absorbed part of the line profiles from the optically thin wings. The velocity intervals are defined as follows:
-
•
= [4.5-8.5] km s-1,
-
•
= [8.5-12.5] km s-1,
-
•
= [12.3-20.5] km s-1.
| Units | ||||
| [4.5-8.5] km s-1 | [8.5-12.5] km s-1 | [12.5-20.5] km s-1 | ||
| C18O (21) | [K] | 0.58 | 2.93 | 0.093 |
| C18O (54) | [K] | 0.29 | 2.93 | 0.08 |
| 2 | 1 | 0.86 | ||
| (C18O)/ | [cm-2] | |||
| o-HO () | [K] | 0.052 | ||
| R | - | 0.018 | - | |
| (o-HO) | - | - | ||
| 12CO (98) | [K] | 5.11 | 24.86 | 2.83 |
| o-H2O () | [K] | 0.08a𝑎aa𝑎aSelf-absorbed profile. | -0.13a𝑎aa𝑎aSelf-absorbed profile. | 0.59 |
| R | - | - | 0.21 | |
| (o-H) | - | - | ||
| o-NH3 () | [K] | 0.52 | ||
| - | 0.18 | - | ||
| (NH3) | - | - | ||
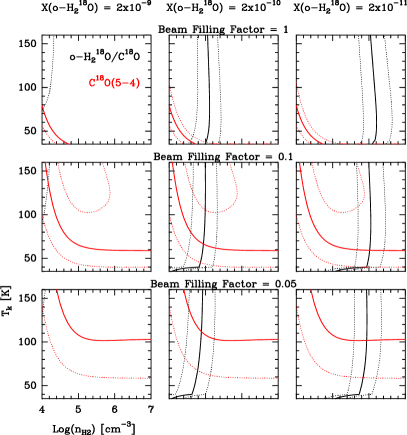
For each of the velocity intervals, we used a large velocity gradients (LVG) code to fit the line intensities and estimate the column densities and abundances of H2O (MADEX, Cernicharo, 2012) and NH3 (RADEX, van der Tak et al., 2007). Table 2 shows the averaged main beam temperature measured per velocity interval () observed toward the IF. The gas column densities toward the IF were obtained by fitting the intensity of the optically thin C18O (21) and (54) lines as well as their ratio. Gas densities and kinetic temperatures were varied in a reasonable range for this region ( cm-3, K) and the grid was repeated for different values of the beam filling factor and abundance.
4.1 HO emission
We modeled the intensity of the optically thin line o-HO (11,000,1) to obtain a first estimate of the water abundance in . We fit the intensities of the C18O (54) and o-HO (11,000,1) lines and their ratio, assuming a standard isotopic ratio 16O/18O=500 and a 12CO abundance relative to H2 of . We used the new collisional rate coefficients by Daniel et al. (2011) for o-H2O and Yang et al. (2010) for CO. We also assumed an H2 ortho-to-para ratio (OTP) of 3. Since the collisional coefficients of H2O with ortho- and para-H2 species are asymmetric, the results depend on the assumed OTP ratio. In particular, assuming a lower OTP ratio would result in the need of higher densities to excite H2O.
Figure 4 shows the results of the LVG modeling. The intensities of the lines and their ratio can be reproduced reasonably well assuming a beam filling factor () of 0.1 or lower. Several solutions can be found with this , corresponding to different density-abundance pairs. The line intensities can be fitted with several combination of these two parameters, which reflects a degeneracy between the gas density and the water abundance. Considering the range of densities that are expected to be found in Mon R2, the solutions correspond to a water abundance between and relative to H2. The highest value is obtained if the emission arises from relatively low-density gas ( a few cm-3), whereas the lowest abundance corresponds to gas densities of cm-3.
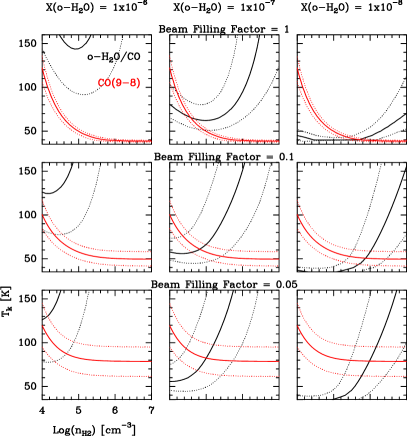
4.2 H2O emission
Because the H2O lines are heavily self-absorbed at central velocities, we concentrated our LVG analysis on the emission in the red wings, in the velocity interval . Emission from 12CO (9-8) and o-H2O (11,000,1) is expected to arise in similar physical conditions, because both lines need relatively high temperatures and densities to be excited. We modeled the intensity of the o-H2O emission and the ratio o-H2O 11,000,1)/CO 98) to derive the water abundance in the line wings.
Assuming a beam filling factor , which would imply an angular extension of the region emitting in the red wings of 38″, we only found solutions for o-H2O abundances between 10-8 and 10-7 relative to H2. The highest water abundance corresponds to a molecular hydrogen density of cm-3 and gas kinetic temperature of about 70 K. For an abundance 10-8, densities of several 105 cm-3 and temperatures 50 K are needed to reproduce the measured line intensities. Since both set of values are within the range of physical conditions that we can accept for this region, we cannot easily distinguish between them.
To assume a beam filling factor of 1, however, is a limiting case, since the high-velocity wings are concentrated in the PDR around the UC H ii region. A beam filling factor =0.1 would correspond to the case of an emission ring extending only in the plane of the sky with a thickness of 2″ and a diameter of 20″, which is consistent with the size of the PDR traced by PAH emission around this region (Berné et al., 2009). Assuming these lower values of , we found a water abundance (o-H2O) in the range [] for reasonable physical conditions in this region ( of several cm-3 and between 50 and 100 K). These values of molecular hydrogen density are consistent with the physical conditions derived by Berné et al. (2009) on the basis of the purely rotational lines of H2 that trace the PDR. This supports the scenario of an expanding PDR in which the highest velocities are associated to the molecular gas closer to the UC H ii regions, i.e., the warm HI/H2 layer traced by the PAHs and the H2 rotational lines. However, the possible contribution of an outflow component cannot be discarded, especially to the southwest, where the outflow detected by Xu et al. (2006) has its maximum emission.
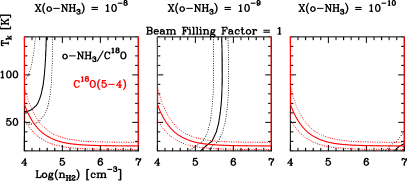
4.3 NH3
We used the same approach to estimate the o-NH3 abundance in . The profiles of the o-NH3 lines are not self-absorbed, and can be used to obtain a direct estimate of the column density of this species for all velocity intervals. In contrast to water, the NHCO 98) ratio decreases at higher velocities, corroborating our interpretation that the NH3 emission does not come from the innermost part of the PDR, but from the bulk of the molecular cloud.
We have fitted the intensity of the o-NH3 line and its ratio to the C18O (54) line using the collisional rate coefficients from Danby et al. (1988). The results for are reported in Fig. 4. Assuming a beam filling factor of 1, consistent with the large extension observed with HIFI, our data are reasonably well reproduced with a density of cm-3, a gas kinetic temperature of 50K and an ammonia abundance . The opacity of the o-NH3 line are of the order of , so the lines are very optically thick. Lower values of the NH3 abundances are associated to higher densities that have no evidence in MonR2.
5 A simple spherical model of MonR2
In this section, we test a simple geometrical model of the region to reproduce the observed line profiles. The model assumes an expanding spherical structure composed of concentric layers with given physical conditions (gas temperature and local density), kinematical information (turbulent and expansion velocities), and molecular abundances. We note in advance that with such a simple, spherically symmetric model is impossible to account for all asymmetries in the velocity structure of the observations, which may reflect large-scale structures such as the outflow, small-scale inhomogeneities (clumpiness) and other kinematical effects such as rotation. Yet, we propose it as a useful step toward a better understanding of this region.
In a first step, we fit the CO observations to fine-tune the physical structure of the molecular cloud and its associated PDR. This structure is then used to fit the H2O observations by varying their abundance profiles across the cloud. To keep the model as simple as possible, we assume a double step-function abundance profile. For NH3, our observations consist of a single, optically thick line that does not provide a reliable probe of the detailed spatial distribution of the o-NH3 abundance, and we therefore exclude this molecule from this toy model.
5.1 The physical structure
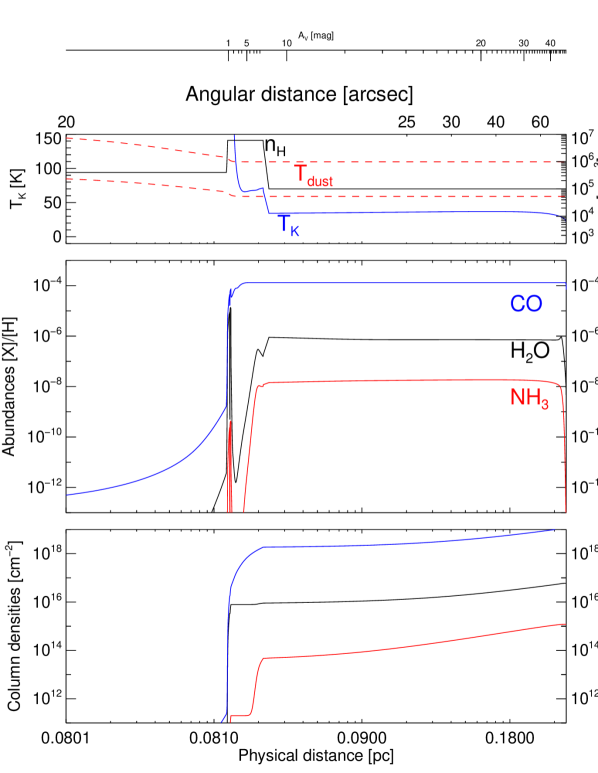
The physical structure (in terms of the length of each layer, their density and temperature) is derived based on previous observational data and modeling (Berné et al., 2009; Fuente et al., 2010). A first estimate of the gas temperature was obtained using an updated version (1.4.3) of the Meudon PDR code444http://pdr.obspm.fr/PDRcode.html (Le Petit et al., 2006; Goicoechea & Le Bourlot, 2007; Gonzalez García et al., 2008; Le Bourlot et al., 2012, cf. also Sect. 6.2 and Table 3).
The density structure in Mon R2 can be assumed to be similar to other PDRs associated to star-forming regions, such as NGC 7023 and the Orion Bar (Joblin et al., 2012, in prep.). The first layer ( 1-2 ) of the PDR is where most of the [C ii ] and PAH emission originates from (Habart et al., 2003; Joblin et al., 2010; Pilleri et al., 2012). This is generally followed by a high-density layer (or ”filament”) with cm-3, which can be several magnitudes thick and is responsible for the emission in the high-J rotational lines of CO. Finally, the bulk of the molecular cloud is usually at a lower density, and accounts for the emission of molecular tracers that are easily photo-dissociated. In our model, the outermost layer (3 mag thick) is heated from the outside, in agreement with the large large-scale PAH emission detected at 8m, which testifies to the presence of an external source of heating, especially to the north of the H ii region (Ginard et al., 2012).
In our spherical model, the central core of the ‘onion’ is represented by an H ii region with a very low density that is free of molecular gas. The H ii region is surrounded by a warm and relatively low-density expanding layer (). For this layer we adopted the density derived by Berné et al. (2009) from the H2 rotational lines. The next layer is the high-density layer, ( cm-3). extends for a few 0.001 pc ( 10 mag) and is required to explain the emission of large dipole molecular tracers such as CS, c-C3H2 and HCO+ (Ginard et al., 2012). Finally, everything is surrounded by a lower-density evelope, (Fuente et al., 2010). The inner radius of the PDR, = 0.08 pc (), is determined by the angular size of the H ii region, and the outer radius of the envelope, =0.34 pc, is fixed on basis of the extension of the 13CO 21 and C18O 21 line emissions (Fig. 1). The values of and are tuned to fit the CO (and isotopologues) lines. Summarizing:
For the kinematics, we adopted the expansion velocity law
| (1) |
in which is the radial distance from the center of the sphere and is the expansion velocity at . This law mimics the expansion velocity profiles commonly used to model H ii regions, with the surrounding envelope expanding at a lower velocity compared to the PDR and the H ii region (Lebrón et al., 2001).
Finally, we included a continuum source in our model to reproduce the fluxes measured with Herschel. The continuum fluxes toward the IF are well reproduced by a modified black body at the temperature of 500 K with an opacity of 0.1 at 50 m, an exponent for the opacity law of 1 and a radius of 0.03 pc. This enables one to adequately fit the continuum levels toward the IF, but underestimates it at larger offsets. The presence of other continuum sources in the background might help to reproduce the continuum levels at large distance from the IF, but these are not included in our model for simplicity.
5.2 CO lines
We used our non-local radiative transfer code (Cernicharo et al., 2006b) to fit the line profiles at various offsets along the HIFI stripes. We adopted a standard 12CO abundance relative to H2 of 10-4 and the isotopic abundance ratios of 12C/13C=50 and 16O/18O=500.
Assuming the density structure described above and the gas kinetic temperature derived with the Meudon PDR code, we fine-tuned the values of and and the kinematical parameters to best reproduce the CO observations. The integrated intensities are well-fitted with and being 0.082 pc and 0.083 pc, respectively. To improve the fit of the CO lines, the mean kinetic temperature of the outermost 3 mag of the cloud is set to 50 K, which corresponds to an external radiation field of a few 100. This value is consistent with an extended PDR at a distance of , which is illuminated by the UV field produced by IRS1.
The best fit to the line profiles was obtained using the velocity law of Eq. 1 with . We have also varied the turbulent velocities to improve the fit of the wings of the 12CO lines. The best solution is found with a turbulent velocity of 1 km s-1 in and 1.5 km s-1 in Lenv. To reproduce the high-velocity wings, we fixed the expansion and turbulent velocity in to 2 km s-1 and 5 km s-1, respectively. We stress that because the model has so many parameters, other solutions may be found that reproduce the CO emission well, especially in the wings. Higher resolution observations will be very useful to improve our knowledge of the structure of this region. Figure 5 shows a summary of the physical structure and the velocity profile across the PDR.
Figure 6 displays the model results and the comparison with the observations. Although the overall quality of the low-J lines is very good, there are some discrepancies. The model falls short of the high-J () CO lines at offsets [-20″, -20″] to [+20″,+20″]. This is not unusual in PDR, because current PDR models fail to reproduce the intensity of the high-J lines of CO. There are various effects that can be invoked to explain this missing intensity, i.e. clumpiness and an erroneous description of the microphysics of PDRs, which may influence the heating and the chemistry of PDRs (Joblin et al., 2012, in prep). The presence of a high-velocity outflow, or the inclusion of rotation may all be possible ways to improve the fit. However, this accurate level of modeling is beyond the scope of this paper.

5.3 HO and H2O
We used the physical and kinematical structure derived above to constrain the abundance of water in each layer of the cloud. We assumed an abundance profile defined as a double step-function and the standard ortho-to-para ratio of 3. We varied the abundances in the three regions to reproduce the line profiles of all H2O lines.
The emission of HO is optically thin and does not present significant emission in the wings, and therefore its intensity is influenced mainly by the low-velocity layers and . We were able to reproduce the intensity and profile of this transition at all offsets by assuming an abundance o-H2O) in and in . These values are consistent with the results of the local LVG modeling assuming a beam filling factor and with the previous estimate reported in Fuente et al. (2010). With the assumed physical structure, small variations of the water abundances (more than a factor of 2) from these values do not allow one to fit the observed intensities and spatial distribution. However, the main source of uncertainty is the assumed values for and . Considering the range of physical conditions that is observed in Mon R2, we can estimate our final error bars in the water abundances to be of one order of magnitude.
With the same velocity profile, we tried to reproduce both the ortho- and para-H2O lines at all offsets (See Fig. 6). However, both lines are very optically thick and variations in the morphology and kinematics of the cloud can strongly modify the line profiles. Therefore, we concentrated our efforts on the modeling of the red wings only, which are optically thin and therefore less sensible to small variations of the detailed velocity structure. To reproduce the line wings, we varied the abundance of H2O in the layer . Our best fit is obtained with an abundance of o-H2O in this layer, consistent with the results of the LVG modeling assuming a density of a few and high kinetic temperature (between 50 and 150 K). Similarly to HO, the main source of uncertainty for H2O are the model parameters. However, the physical conditions in this layer are relatively well constrained (Berné et al., 2009) and the corresponding water abundances are in the range [] relative to H2. As mentioned above, the complete velocity profile of the main isotopologues is very dependent on the assumed kinematics and abundance. Therefore, it is difficult to obtain a very good fit of all spectra with a very simple model like ours. There are a few discrepancies between the observed H2O profiles and the model. The observations are not symmetric between positive and negative offsets, and there is often an excess emission in the blue wings. These differences are most likely due to the unrealistic assumption that our cloud is perfectly spherical and symmetric under any point of view. The PV diagram of [C ii ] clearly shows that the kinematical pattern is not symmetric. The wings are wider at red velocities, probably because of the cometary shape of the nebula. In our model, we have used the red wings as the basis for our expansion pattern which is very likely incorrect for the blue part.
Summarizing, we derived a relatively constant () abundance of water in the high-density region and in the envelope, and a larger abundance () in the high-velocity gas. With these abundances, we obtained very good fits to all three water lines at the same time. With the assumed physical structure, the abundances are relatively well constrained (within a factor of 2), since small variations of the water abundance have a strong impact on all the lines. Larger variations from these values do not enable one to reproduce all th lines at the same time. However, since the density and velocity structure are not very well constrained and because of the degeneracy between density and abundance, we speculate that a reasonable uncertainty on the water abundance is one order of magnitude.
6 Discussion
6.1 H2O abundances in MonR2 and the ISM
The results of the previous sections on the water abundance can be summarized as follows. In the gas at low velocities, the abundance of water is a few relative to H2. The spatial distribution and the radiative transfer analysis of the HO line suggests that the low-velocity water emission arises in a region of enhanced density and relatively small volume centered toward the IF. This corresponds to the physical conditions of the high-density PDR proposed by Rizzo et al. (2003).
In the high-velocity gas, the abundance seems to be about an order of magnitude higher and the origin of the wing emission is more doubtful. In our simplistic ‘onion’ model of Mon R2, both the red emission and blue absorption are due to the expanding gas associated with the PDR surrounding the H ii region (Rizzo et al., 2005; Fuente et al., 2010). In this scenario, the emission in the red wing of the o-H2O line would be related to the PDR around the UC H ii region. This is consistent with the high-velocity wings observed in typical PDR tracers such as c-C3H2 and the small linewidth of shock tracers such as SiO (Rizzo et al., 2003). However, our simple model cannot reproduce the detailed spectral profiles of the H2O lines. In particular, our model overestimates the blue-shifted emission at every position in the strip and it cannot reproduce the red wings at the offsets (-40″,-40″) and (-60″,-60″) (see Fig. 6). An asymmetric expanding PDR, and the contribution of the molecular outflow to the water line profiles are very likely the cause of this discrepancy.
The values derived in this work for the water abundances are similar to those commonly found in massive star-forming regions, and somewhat lower than those usually found in outflows and hot cores. In early-stage massive star-forming regions such as W3 IRS5, the abundance of water has been shown to vary between in the outer and cold envelope and in the inner hot cores (Chavarría et al., 2010). Concerning lower mass star-forming regions, Lefloch et al. (2010) studied the water emission in the bipolar outflow of L1157, determining a water abundance varying between few in the warm and dense ( cm-3, K) extended part of the outflow and few in the high-velocity hot component ( K) that arises from the bow shock. Kristensen et al. (2010, 2011) derived similar abundances in the early stages of low-mass star-forming regions.
In agreement with previous estimates of the water abundance toward Orion KL based on the IRAM-30m telescope (Cernicharo et al., 1994) and ISO data (Cernicharo et al., 2006a), most recent observations with Herschel (Melnick et al., 2010) have derived a water abundance of in the outflow, much higher than that derived in this work. Using spatially resolved PACS observations, Habart et al. (2010) derived an upper limit to the water abundance in the Orion Bar of a few . This value is very consistent with our results. Still unpublished data from the WADI consortium show that water is detected also in PDRs not associated with outflows, such as NGC 7023, Ced 201 and the Horsehead nebula (Teyssier et al., in prep.). The water abundance derived in the Horsehead nebula seems to be much lower than that in MonR2, most likely because the dust temperature is very low ( K), and sticking on grains is more efficient. Interestingly, in the PDR associated to the proto-planetary disk TW Hydra, Hogerheijde et al. (2011) derived an upper limit to the abundance of water of , which is consistent with the values detected in the PDR of Mon R2.
Summarizing, the abundances measured in Mon R2 are lower than those obtained in shocked regions, similar to those observed in the outer layers of pre-stellar cores and the envelopes of young stellar objects, and consistent with the upper limit derived toward the Orion Bar.
6.2 Comparison with gas-phase PDR chemical models
It is interesting to compare our observational results with the predictions of the Meudon PDR chemical model to understand where gas-phase chemistry is sufficient to explain the observed water abundances, and where gas-grain chemistry needs to be taken into account. The input parameters to the code are reported in Table 3. We have tested the impact of using different extinction curves (a standard galactic and the Orion Bar’s) as well as varying the cosmic ray ionization rate. We did not find significant differences in the predicted water abundances in the gas phase.
| Parameter | Value | |
|---|---|---|
| radiation field intensity | ||
| external radiation field intensity | 100 | |
| total cloud depth | 50 mag | |
| extinction curve | standard galactic | |
| / | 3.1 | |
| cosmic ray ionization rate | s-1 | |
| dust minimum radius | cm | |
| dust maximum radius | cm | |
| MRN dust size distribution index | 3.5 | |
| He/H | Helium abundance | 0.1 |
| O/H | Oxygen abundance | |
| C/H | Carbon abundance | |
| N/H | Nitrogen abundance | |
| S/H | Sulfur abundance |
The water abundance predicted by the Meudon PDR code (middle panel in Fig. 7) shows significant variations with . Following a very low abundance in the most exposed layers (), the code predicts a water abundance of X[H2O] in a compact layer of about 1 mag. Subsequently, the water abundance strongly dips to in the high-density layer at about 5 mag, and increases again and reaches its maximum value of for .
Our results show that the o-H2O abundance is in the first layers of the PDR (). This is consistent with the value predicted by the Meudon code under the assumption that the outflow has only a minor contribution to the wing emission at central positions. In this layer, water is formed in gas phase via
This reaction has a high activation barrier ( K) and is significant only at K. The internal energy available in vibrationally excited H2 can help to overcome this barrier (Agúndez et al., 2010). Photodissociation is the main destruction mechanism.
In the rest of the cloud, the gas-phase predictions and the observational results do not agree. In the high-density region, the predicted water abundance is lower than , whereas the HO measurements point to a relatively high abundance of . An additional water supply mechanism, such as desorption (photo-desorption, mechanical sputtering, thermal desorption) from the grain mantles, is required. In contrast, the measured H2O abundance in the envelope is at least two orders of magnitude lower than the abundances derived by the chemical model. The freeze-out of water onto grain mantles is very likely an efficient gas-phase water destruction mechanism in this colder region. Although it is difficult to compare these results without a precise profile for the water abundance, these results clearly show that gas-phase chemistry is not sufficient to account for the water emission in this PDR.
We have also compared our results with the predictions from the PDR model of Hollenbach et al. (2009), which includes freeze-out and photo-desorption processes but does not consider turbulence. Our observational value of the water abundance in the envelope () is consistent with the model predictions assuming a typical photo-desorption yield and a grain cross sectional area cm-2. Indeed, the Hollenbach et al. (2009) model predicts that freeze-out and photo-desorption are the dominant processes to explain the water abundance starting at for the physical conditions of the Mon R2 envelope.
Summarizing, our observational results agree well with gas-phase chemical models only in the very first layers of the PDR, , where high-temperature chemistry dominates the formation and photo-dissociation is the main destruction mechanism. The water abundance in the high-velocity gas is consistent with pure gas-phase chemistry, characteristic for PDRs. In the more quiescent gas, desorption from grains must play a role. This could be provided by photo-desorption according to the PDR model of Hollenbach et al. (2009), by turbulence, or by grain destruction in shocks. Deeper into the cloud, freeze-out into grains needs also to be taken into account for taking out H2O molecules from the gas phase. A complete treatment of the gas-grain chemistry is required to explain the observational results.
6.3 Ammonia abundances
Figure 7 shows the predicted abundance for NH3 as a function of the distance from the cloud center: qualitatively, ammonia is expected to be highly abundant only in the more shielded part of the envelope. This is consistent with our observational results, which show that emission of o-NH3 is very extended, peaks outside the H ii region and does not present high-velocity wings. This is also consistent with the results of the LVG modeling presented in Sect. 3, which were obtained with a beam filling factor of 1, densities between cm-3 and cm-3 and temperatures of K. Lower densities would result in higher NH3 abundances. Comparing the abundances in the envelope obtained with the LVG modeling (few for cm-3) and with the Meudon PDR code (10-8), it seems that gas-phase chemistry slightly over-predicts the observed values, although for less than an order of magnitude.
7 Summary and conclusions
In this work, we have presented spatially and spectrally resolved observations of [C ii ], CO, o-H2O, p-H2O and NH3 along a strip crossing the PDR that surrounds the UCH ii region MonR2. Using a local and non-local radiative transfer model and assuming a spherical approximation for the whole cloud, we have fitted the line profiles and intensities of the CO, H2O and NH3 lines observed with Herschel.
The o-HO line has a narrow profile that peaks at km s-1, the rest velocity of the cloud. The emission of this line is not very extended, and reaches it maximum toward the H ii region, suggesting that there is a significant fraction of the water emission arising from relatively quiescent gas associated to the innermost parts of the cloud. This is consistent with our modeling, which yielded an abundance of water of relative to H2 in a thick layer of 10 mag surrounding the PDR and in the envelope.
The o-H2O abundance is higher, relative to H2, in red high-velocity gas. The origin of the red wings that appear in the H2O and in the high-J 12CO lines is more doubtful. The red wings of all species toward the H ii region can be well reproduced by assuming an expanding PDR with relatively high expansion and turbulent velocities of 2 km s-1 and 5 km s-1, respectively. Yet, the red wings could also have an outflow origin, particularly to the southwest half of the strip. In any case, the density of this gas is not very well constrained and therefore the precise values of the abundance need to be taken with caution, at an order-of-magnitude significance.
More work still remains to be done on the abundance of water in PDRs. The comparison of the derived abundances with gas-phase chemical modeling shows that gas-phase PDR chemistry can reproduce the observed abundances in the very first hot layer of the PDR up to an . In this innermost layer, high-temperature chemistry is the main source of production of gas-phase water in the innermost layers of the PDR. However, the outflow can contribute to the H2O emission at these high velocities. In the more shielded layers of the molecular cloud, the observational abundances differ by several orders of magnitude from the predictions of the gas-phase chemical model, suggesting that the freeze-out and photo-desorption mechanisms are the dominant processes at these cloud depths. Similarly, gas-phase chemical models overpredict the abundance of ammonia in the envelope by about one order of magnitude, suggesting that freeze-out into the grain surface needs to be taken into account for this species.
Acknowledgements.
We acknowledge F. van der Tak for useful suggestions in improving this manuscript. We also acknowledge S. Treviño-Morales and A. Sanchez-Monge for their help with complementary data. We also thank the anonymous referee for his constructive report.This paper was partially supported by Spanish MICINN under projects and AYA2006-14876, AYA2009-07304 and within the program CONSOLIDER INGENIO 2010, under grant CSD2009-00038 Molecular Astrophysics: The Herschel and ALMA Era (ASTROMOL).
Part of this work was supported by the Deutsche Forschungsgemeinschaft, project number Os 177/11. HIFI has been designed and built by a consortium of institutes and university departments from across Europe, Canada and the United States under the leadership of SRON Netherlands Institute for Space Research, Groningen, The Netherlands and with major contributions from Germany, France and the US. Consortium members are: Canada: CSA, U.Waterloo; France: CESR, LAB, LERMA, IRAM; Germany: KOSMA, MPIfR, MPS; Ireland, NUI Maynooth; Italy: ASI, IFSI-INAF, Osservatorio Astrofisico di Arcetri-INAF; Netherlands: SRON, TUD; Poland: CAMK, CBK; Spain: Observatorio Astron mico Nacional (IGN), Centro de Astrobiolog a (CSIC-INTA). Sweden: Chalmers University of Technology - MC2, RSS & GARD; Onsala Space Observatory; Swedish National Space Board, Stockholm University - Stockholm Observatory; Switzerland: ETH Zurich, FHNW; USA: Caltech, JPL, NHSC.
References
- Agúndez et al. (2010) Agúndez, M., Goicoechea, J. R., Cernicharo, J., Faure, A., & Roueff, E. 2010, ApJ, 713, 662
- Berné et al. (2009) Berné, O., Fuente, A., Goicoechea, J. R., et al. 2009, ApJ, 706, L160
- Cernicharo (2012) Cernicharo, J. 2012, in EAS Publications Series, ed. C. Stehlé, C. Joblin, & L. d’Hendecourt, in press
- Cernicharo et al. (2006a) Cernicharo, J., Goicoechea, J. R., Daniel, F., et al. 2006a, ApJ, 649, L33
- Cernicharo et al. (2006b) Cernicharo, J., Goicoechea, J. R., Pardo, J. R., & Asensio-Ramos, A. 2006b, ApJ, 642, 940
- Cernicharo et al. (1994) Cernicharo, J., Gonzalez-Alfonso, E., Alcolea, J., Bachiller, R., & John, D. 1994, ApJ, 432, L59
- Chavarría et al. (2010) Chavarría, L., Herpin, F., Jacq, T., et al. 2010, A&A, 521, L37
- Choi et al. (2000) Choi, M., Evans, II, N. J., Tafalla, M., & Bachiller, R. 2000, ApJ, 538, 738
- Danby et al. (1988) Danby, G., Flower, D. R., Valiron, P., Schilke, P., & Walmsley, C. M. 1988, MNRAS, 235, 229
- Daniel et al. (2011) Daniel, F., Dubernet, M.-L., & Grosjean, A. 2011, A&A, 536, A76
- de Graauw et al. (2010) de Graauw, T., Helmich, F. P., Phillips, T. G., et al. 2010, A&A, 518, L6
- Downes et al. (1975) Downes, D., Winnberg, A., Goss, W. M., & Johansson, L. E. B. 1975, A&A, 44, 243
- Fuente et al. (2010) Fuente, A., Berné, O., Cernicharo, J., et al. 2010, A&A, 521, L23
- Giannakopoulou et al. (1997) Giannakopoulou, J., Mitchell, G. F., Hasegawa, T. I., Matthews, H. E., & Maillard, J.-P. 1997, ApJ, 487, 346
- Ginard et al. (2012) Ginard, D., González-García, M., Fuente, A., et al. 2012, A&A, 543, A27
- Goicoechea & Le Bourlot (2007) Goicoechea, J. R. & Le Bourlot, J. 2007, A&A, 467, 1
- Gonzalez García et al. (2008) Gonzalez García, M., Le Bourlot, J., Le Petit, F., & Roueff, E. 2008, A&A, 485, 127
- Habart et al. (2003) Habart, E., Boulanger, F., Verstraete, L., et al. 2003, A&A, 397, 623
- Habart et al. (2010) Habart, E., Dartois, E., Abergel, A., et al. 2010, A&A, 518, L116
- Habing (1968) Habing, H. J. 1968, Bull. Astron. Inst. Netherlands, 19, 421
- Henning et al. (1992) Henning, T., Chini, R., & Pfau, W. 1992, A&A, 263, 285
- Hoare et al. (2007) Hoare, M. G., Kurtz, S. E., Lizano, S., Keto, E., & Hofner, P. 2007, Protostars and Planets V, 181
- Hogerheijde et al. (2011) Hogerheijde, M. R., Bergin, E. A., Brinch, C., et al. 2011, Science, 334, 338
- Hollenbach et al. (2009) Hollenbach, D., Kaufman, M. J., Bergin, E. A., & Melnick, G. J. 2009, ApJ, 690, 1497
- Joblin et al. (2010) Joblin, C., Pilleri, P., Montillaud, J., et al. 2010, A&A, 521, L25
- Joblin et al. (2012) Joblin et al., C. 2012, A&A, in preparation
- Kristensen et al. (2011) Kristensen, L. E., van Dishoeck, E. F., Tafalla, M., et al. 2011, A&A, 531, L1
- Kristensen et al. (2010) Kristensen, L. E., Visser, R., van Dishoeck, E. F., et al. 2010, A&A, 521, L30
- Le Bourlot et al. (2012) Le Bourlot, J., Le Petit, F., Pinto, C., Roueff, E., & Roy, F. 2012, A&A, in press
- Le Petit et al. (2006) Le Petit, F., Nehmé, C., Le Bourlot, J., & Roueff, E. 2006, ApJS, 164, 506
- Lebrón et al. (2001) Lebrón, M. E., Rodríguez, L. F., & Lizano, S. 2001, ApJ, 560, 806
- Lefloch et al. (2010) Lefloch, B., Cabrit, S., Codella, C., et al. 2010, A&A, 518, L113
- Loren (1977) Loren, R. B. 1977, ApJ, 215, 129
- Massi et al. (1985) Massi, M., Felli, M., & Simon, M. 1985, A&A, 152, 387
- Melnick et al. (2010) Melnick, G. J., Tolls, V., Neufeld, D. A., et al. 2010, A&A, 521, L27
- Ossenkopf et al. (2011) Ossenkopf, V., Röllig, M., Kramer, C., et al. 2011, in EAS Publications Series, Vol. 52, EAS Publications Series, ed. M. Röllig, R. Simon, V. Ossenkopf, & J. Stutzki, 181–186
- Ott (2010) Ott, S. 2010, in ASP Conf Ser, Vol. 434, Astronomical Data Analysis Software and Systems XIX, ed. Y. Mizumoto, K.-I. Morita, & M. Ohishi, 139
- Pety (2005) Pety, J. 2005, in SF2A-2005: Semaine de l’Astrophysique Francaise, ed. F. Casoli, T. Contini, J. M. Hameury, & L. Pagani, 721
- Pilbratt et al. (2010) Pilbratt, G. L., Riedinger, J. R., Passvogel, T., et al. 2010, A&A, 518, L1
- Pilleri et al. (2012) Pilleri, P., Montillaud, J., Berné, O., & Joblin, C. 2012, A&A, 542, A69
- Rizzo et al. (2005) Rizzo, J. R., Fuente, A., & García-Burillo, S. 2005, ApJ, 634, 1133
- Rizzo et al. (2003) Rizzo, J. R., Fuente, A., Rodríguez-Franco, A., & García-Burillo, S. 2003, ApJ, 597, L153
- Roelfsema et al. (2012) Roelfsema, P. R., Helmich, F. P., Teyssier, D., et al. 2012, A&A, 537, A17
- Snell et al. (2000) Snell, R. L., Howe, J. E., Ashby, M. L. N., et al. 2000, ApJ, 539, L101
- Tafalla et al. (1994) Tafalla, M., Bachiller, R., & Wright, M. C. H. 1994, ApJ, 432, L127
- Tafalla et al. (1997) Tafalla, M., Bachiller, R., Wright, M. C. H., & Welch, W. J. 1997, ApJ, 474, 329
- van der Tak et al. (2007) van der Tak, F. F. S., Black, J. H., Schöier, F. L., Jansen, D. J., & van Dishoeck, E. F. 2007, A&A, 468, 627
- Xu et al. (2006) Xu, Y., Shen, Z.-Q., Yang, J., et al. 2006, The Astronomical Journal, 132, 20
- Yang et al. (2010) Yang, B., Stancil, P. C., Balakrishnan, N., & Forrey, R. C. 2010, ApJ, 718, 1062