The role of oxygen vacancies on the structure and the density of states of iron doped zirconia.
Abstract
In this paper we study, both with theoretical and experimental approach, the effect of iron doping in zirconia. Combining density functional theory (DFT) simulations with the experimental characterization of thin films, we show that iron is in the oxidation state and accordingly that the films are rich in oxygen vacancies (). favor the formation of the tetragonal phase in doped zirconia (:) and affect the density of state at the Fermi level as well as the local magnetization of atoms. We also show that the and energy levels can be used as a marker for the presence of vacancies in the doped system. In particular the computed position of the peak is strongly sensitive to the to atoms ratio. A comparison of the theoretical and experimental peak position suggests that in our films this ratio is close to .
Besides the interest in the material by itself, : constitutes a test case for the application of DFT on transition metals embedded in oxides. In : the inclusion of the Hubbard correction significantly changes the electronic properties of the system. However the inclusion of this correction, at least for the value chosen in the present work, worsen the agreement with the measured photo–emission valence band spectra.
pacs:
68.55.Ln,71.15.Mb,75.50.PpIntroduction
In dilute magnetic semiconductors (DMS) magnetic impurities, usually transition metals (TM), are introduced to produce a magnetic ground state. These systems have been extensively investigated since the discovery of carrier induced ferro–magnetism in Ohno1992 and Ohno1996 , and are believed to be fundamental to fabricate spin–based electronic devices. The understanding of DMS physical properties constitutes a challenge for the theory as the fundamental mechanism leading to ferromagnetic interaction can be hardly explained Coey2005_Nature . Also experimentally the inclusion and the influence of TM doping is not clearly understood. Indeed, while several DMS were predicted to have a Curie temperature () above room temperature, no experimental report of has been left unchallenged by other studies Sato2010 . Moreover some results suggest that magnetic impurities, at least at very low doping concentration, act as paramagnetic centers Gunnlaugsson2010 . Recently a new class of DMS, based on oxides such as zirconia () and hafnia (), has received great attention, after the experimental reports of room temperature magnetism in doped and Hong2005 ; Hong2006 ; Hong2012 ; Coey2005 ; Kriventsova2006 ; Sahoo2009 and the theoretical prediction of high in TM doped Ostanin2007 ; Archer2007 .
For a better understanding of the magnetic properties of the system, a clear picture of its structural and electronic properties is fundamental. As opposite to standard bulk materials, where usually the most stable configuration can be unequivocally identified, in DMS the inclusion of the dopant can induce stress, disorder and defects in the system with many possible configurations close in energy. From one side, theoretically, the modeling of the material, also at the first–principles levels, requires some assumptions on the initial structure and on the position occupied by the dopant. From the other side, experimentally, stress, disorder and defects make difficult to provide a unique interpretation to the features observed. Thus a combined approach is the best option.
Among the structural defects of dilute magnetic oxides (DMO), oxygen vacancies () are believed to affect the magnetism Hong2005 ; Coey2005 ; Hong2005_PRB . Indeed it has been suggested that delocalized electrons, associated with , can play a crucial role in the magnetization mechanisms of DMO Coey2005_Nature . However, in this model, are assumed to always induce delocalized states, which can mediate the magnetic interaction. This assumption is true in the undoped oxide, while in presence of doping should be verified case by case.
In the present paper we describe the structural and electronic properties of iron doped zirconia (:) focusing our attention on the role of and on their relation with the dopant. The role of in :, and more in general of doped with valence elements (, with etc…) has been, in part, explored in view of different applications, for oxygen sensing Cao2001 ; Cao2002 ; Stefanic2000 and more recently for resistive switching memories Zhang2010 ; Spiga2012 . For : in particular only few experimental reports exist. Also for TM doped oxides in general, no systematic theoretical description of the relation between and doping exist. For example the formation energy, in presence of doping, is usually considered Zhang2010 only for the to dopant atoms ratio, , equal to 1 and again are assumed to induce delocalized states which could mediate the electron conduction in case of resistive switching, regardless of the value of .
Instead, in case of elements, like iron, the most stable configuration is expected to have for charge compensation Stapper1999 . We thus focus our attention on this configuration describing how the properties of the system would change if deviates from the value .
In sec. I we describe both the theoretical and the experimental approach to the description of :. The results from first–principles simulations are presented in sec. II. The electronic and structural properties of the system are described in function of the doping and oxygen vacancies concentration within density functional theory (DFT) in the standard generalized gradient approximation (GGA). For TM oxides the standard approximations to DFT are known to fail in the description of the so called on–site correlation. Thus DFT can be corrected with a “Hubbard” term, DFT+ scheme, where is an external parameter, which improves the DOS of the valence electrons. However little is known in the case of TM used as dopant in DMO. Thus we also investigate how this term would influence the electronic properties of the system in :.
The experimental results are then presented in sec. III. Here we show that, indeed, the measured properties best agrees with the configuration. Moreover a detailed comparison of the measured valence band (VB) and DFT density of states (DOS) is done. This is a direct way to explore the value of the on–site electronic correlation on this system, i.e. to adjust the value of the parameter to be used in the DFT+ approch.
I Framework
I.1 Computational approach
We computed, from first–principles, the ground state of the two most common phases of , i.e. the tetragonal and the monoclinic phases, at different doping concentrations. We used the PWscf (4.3.2) package QuantumEspresso , considering a super–cell with 96 atoms (few less when are considered) and in some cases also a smaller super–cell with 12 atoms for the description of the highest doping configuration. For all systems the atomic positions are fully relaxed. The ground state was computed within the GGA Perdew1996 to the DFT scheme Hohenberg1964 ; Kohn1965 with ultra–soft pseudo–potentials Vanderbilt1990 ; Rappe1990 . We used a 35 cut—off for the wave–functions, 400 cut—off for the augmentation density and a Monkhorst–Pack grid 2x2x2 for the Brillouin zone to have the error on the energy differences between the monoclinic and the tetragonal phase lower than per formula unit (); this was the most stringent condition for our simulations. We estimated the error on the total energy to be lower than . Convergence paramenters are on the total energy for the scf cycles and both on the total energy and on the forces for the atomic relaxation. The pseudo–potential of includes semi–core electrons. atoms were placed at the substitutional sites and kept as far as possible from each other to mimic uniform doping. For instead we considered many different configurations (see discussion in sec. II), specifically we considered : at the atomic doping concentration with, , and without, , oxygen vacancies. We also considered for . In total we studied about different systems of changing and for either the monoclinic or the tetragonal structure. For few selected configurations, i.e. at the lowest and the highest considered doping concentrations , we also performed calculations within the simplified GGA+ approach Cococcioni2005 implemented in the PWscf package, again considering , in order to explore the effect of the Hubbard correction on the electronic structure of the system. The results are presented mainly for the high–doping situation which we have also experimentally. The configurations at and resulted to be metallic and in these case the convergence of the physical quantities against the sampling of the k–points grid was verified.
The cell parameters for both the tetragonal and the monoclinic phase of pure are the same used in Ref. Sangalli2011, . Specifically for the monoclinic phase Å, , and ; while for the tetragonal phase Åand . The same parameters were used for : as well. However we even performed a full relaxation of our 96 atoms super–cell for few selected configurations and we found out that this have a negligible impact on the properties of the system here considered.
In sec. II we systematically compare the results of the present simulations with the : ( doped ) system. Yttrium is one of the most studied and used dopant of and shares with iron the same valence. All the data reported for : are from ref. Sangalli2011, .
In order to describe the semi–core levels of iron and compare the results with XPS measurements, we run calculations with a norm–conserving fully–relativistic approach. To this end, we used Hartwigsen, Goedecker, and Hutte (HGH) pseudo–potentials Hartwigsen1998 which contain semi–core electrons in valence and are constructed with a fully relativistic calculation. The latter are not available within the PWscf QuantumEspresso code and so we used the abinit (6.8) code Abinit . We studied the semi–core levels only for the case again considering . We used smaller super–cells, 12 atoms ( and ) and a 24 atoms supercell (), with cut–off of 170 and a Monkhorst–Pack grid 3x3x3 and 3x3x2 respectively for the Brillouin zone to have the error on the energy levels position lower then . The very high energy cut–off was needed, as the norm conserving HGH pseudo–potentials are harder than the ultra–soft ones used with PWscf and also because the semi–core levels are much more localized than valence electrons. The value was chosen to have smaller super-cells but also because this is quite close to the experimentally measured doping concentration in our films. The atomic positions instead were obtained relaxing the same structures with the PWscf code and then we checked that the residual forces on the atoms computed with Abinit were negligible.
Finally for a quantitative comparison of the measured photo–emission and the computed valence band we have performed calculations within GGA+ at at and . A theoretical smearing of was used to generate the DOS used in Figs. 3-4 while a higher smearing of was used for the DOS in Fig. 7 to mimic the experimental peak width.
I.2 Experimental setup
Experimentally and : thin films were grown on substrates in a flow–type hot wall atomic layer deposition reactor (ASM F120) starting from –diketonates metalorganic precursors, namely for and for . To grant a stable reactivity, precursor was kept at C, while precursor was maintained at C. Ozone was used as oxidizing gas in the reaction process The film growth was achieved by alternately introducing the reactants separated by inert gas purging pulses. The concentration in : films was tuned tailoring the precursors pulsing ratio and the growth temperature was maintained at C (details in Ref. Lamperti2012, ). After the deposition the films were annealed at C in flux for 60s. The growth parameters were tuned in order to fix the thickness, , and the doping concentration for the : films. was chosen in order to stabilize the tetragonal phase according to our theoretical results.
Film crystallinity was checked by X–ray diffraction (XRD) at fixed grazing incidence angle and using () monochromated and collimated X–ray beam (details in Ref. Lamperti2011, ). Film uniform doping along its thickness was checked by Time of Flight Secondary Ion Mass Spectrometry (ToF–SIMS) depth profiling using an ION–TOF IV instrument, with ions for sputtering and ions for analysis. Secondary ions were collected in negative polarity and interlaced mode. Recorded intensities were normalized to intensity in bulk silicon. The instrument depth resolution is below 1 nanometer.
To elucidate chemical state and concentration in : films, X–ray photo–emission (XPS) measurements were performed on a PHI 5600 instrument equipped with a monochromatic Al x-ray source ( eV) and a concentric hemispherical analyzer. The spectra were collected at a take–off angle of and band–pass energy . The instrument resolution is .
II First principles predictions
II.1 and structural properties
In the literature : has been studied as a candidate material for oxygen sensing applications because atoms, replacing atoms, are expected to induce oxygen vacancies for charge compensation Cao2001 ; Cao2002 . Thus, as a first step, we consider the formation energy:
| (1) |
at fixed , i.e. for a charge compensated system. Here we considered both the oxygen rich condition (Fig. 1.(a), with the total energy of an isolated oxygen molecule in its ground state) and the oxygen poor condition (Fig. 1.(b), ). The formation energy for : is compared with the case of pure , and :, . To this end we considered different concentrations and, for each, different configurations. However we found that is mainly determined by the kind of dopant, while the influence of the other parameters is lower. In Fig. 1 the changes due of these parameters results in different values for each system.
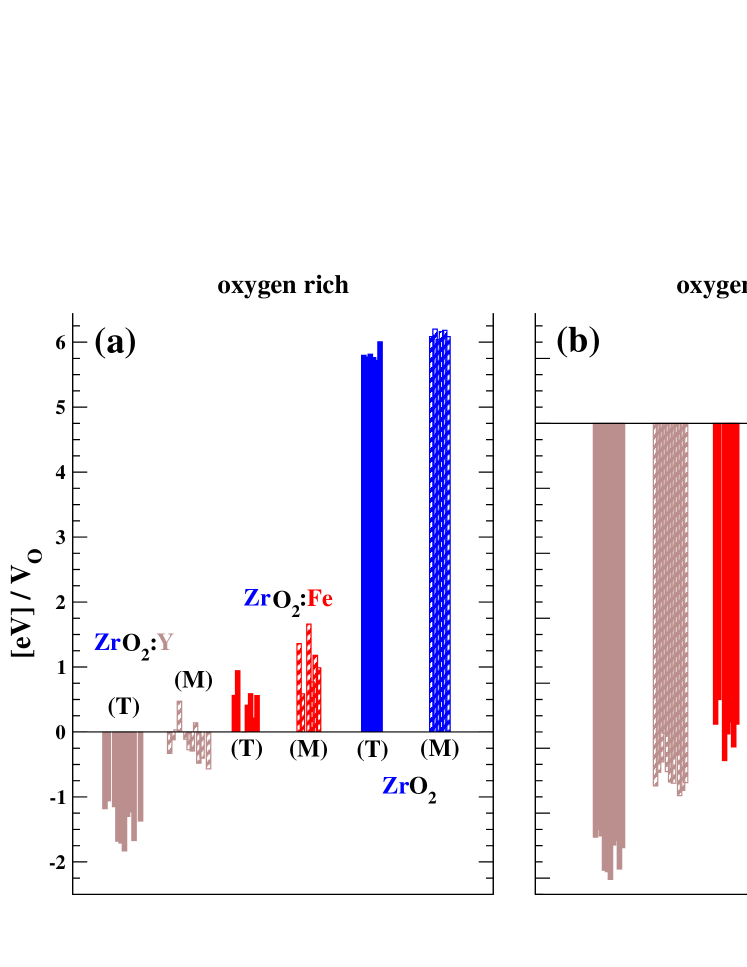
While the formation energy is negative in : already in the oxygen rich case, in : films it is slightly positive, i.e. , but ten times lower than in pure . Varying the chemical potential from the oxygen rich to the oxygen poor configuration becomes negative, thus favors the formation of .

The creation of oxygen vacancies induces disorder in the system (see also the inset in Fig. 6) thus the most symmetric phases are expected to be favored against the monoclinic phase. To evaluate this effect in Fig. 2 we consider the energy difference between the tetragonal and the monoclinic phase as a function of the doping concentration, at fixed . We look for the iron atomic percent, , at which the tetragonal phase becomes favored.
The value of is very small and thus at the limit of the DFT–GGA resolution. The computed energy difference between the two phases at zero doping is , in agreement with previous works, (Stapper1999 , Dewhurst1998 ); the experimental estimation is Achermann1975 . It is reasonable to assume that the trend of the energy difference is better computed than its absolute value and accordingly, assuming a constant “zero–doping error” of for every concentration, we can subtract it. Being of the order of few also the phonon energy of the two lattice could play a role. Indeed the monoclinic to tetragonal phase transition at can be explained in this terms Lou2009 ; Debernardi . Thus we considered the energy difference of the lattice between the two structures for the undoped system. At room temperature however we found this contribution to be almost negligible, .
come out, instead, to be particularly sensitive to the chosen atomic configuration. Accordingly the data in Fig. 2 are scattered, with changing of few at given . To extract the exact a statistical occupation of the different configurations should be considered. However, to this end, one should sample a huge number of configurations, which is not feasible within DFT. In the present paper we assumed that, fixed and , changing the configurations for the , spans uniformly a given energy range () which can be extrapolated considering a limited number of configurations. is expected to increase, increasing the doping concentration, as an increasing number of configurations becomes available. With this assumptions was extracted considering the central value of the .
In practice this was done with a linear fit of the data. In Fig. 2, to obtain the critical doping concentration, at zero doping is matched at the experimental value , while the theoretical results would be . The result, , can be compared with the case of :, where the same approach gives which exactly matches the experimental value Sangalli2011 . We stress that with this approach the exact doping concentration can be affected by an error which can be as large as few atomic percent. What is significant here is the comparison of the two systems, i.e. : and :. Indeed both dopants, inducing oxygen vacancies favor the tetragonal against the monoclinic structure. However the two linear fits posses different slopes and we can conclude that iron is less efficient than yttrium in inducing a monoclinic to tetragonal phase transition. In Fig. 2 we also report the energy difference between the monoclinic and the tetragonal phase for the case without oxygen vacancies, i.e. . In this configuration we found that the local structure of the crystal is much less distorted by doping and accordingly the variation of the energy difference between the two phases is small. This confirms that a key role in the monoclinic to tetragonal phase transition is played by oxygen vacancies Sangalli2011 and not by the dopant itself.
II.2 Electronic properties
Given the results of the previous section and the fact that experimentally we describe a system at high doping concentration, which we found to be in the tetragonal phase, in the description of the electonic properties of the system we focus our attention on the tetragonal structure of :.
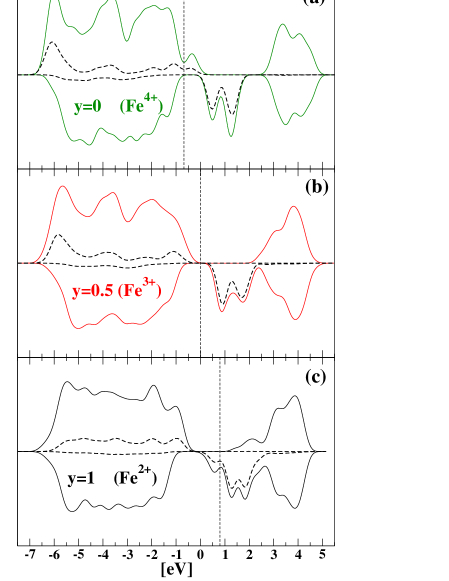
The main difference between and is the presence of the unfilled orbitals which, falling inside the energy gap of zirconia, determine the electronic properties of the doped system. The –orbitals occupation is also strongly affected by and is used here, together with the computed magnetic moment, to infer the oxidation state. At , acts as an acceptor (Fig. 3.(a)) with the creation of holes in the majority spin VB. These are preferentially located on the orbitals as shown by the projected–DOS with the projection of the hole states on the –orbitals close to 0.5. Thus is forced in the oxidation state with a magnetic moment per atom equal to 4 Bohr magnetons (). The creation of release the electrons captured by the anions. At the system turns into a charge–transfer semi–conductor (see Fig. 3.(b)), i.e. the do not create an impurity bands, as it would happen in , but compensate the holes in the orbitals. In this configuration atoms are in the oxidation state and the magnetic moment per iron atom is maximized, 5 . If exceeds 0.5, electrons start to fill the minority levels. This decreases the average magnetic moment, while the system reverts to an half–metal. At (Fig. 3.(c)) all iron atoms are in a oxidation state with the per atom magnetic moment equal to 4 . In Fig. 3 we also notice that at no extra state, other than the orbitals, appears between the valence and the conduction band of . Only when (Fig. 3.(c)) such a state exists. The latter can be associated to an impurity band which has been suggested to create bound magnetic polarons in case of magnetic doping Coey2005_Nature . However the configuration is not favored. Indeed the energy cost, for each extra created in the system, of the reaction
| (2) |
changes from , oxygen rich conditions, to , oxygen poor conditions, thus remaining positive for any value of the oxygen chemical potential. As for the formation energy , this value is weakly dependent on the atomic doping . Last but not least, even if in this case the impurity band exist, it is empty. Thus the possible existence of bound magnetic polaron in : is unlike. We will also show in the next section that, experimentally, iron in : is in the and not in the oxidation state.
We remark that, even if at and the system is metallic, the per atom magnetic moment is integer. The reason is that in both cases : is indeed an half–metal and thus electrons can move across the Fermi level only in one spin channel. We have verified this result increasing the sampling of the k–points grid from to in the 96 super–cell and from to in the 12 atoms super–cell. In both cases the system remains metallic, with fractional occupation in the majority () or minority () spin channel (a smearing of was used in the self–consisten cycle in this case), but with constant per atom magnetic moment . In principle the 96 atoms super–cell with a sampling is equivalent to the 12 atoms supercell with sampling . However the two could differ because in the 96 atoms super–cell, removing symmetries, disorder is taken into account. This could for example induce a localization of holes on the atoms. Thus the convergence check were also a rough way to explore possible Anderson–like localization mechanisms. However we did not observe such phenomena.
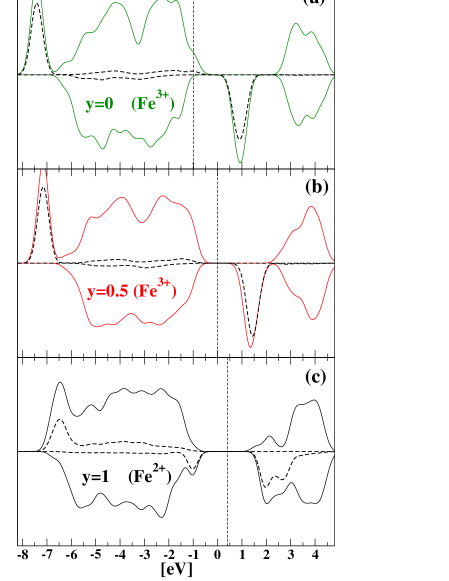
These are the prediction of the GGA. Howerver for TM oxides this approximation is known to suffer of some deficiencies. In particular it suffers of the well known problem of self–interaction, which tends to delocalize too much the orbitals. A common way to avoid this problem is to correct the DFT scheme with a Hubbard like term which enters as an external parameter. The value of is system dependent and should be optimized either with a direct comparison with experimental data or with a self–consistent approach. In the literature usually for elemental iron and in iron oxides. For example Cococcini et al. Cococcioni2005 report, after a self–consistent calculation, for metal iron and for . Here we begin choosing an intermediate value, , in order to evaluate the physical effects introduced by this correction.
In Fig. 4 we plot the DOS for the GGA+ approach at . We can directly compare the results with the GGA DOS plots in Fig. 3. As expected the correction pushed down the occupied level and a sharp structure appeared in the DOS just below the VB of :. Also the crystal field splitting of the spin minority orbitals, between the and the states, was reduced, and is not distinguishable anymore with the smearing parameter used in the plot; with the exception of the case . However in the charge–compensated situation, , these corrections do not alter the qualitative description of the system, which remains a magnetic semi–conductor with the magnetic moment per atom maximized. Instead, when we deviate from this configuration, we notice two important differences. For the holes created in the VB are less localized on the atoms. Indeed the projection of the hole states on the –levels drops from (GGA) to less than (GGA+). Thus iron is in the configuration, while the holes are in the VB, i.e. on the oxygen atoms. Accordingly the formation energy drops from (GGA) to because oxygen atoms are more weakly bound to the system. For the extra electrons start to fill the minority -levels, as in the GGA case. However the newly occupied levels are pushed down in energy and thus the system is not metallic but it displays an energy gap, i.e. GGA+ predicts a a Mott insulator in this case. Also for the case we verified that in the metallic case (i.e. at ) the value of the magnetic moment remains constant improving the sampling of the Brillouin zone.
The electronic properties in the present section were reported for . We did not find significant changes for the other doping concentrations, at least for . At the lowest computed doping concentration however, , the atoms are too far apart and the localized –levels do not create a band. Thus the metallic phases predicted within GGA () become semi–conducting phases with defects states localized close to the Fermi level.
III Experimental results
III.1 Structural characterization
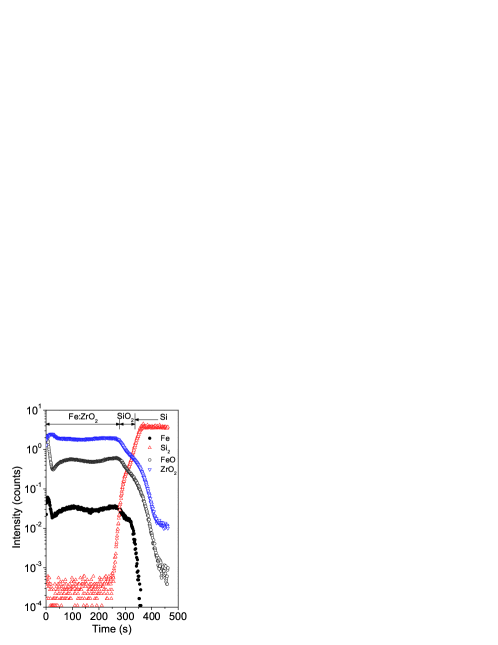
Experimentally, as a first step, we first studied the structural properties of the films growth by atomic layer deposition. In Fig. 5 the ToF–SIMS depth profile of a representative film (namely, : at ), including , , and negative secondary ion intensity profile is graphed. and are both used as representative of distribution along the film thickness; in particular ion fragment has not to be considered as a mark of chemical compound in the film, but as a fingerprint of embedded in the host matrix. The flatness of and related profiles indicates that the film grows uniformly during the ALD process, without changes in the distribution of the chemical species, evidencing that the growth process is well controlled. Further, Si diffusion in is excluded with a well distinct film/substrate interface, an indication that the substrate does not affect : properties both during the film growth and the thermal treatment. Furthermore, the profile is almost constant, thus it is the doping in the film, and the absence of large fluctuations such as peaked maxima, can exclude clustering. Indeed the latter would have been observed as a sudden increase of intensity with a concomitant abrupt decrease of intensity, indicating that an rich / poor environment is detected. Instead both and signals mimic the same profile shape, confirming that is uniformly diluted within the matrix.
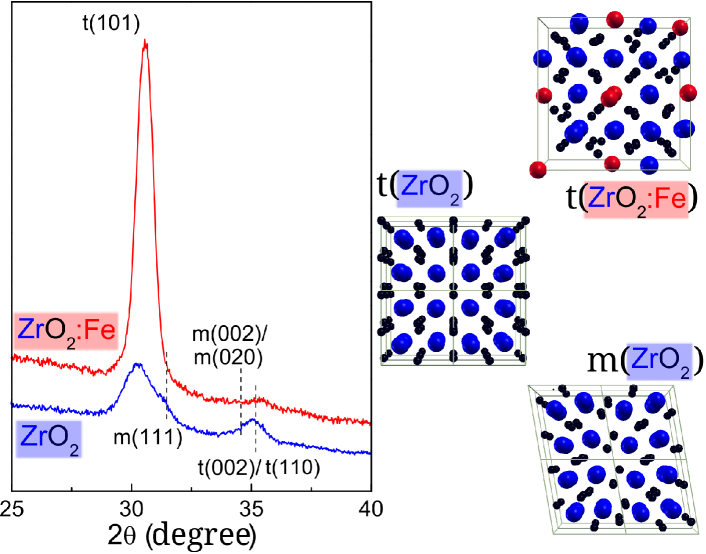
To get details on the film crystalline structure, in Fig. 6 we compare the XRD patterns of and :. Both films mainly present the cubic/tetragonal phase. Indeed in these films there is a balance between the bulk energy, where the monoclinic phase is favored, and the surface energy, where the tetragonal phase is favored. The critical grain size Christensen1998 ; Cerrato1997 below which the tetragonal phase become the most favored is . In our films, being the grain size close to the film thickness (from XRD data), we are close to this critical value. This can be evinced from the XRD patterns of pure where the peaks of the monoclinic phase are also evident. However in the : films the monoclinic phase is completely suppressed, confirming our theoretical findings. Even from these measures there is no indication of segregated iron phase or iron oxide clusters.
III.2 Electronic properties
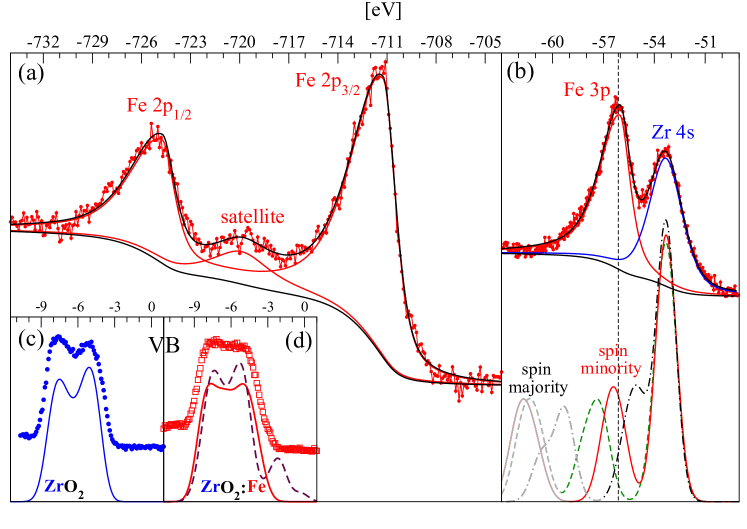
In Fig. 7 we report the high resolution spectra of the core level (a), the semi–core (b) levels and the VB (c-d). In Fig. 7.(a-b) the data were fitted with a doublet of asymmetric Voigt functions for the two main peaks plus a Voigt function for the satellite on top of a Shirley background and in Fig. 7.(b-d) the spectra are compared with DFT(GGA)–DOS computed as described in sec. I.1.
The change of the XPS–VB from (blue) to : (red) is in agreement with the DFT(GGA)–DOS obtained considering substitutional iron doping. In particular experimentally the double peak structure of pure is suppressed with doping. Theoretically this behavior is reproduced only assuming substitional doping.
Data for iron oxides from Ref. Yamashita2008,
| : | ||||
|---|---|---|---|---|
| -13.6 | -13.5 | -13.6 | -13.5 | |
| satellite | -7.8 | not pres. | -6.0 | -8.6 |
| 655.4 | not av. | 653.9 | 655.2 |
The core or semi–core levels of TM usually show a structured shape due to, at least, four factors: the spin–orbit (SO) splitting, the exchange splitting, the multiplet splitting and the screening to the core–hole. The SO term is responsible for the - splitting eV and is not sensitive to the chemical environment (see Fig. 7.(a)). The exchange and multiplet splitting instead give the characteristic asymmetric shape of the XPS peaks in metals. Finally the screening effect, which is strongly sensitive to the chemical environment Huang1995 ; Takahashi2010 ; See1995 , can create satellites. For the core level the distance between the satellite and the peak is a marker of the iron oxidation state Yamashita2008 . Also the position of the peak (Fig. 7.(b)) is sensitive to the chemical environment Yamashita2008 . The comparison with the values of Ref. Yamashita2008, , reported in Table 1, shows that iron is in the oxidation state.
According to our DFT results the oxidation state is strongly related to the presence of in the system (see Fig. 3). To better describe this point we study the semi–core levels with first principles simulations. Indeed the wave–functions are spatially localized close to the , which are in valence, and so are very sensitive to the chemical environment. The energy of the level is used as a reference to properly align the experimental XPS levels with the theoretical DOS.
In our approach the SO coupling term was included, both in the pseudo–potentials and in the hamiltonian, while the multiplet and the exchange splitting were accounted for by the exchange–correlation (xc) potential. For the level we found , while between the spin minority and the spin majority which is clearly visible in Fig. 7.(b). This is overestimated by DFT. In the case of semi–core levels Takahashi et al. Takahashi2010 showed that the screening effects, which are not included in the present approach, gives a broadening and a shift of the majority spin channel with, possibly, the creation of satellites. Indeed we can suppose that these effects would correct the overestimated , shifting the majority–spin energy level close to the minority one giving a single asymmetric peak with higher intensity as in the experimental case. However such an approach is beyond the scope of the present work. The minority–spin channel instead is less affected by screening effects retaining the independent–particle structure with the onset of the spectrum due to absorption from this channel Takahashi2010 . Thus we compared the energy position of the minority DOS with the measured XPS spectrum. In our simulations the distance of the minority peak from the level, , is strongly dependent on with , and . The value , i.e. the configuration with iron in the oxidation state, best agrees with the experimentally measured splitting , in agreement with the conclusion drawn from Table 1 and in general from sec. II.
In sec. II we showed that the electronic properties and in particular the shape of the valence band could be strongly influenced by the on–site electronic correlation, by the comparison of GGA and GGA+ predictions at .
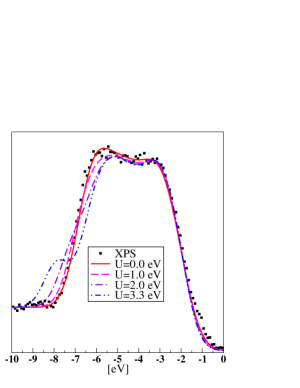
To decide which of the two scenarios, GGA or GGA+, better describes the experimental situation we compared the obtained DOS for the charge–compensated case with the measured photo–emission from the VB; the values are here considered. To mimic the experimental spectrum, we have superimposed to the DFT–DOS a Shirley like background, i.e. a background proportional to the integral of the DOS. Also, for a quantitative comparison, we computed the theoretical DOS for and , which is the theoretical value closest to the experimental measured doping.
In Fig. 8 we see that the structure which identifies the levels in the GGA+, at the reference value , is not present experimentally and the agreement between theory and experiment is much better in the standard GGA (i.e. ). At the intermediate values and such structure is not visible, however the agreement with the experimental results is worse than for the case. We can conclude that the value best agrees with the photo–emission VB, and that, given the experimental resolution, the optimal choice of must be between 0 and 1 . Thus in : the effect of the self–interaction of the orbitals, which is corrected by the Hubbard term, is smaller than in common iron oxides. This is an “a posteriori” justification of the results obtained, in the present work, within the GGA.
IV Conclusions
In conclusion we studied iron doped zirconia both theoretically, with first–principles simulations, and experimentally, with structural, chemical and electronic characterization of thin films grown by atomic layer deposition.
As expected from simple considerations, iron was found experimentally in the oxidation state. We also found that it induces a monoclinic to tetragonal phase transition. Theoretically the oxidation state was related to presence of oxygen vacancies which play a key role in the structural phase transition. The theoretical findings have been tested with a detailed comparison against photo–emission spectra of the samples grown by atomic layer deposition to validate the assumptions. These results are a confirmation that iron doped zirconia could be a good candidate in view of oxygen sensing applications as reported in the past.
Moreover the presence of vacancies is seen not only to influence the structure of the system but, theoretically, also to determine the density of states at the Fermi level and the eventual presence of impurity states in the gap which could be associated to magnetic polarons. In particular, we discussed how the ratio between oxygen vacancies and the iron atoms concentration shifts the Fermi level of the system. We found that in the most stable configuration, the iron atoms are charge–compensated by the presence of oxygen vacancies with a ration of 0.5, i.e. one vacancy each two iron atoms. The resulting system is a semi–conductor with no impurity state in the gap.
These results should be considered for a correct description of the behavior of iron doped zirconia, or more in general of high–k oxides doped with valence elements, in resistive switching devices. Moreover the absence of impurity states rules out the magnetic polaron model as a possible mechanism to explain the magnetic properties of the system.
Finally we have explored the importance of the Hubbard U correction. Indeed, theoretically, varying the value of U from to the electronic propertes of the system change significantly. We showed that in iron doped zirconia the value best agrees with the experimental data, thus indicating that the on site electronic correlation is low in this system.
Aknowledgments
This work was funded by the Cariplo Fundation through the OSEA project 2009-2552. D.S. and A.D. would like to acknowledge G. Onida and the ETSF Milan node for the opportunity of running simulations on the “etsfmi cluster”, P. Salvestrini for technical support on the cluster and A. Molle and S. Spiga for useful comments and discussions. We also acknowledge computational resources provided under the project MOSE by CASPUR.
References
- (1) H. Ohno, H. Munekata, T. Penney, S. Von Molnar, and L. L. Chang, Phys. Rev. Lett. 68, 2664 (1992)
- (2) H. Ohno, A. Shen, F. Matsukura, A. Oiwa, A. Endo, S. Katsumoto and Y. Iye, Appl. Phys. Lett. 69, 363 (1996)
- (3) J. M. D. Coey, M. Venkatesan, and C. B. Fitzgerald, Nature Materials 4, 173 (2005)
- (4) K. Sato, L. Bergqvist, J. Kudrnovsky, P. H. Dederichs, O. Eriksson, I. Turek, B. Sanyal, G. Bouzerar, H. Katayama-Yoshida, V. A. Dinh, T. Fukushima, H. Kizaki, R. Zeller, Rev. Mod. Phys, 82, 1633 (2010)
- (5) H. P. Gunnlaugsson, T. E. Mølholt, R. Mantovan, H. Masenda, D. Naidoo, W. B. Dlamini, R. Sielemann, K. Baruth-Ram, G. Weyer, K. Johnston, G. Langouche, S. Olafsson, H. P. Gislason, Y. Kobayashi, Y. Yoshida, M. Fanciulli, and ISOLDE Collaboration, Appl. Phys. Lett. 97, 142501 (2010)
- (6) N. H. Hong, N. Poirotet, and J. Sakai, Appl. Phys. Lett. 89, 042503 (2006)
- (7) N. H. Hong, C.-K. Park, A. T. Raghavender, O. Ciftja, N. S. Bingham, M. H. Phan, and H. Srikanth, J. Appl. Phys. 111, 07C302 (2012)
- (8) N. H. Hong, J. Sakai, N. Poirot, and A. Ruyter, Appl. Phys. Lett. 86, 242505 (2005)
- (9) J. M. D. Coey, M. Venkatesan, P. Stamenov, C. B. Fitzgerald, L. S. Dorneles, Phys. Rev. B 72, 024450 (2005)
- (10) V. V. Kriventsov, D. I. Kochubey, Y. V. Maximov, I. P. Suzdalev, M. V. Tsodikov, J. A. Navio, M. C. Hidalgo, G. Colón, Nuclear Instruments and Methods in Physics Research A 470, 341 (2001)
- (11) T. R. Sahoo, S. S. Manoharan, S. Kurian, and N. S. Gajhiye, Hyperfine Interaction 188, 43 (2009)
- (12) S. Ostanin, A. Ernst, L. M. Sandratskii, P. Bruno, M. Däne, I. D. Hughes, J. B. Staunton, W. Hergert, I. Mertig, and J. Kudrnovskỳ, Phys. Rev. Lett. 98, 016101 (2007)
- (13) T. Archer, C. D. Pemmaraju, and S. Sanvito, Journal of Magnetism and Magnetic Materials 316, e188-e190 (2007)
- (14) N. H. Hong, J. Sakai, N. T. Huong, N. Poirot, and A. Ruyter, Phys. Rev. B 72 045336 (2005)
- (15) G. Stefanic, B. Grzeta, S. Music, Mat. Chem. and Phys. 65, 216 (2000)
- (16) W. Cao, O. K. Tan, W. Zhu, B. Jiang, C. V. Gopal Reddy, Sensors and Actuators B 77, 421 (2001)
- (17) W. Cao, O. K. Tan, J. S. Pan, W. Zhu, C. V. Gopal Reddy, Mat. Chem. and Phys. 75, 67 (2002)
- (18) H. Zhang, B. Gao, B. Sun, G. Chen, L. Zeng, L. Liu, X. Liu, J. Lu, R. Han, J. Kang, and B. Yu Appl. Phys. Lett. 96, 123502 (2010)
- (19) S. Spiga, R. Rao, L. Lamagna, C. Wiemer, G. Congedo, A. Lamperti, A. Molle, M. Fanciulli, F. Palma, and F. Irrera J. Appl. Phys. 112, 014107 (2012)
- (20) G. Stapper, M. Bernasconi, N. Nicoloso, and M. Parrinello, Phys. Rev. B 59, 797 (1999)
- (21) P. Giannozzi, S. Baroni, N. Bonini, M. Calandra, R. Car, C. Cavazzoni, D. Ceresoli, G. L. Chiarotti, M. Cococcioni, I. Dabo, A. Dal Corso, S. Fabris, G. Fratesi, S. de Gironcoli, R. Gebauer, U. Gerstmann, C. Gougoussis, A. Kokalj, M. Lazzeri, L. Martin-Samos, N. Marzari, F. Mauri, R. Mazzarello, S. Paolini, A. Pasquarello, L. Paulatto, C. Sbraccia, S. Scandolo, G. Sclauzero, A. P. Seitsonen, A. Smogunov, P. Umari, R. M. Wentzcovitch, J. Phys.:Condens. Matter 21, 395502 (2009)
- (22) J. P. Perdew, K. Burke, and M. Ernzerhof, Phys. Rev. Lett. 77, 3865 (1996)
- (23) P. Hohenberg, and W. Kohn, Phys. Rev. 136, B864 (1964)
- (24) W. Kohn, and L. J. Sham, Phys. Rev. 140, A1133 (1965)
- (25) D. Vanderbilt, Phys. Rev. B 41, 7892R (1990)
- (26) A. M. Rappe, K. M. Rabe, E. Kaxiras, and J. D. Joannopoulos, Phys. Rev. B 41, 1227R (1990)
- (27) C. Hartwigsen, S. Goedecker, and J. Hutter, Phys. Rev. B 58, 3641 (1998)
- (28) X. Gonze, B. Amadon, P.-M. Anglade, J.-M. Beuken, F. Bottin, P. Boulanger, F. Bruneval, D. Caliste, R. Caracas, M. Côtè, T. Deutsch, L. Genovese, Ph. Ghosez, M. Giantomassi, S. Goedecker, D.R. Hamann, P. Hermet, F. Jollet, G. Jomard, S. Leroux, M. Mancini, S. Mazevet, M.J.T. Oliveira, G. Onida, Y. Pouillon, T. Rangel, G.-M. Rignanese, D. Sangalli, R. Shaltaf, M. Torrent, M.J. Verstraete, G. Zerah, J.W. Zwanziger, Comp. Phys. Comm. 180, 2582 (2009)
- (29) A. Lamperti, E. Cianci, R. Ciprian, D. Sangalli, and A. Debernardi, Thin solid films (2012), in press http://dx.doi.org/10.1016/j.tsf.2012.11.127
- (30) A. Lamperti, L. Lamagna, G. Congedo, and S. Spiga, J. Electrochem. Soc., 158, G211 (2011)
- (31) D. Sangalli, and A. Debernardi, Phys. Rev. B 84, 214113 (2011)
- (32) J. K. Dewhurst, and J. E. Lowther, Phys. Rev. B 57, 741 (1998)
- (33) R. J. Ackermann, E. G. Rauth, and C. A. Alexander, High. Temp. Sci. 7, 304 (1975)
- (34) A. Debernardi, C. Wiemer, M. Fanciulli, Materials Science in Semiconductor Processing 11, 241-244 (2008)
- (35) X. Lou, W. Zhou, S. V. Ushakov, A. Navrotsky, and A. A. Demkov, Phys. Rev. B 80, 134119 (2009)
- (36) A. Christensen, and E. A. Carter, Phys. Rev. B 58, 8050 (1998)
- (37) G. Cerrato, S. Bordiga, S. Barbera, and C. Morterra, Surf. Sci. 50, 377 (1997); Appl. Surf. Sci. 53, 115 (1997).
- (38) International Crystal Structure Database, FIZ Karlsruhe and NIST ed., Release 2010 Code #68589 (t-) and #89426 (m-)
- (39) A. Kokalj, Comp. Mater. Sci. 28, 155 (2003)
- (40) D.-J. Huang, D. M. Riffe, J. L. Erskine, Phys. Rev. B 51, 15170 (1995)
- (41) M. Takahashi, and J.-I. Igarashi, Phys. Rev. B 81, 035118 (2010)
- (42) A. K. See, and L. E. Klebanoff, Phys. Rev. B 51, 7901 (1995)
- (43) T. Yamashita, and P. Hayes, Appl. Surf. Science 254, 2441 (2008)
- (44) M. Cococcioni, and S. de Gironcoli, Phys. Rev. B 71, 035105 (2005)