Aluminum abundances of multiple stellar generations in the globular cluster NGC 1851††thanks: Based on observations collected at ESO telescopes under programme 188.B-3002
We study the distribution of aluminum abundances among red giants in the peculiar globular cluster NGC 1851. Aluminum abundances were derived from the strong doublet Al i 8772-8773 Å measured on intermediate resolution FLAMES spectra of 50 cluster stars acquired under the Gaia-ESO public survey. We coupled these abundances with previously derived abundance of O, Na, Mg to fully characterize the interplay of the NeNa and MgAl cycles of H-burning at high temperature in the early stellar generation in NGC 1851. The stars in our sample show well defined correlations between Al,Na and Si; Al is anticorrelated with O and Mg. The average value of the [Al/Fe] ratio steadily increases going from the first generation stars to the second generation populations with intermediate and extremely modified composition. We confirm on a larger database the results recently obtained by us (Carretta et al. 2011a): the pattern of abundances of proton-capture elements implies a moderate production of Al in NGC 1851. We find evidence of a statistically significant positive correlation between Al and Ba abundances in the more metal-rich component of red giants in NGC 1851.
Key Words.:
Stars: abundances – Stars: atmospheres – Stars: Population II – Galaxy: globular clusters – Galaxy: globular clusters: individual: NGC 18511 Introduction
The ubiquitous presence in galactic globular clusters (GCs) of multiple stellar populations is amply assessed from the wealth of recent, high quality data (see e.g. the reviews by Gratton et al. 2004, Martell 2011 and Gratton et al. 2012a). Spectroscopy, in particular (but in a few cases also the splitting of photometric sequences, see e.g. Piotto 2009 and Bragaglia 2010) does prove beyond all doubt that the stellar population in GCs is composed of at least two stellar generations, distinct in ages (with a slight age difference from a few million years up to a few 107 years, depending on the nature of polluters) and in particular in a chemical composition even hugely different between each other, although these two generations may not be often seen as discrete groups in the abundance planes and/or in the colour-magnitude diagram.
This chemical signature must be necessarily attributed to the action of the more massive stars of an early, first generation since only this kind of stars could be responsible for the present pattern of Na-O and Mg-Al anticorrelations observed in present day unevolved cluster stars (Gratton et al. 2001), through the nuclear processing of H burning at high temperature (Denisenkov & Denisenkova 1989, Langer et al. 1993).
Most evidence concerning multiple stellar populations, and the recently found links with global cluster parameters (like total mass, Carretta et al. 2010, or horizontal branch morphology, Gratton et al. 2010) mainly stems from the Na-O anticorrelation, extensively studied thanks to modern facilities such as FLAMES@VLT (e.g. Carretta et al. 2009a,b). This feature was soon realized to be related to the intrinsic mechanism of formation of GC (Carretta 2006) and it is so widespread among GCs that can be considered as the simplest working definition of bona fide globular cluster (Carretta et al. 2010)111The Na-O anticorrelation is found in almost all GCs were Na, O abundances are derived for a large number of stars, although some claims - based on theoretical arguments - of single-generation clusters was made by e.g. D’Antona & Caloi (2008). As an example they suggest that NGC 6397 was composed only by second generation stars. However, both Carretta et al. (2010, using mainly Na) and Lind et al. (2011, with both Na and O) were able to show the presence of two stellar generations also in this globular cluster..
However, since the study by Gratton et al. (2001), it was immediately clear the importance of collecting the widest range of elements produced in proton-capture reactions. In particular, the “heaviest” light elements involved, such as Mg, Al and Si allow us to explore the hottest regime and cycles of the H burning. This is crucial in order to shed light on the still uncertain nature of the candidate polluters of the first stellar generation whose identification appears still problematic and debated, with favourite candidates being fast rotating massive stars (FRMA: Decressin et al. 2007) or intermediate mass asymptotic giant branch (AGB) stars (Ventura et al. 2001)222In a few cases, like M 22 (Marino et al. 2009) and NGC 1851 (Carretta et al. 2011a), also a contribution by type II SNe to the cluster pollution must be taken into account..
To this aim we started to add Al abundances to the very large dataset with O, Na, Mg, Si abundances already in hand, by re-observing large sample of stars of our FLAMES survey of GCs. Proprietary data are being analyzed for a few key objects (see the results on NGC 6752, Carretta et al. 2012). In the present note we exploit the observations made in NGC 1851 by the Gaia-ESO spectroscopic public survey, just started on FLAMES@VLT.
2 Observations
We retrieved from the ESO archive two exposures, of 600 sec each made with FLAMES mounted at VLT-UT2 and the high resolution grating HR21. The observations were carried out on UT 17 February 2012, with airmass z=1.115 and 1.155, respectively. The resolution of HR21 is 17,300 and the spectral range is from 8484 Å to 9001 Å, including the Al i doublet at 8772-73 Å, which is the feature that we use.
Data reduction was performed through the ESO FLAMES-Giraffe pipeline (version 2.8.9, http://www.eso.org/sci/software/pipelines//giraffe/giraf-pipe-recipes.html), which provides bias-corrected, flat-fielded, 1D-extracted and wavelength-calibrated spectra. Sky subtraction, combination of the two single exposures for each star, and rest-frame traslation were then carried out within IRAF333IRAF is the Image Reduction and Analysis Facility, a general purpose software system for the reduction and analysis of astronomical data. IRAF is written and supported by the IRAF programming group at the National Optical Astronomy Observatories (NOAO) in Tucson, Arizona. NOAO is operated by the Association of Universities for Research in Astronomy (AURA), Inc. under cooperative agreement with the National Science Foundation..
A total of 84 stars were observed in the two exposures, however we restricted our attention to the sub-sample of 63 stars in common with the database by Carretta et al. (2011a). For these stars we already have a full abundance analysis, with homogeneously determined atmospheric parameters, and abundances of light elements O, Na, Mg, Si. The spectral range of HR21 contains no useful Fe lines, hence we restricted the present analysis to this subsample. It was not possible to measure reliable Al abundances for 13 stars that are too hot (effective temperature higher than about 4900 K) or with low-quality spectra. Hence the final sample with a complete set of light-element abundances is represented by 50 red giant branch (RGB) stars, in a range of two magnitudes (from to ) approximatively centred at the luminosity of the bump on the RGB (, see Fig. 1). Relevant information on this final sample are listed in Table 1.
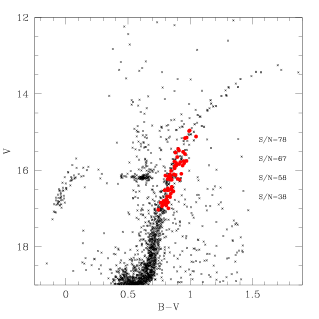
The cluster was observed as calibrator for the survey, so the desired S/N was set to the average one for survey stars, and not optimized to get a S/N ratio good also for the much weaker Al lines. The S/N ratios at 8800 Å, as measured on the combined spectra, range from 12 to 147 for the used sample, with a median value of 57. The average values of the S/N in 0.5 mag bins are shown in Fig. 1, whereas individual values for each star are listed in Table 1.
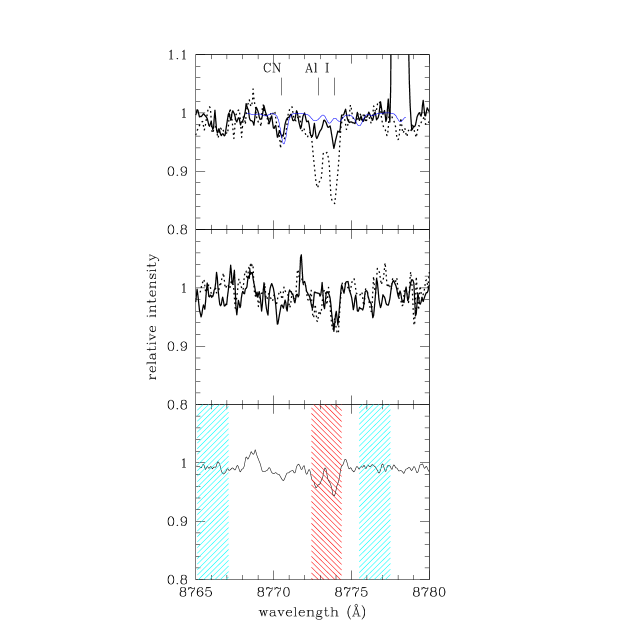
In Fig. 2 (upper panel) we compare the spectra of two stars with very similar atmospheric parameters (effective temperature , surface gravity , overal metal abundance [Fe/H], and microturbulent velocity ): star 44939 (4425/1.60/-1.15/1.01) and star 35999 (4442/1.64/-1.15/0.81), with S/N ratios of 147 and 49, respectively. These are the coolest giants in our sample. We also superimpose the synthetic spectrum computed with the atmospheric parameters appropriate for star 35999 and no Al ([Al/Fe]=-9.99), to show the amount of possible contamination of Al lines by CN features (blue thin solid line). Another example is shown in the middle panel of Fig. 2, where we compare a pair of RGB stars with similar parameters (star 22360: 4755/2.27/-1.15/0.86 and star 31520: 4756/2.28/-1.23/1.26) and S/N ratios close to the median value for the sample (S/N=60 and 61 for stars 22360 and 31520, respectively).
3 Analysis
Owing to the quality of spectra and to the weakness of Al i lines in rather warm giants we decided to derive the abundances from the comparison of the observed flux in the region of Al lines with the flux measured on synthetic spectra computed using the package ROSA (Gratton 1988), with the following procedure.
First, to account for the contamination of CN lines444Other contaminants, like TiO molecular lines, are not important. present over the spectral range where Al lines lie, we first reproduced a CN feature at Å, adopting a fixed C abundance (0.0 dex) and varying the [N/Fe] ratio until the CN line was reasonably well fitted. The resulting values of [N/Fe] are listed in Table 1. The C content adopted in this process is very likely much higher than the actual one, which for metal-poor giants in this evolutionary stage is expected to be about -0.6 dex. However, the meaning of [N/Fe] ratios is only indicative, since we lack precise abundances of C, so that these N abundances only indicate the value that reproduce the CN feature adequately.
Our line list, originally from B. Plez, was slightly modified by optimizing the position and strength of CN and Al lines to fit the high resolution spectrum of the cool and metal-rich (CN rich) giant Leo (see Gratton et al. 2006).
Second, we coadded the observed spectra of the 10 stars with the highest S/N in our sample. On this spectrum we selected a region including the two Al lines and two other regions to be used to derive a local reference continuum. These regions are shown as shaded red and light blue areas in Fig. 2. We then measured the average fluxes within the in-line region () and the reference continuum regions ( and ). We also estimated photometric errors in these regions from the S/N of the spectra and width (and then number of pixels) within each of these regions. Finally, we defined a line strength index for the Al lines as , with an error which is obtained by a suitable combination of the photometric errors. The same procedure was then repeated on a set of three synthetic spectra computed for each star using the appropriate atmospheric parameters (from Carretta et al. 2011a) and abundances of [Al/Fe]=-0.5, 0.0, 0.5. Abundances of Al for each stars were then derived by interpolating the normalized flux in the line region among those obtained from the synthetic spectra. An error can be attached by comparing these Al abundances with those obtained entering a new value of the Al line strength index that is the sum of the original value and of its error. Whenever the measured value for the Al line strength index was smaller than twice the error, we considered that only an upper limit to Al abundances could be obtained. In this case, we assumed that the upper limit to Al abundances be equal to three times the error: this is a rather robust estimate of upper limit. This procedure avoids any subjective judgement, as suggested by the referee, and was applied to all the observed spectra with a : for lower spectra we only obtained high upper limits that do not bear important information.
We notice that typical errors associated to the Al abundances obtained following this approach are in the range 0.1-0.4 dex. Star-to-star errors in the adopted atmospheric parameters are quite small (see Carretta et al. 2011a) and less a source of concern. As discussed in Carretta et al. (2012), NLTE effects are not a source of concern in the star-to-star analysis in NGC 6752; this is even more true when considering more metal-rich stars, as in the present case.
4 Results and discussion
The derived abundances of Al for our sample are listed in Table 1. We obtained [Al/Fe] ratios for 60 stars, with 49 detection and 11 upper limits. Other abundances (for Fe, O, Na, Mg, Si) were taken from the analysis of Carretta et al. (2011a) and repeated for convenience in this Table. As mentioned in the Introduction, they are available for 50 stars.
Al abundances do not present any significant trend as a function of effective temperature or metallicity [Fe/H]. The expected correlations of Al with elements enhanced by proton-capture reactions (Na, Si) and the anticorrelations with those depleted in H-burning at high temperature (O, Mg) are illustrated in Fig. 3.
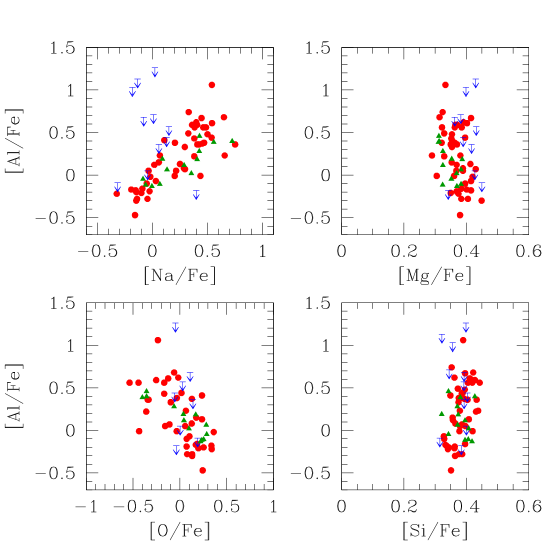
As a comparison - and an useful check - we add to these relations also the abundances for 13 RGB stars with high resolution UVES spectra, with [Al/Fe] ratios obtained from the classical Al i doublet at 6696-98 Å in Carretta et al. (2011a). Despite none of these 13 giants is in common with the stars in the present sample, the nice agreement we can see in Fig. 3 supports our abundance determination from medium-resolution GIRAFFE spectra.
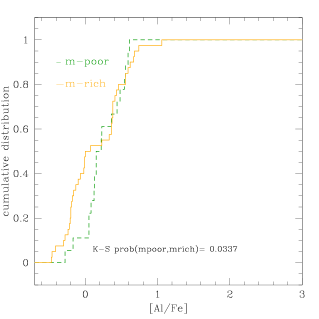
Using a statistical cluster analysis, in Carretta et al. (2012a) we separated within NGC 1851 two stellar components, one more metal-rich/Ba-rich and the other more metal- and Ba-poor, with evidence of a slightly more extreme processing among stars of the second generation of the metal-rich component. In Fig. 4 we show the cumulative distribution of Al abundance for stars in our present sample divided into the two components: a statistical Kolmogorov-Smirnov test on the cumulative distributions show evidence that the two distributions are actually different, concerning their Al abundance, although in this case the metal-rich component seems to be more Al-poor.
The range of [Al/Fe] ratios among giants of NGC 1851 is intermediate between the small range observed in GCs like M 4 (e.g. Marino et al. 2008, Carretta et al. 2009b) and the rather large range observed in massive GCs like NGC 2808 (Carretta et al. 2009b, Bragaglia et al. 2010).
On the other hand, Al-Si correlation observed in our GIRAFFE sample (lower right panel in Fig. 3) is found to be statistically significant at a confidence level higher than 97.5% (Pearson’s correlation coefficient , 57 degree of freedom). This correlation demonstrates that part of the material polluting the gas used in the formation of second generation stars was processed under temperatures higher than about 65 MK. Indeed, this is the threshold value above which the reaction 27Al(,)28Si dominates on the 27Al(,)24Mg reaction (see Arnould et al. 1999) and a certain amount of 28Si is produced as a leakage from Mg-Al cycle (Karakas and Lattanzio 2003). The correlation between Al and Si (or the corresponding Mg-Si anticorrelation) is now observed in a number of GCs (see Yong et al. 2005 and Carretta et al. 2009b, 2011a) and confirmed to exist also in NGC 1851 by the present large sample.
Finally, we found that the average abundance of Al steadily increases as the chemical composition changes from the pattern typical of first generation stars to that of second generation stars with increasingly modified composition. By dividing our sample into the three components P, I, and E defined in Carretta et al. (2009a) we find the following average values: [Al/Fe] dex (, 17 stars) for the primordial P component, and [Al/Fe] dex (, 26 stars), and [Al/Fe] dex (, 2 stars) for the I and E components, respectively, of second generation stars in NGC 1851555Twelve stars lack O abundances, therefore cannot be classified as P, I or E stars as in Carretta et al. (2009a).
Looking at the relation between proton-capture and neutron-capture elements is of particular interest in this cluster. First, Yong and Grundahl (2008) found a correlation of Zr and La with Al in a few bright giants in NGC 1851. Carretta et al. (2011a) confirmed this correlation using a large sample of more than 120 giants; Gratton et al. (2012b) found a close correlation between Na and Ba among RHB stars; and finally Gratton et al. (2012c) found (i) a clearly different Sr and Ba abundances between the faint (larger abundances) and bright subgiant branches (SGBs) found by Milone et al. (2008), and (ii) that a spread exists within both sequences.
In Fig. 5 we display the ratio [Al/Fe] as a function of [Ba/Fe] from Carretta et al. (2011a) for stars in the present sample, separating the metal-poor (green triangles) and metal-rich (orange squares) components.
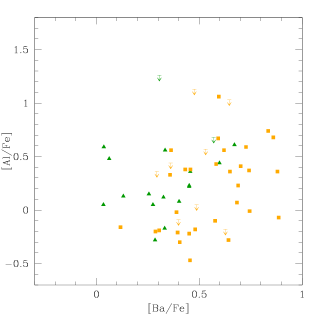
Overall, no correlation is apparent between Al and Ba; however, when considering separately the two components, there seems to be a correlation among the metal-rich component: the Pearson linear correlation coefficient is 0.29 for a sample of 36 objects, which is significant to a level of confidence higher than 95%. This finding is supported by other evidence, since both Al (this paper) and Ba (Yong and Grundahl 2008; Carretta et al. 2011a) are found to be correlated with Na.
Another confirmation comes from the relation of Al abundances with Strömgren photometry. This set of filters was recently found to be very sensitive to the abundance of light elements such as C and N (see Carretta et al. 2011a,b and Sbordone et al. 2011), hence quite useful when coupled with abundances of light elements to explain segregations or splitting observed in photometric sequences in particular clusters like NGC 1851.
In Fig. 6 we plot the CMD where the upper RGB in NGC 1851 appears well separated. On this CMD stars of our sample are separated according to the Al abundances: red open symbols and blue filled symbols indicate respectively giants with [Al/Fe] higher or lower than the average value of the sample, 0.24 dex. Almost all stars with low Al content (except for three cases) define an extremely narrow stripe on the bluest envelope of the branch, whereas the high-Al stars are more spread out to the red, and the well separated reddest sequence contains almost only high Al objects, except for the three interlopers with low Al.
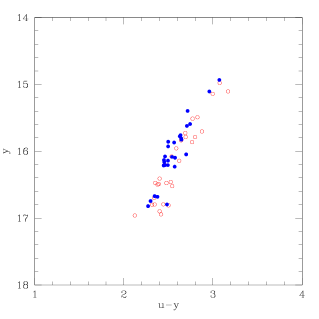
In Carretta et al. (2011a,b) we also showed that this red sequence is preferentially populated by giants with high Ba abundances and that the separation from the bluest sequence is mostly caused by a relevant excess in N.
Taking all these results into account, although this is not a 1 to 1 correlation, the trend of Al-rich stars to occupy preferentially the redder sequence suggests that, at least for the upper RGB, the Strömgren colours do measure N and are not strictly correlated with the progeny of SGB stars, in agreement with what found in Carretta et al. (2011a) using mainly O and Na abundances. In turn, we caution that any identification of the progeny of SGB stars only based on colour (see e.g. Han et al. 2009) must be regarded with caution, because there is no a one-to-one correlation, hence may be misguiding.
Together with results on SGB stars by Gratton et al. (2012c) we can conclude that stars on the faint SGB are predominantly - but non only - N-rich (hence they occupy a redder position on the RGB, in Strömgren colours), while the stars on the bright SGB are about 1/3 N-rich and 2/3 N-poor (hence they are mostly blue in the Strömgren colours).
In summary, the Al abundances we obtained from spectra acquired as calibration within the Gaia-ESO public survey add another constraint to the complex scenario of the star formation in NGC 1851: both the putative populations hosted in this cluster have not only a spread in Na, but also an Al spread, and the two are quite similar in both populations.
Acknowledgements.
This work was partially funded by the PRIN INAF 2009 grant CRA 1.06.12.10 (“Formation and early evolution of massive star clusters”, PI. R. Gratton), and by the PRIN INAF 2011 grant “Multiple populations in globular clusters: their role in the Galaxy assembly” (PI E. Carretta). We thank Šarūnas Mikolaitis for sharing with us the line list for CN provided by B. Plez. We also thank the referee for her/his constructive suggestions and for asking for a less subjective method, since this resulted in better constrained and accurate abundances. This research has made use of the SIMBAD database (in particular Vizier), operated at CDS, Strasbourg, France and of NASA’s Astrophysical Data System.References
- (1) Arnould, M., Goriely, S., Jorissen, A. 1999, A&A, 347, 572
- (2) Bragaglia, A. 2010, IAUS, 268, 119
- (3) Bragaglia, A., Carretta, E., Gratton, R.G. et al. 2010, ApJ, 720, L41
- (4) Carretta, E. 2006, AJ, 131, 1766
- (5) Carretta, E., Bragaglia, A., Gratton, R.G. et al. 2009a, A&A, 505, 117
- (6) Carretta, E., Bragaglia, A., Gratton, R.G., & Lucatello, S. 2009b, A&A, 505, 139 (Paper VIII)
- (7) Carretta, E., Bragaglia, A., Gratton, R.G., Recio-Blanco, A., Lucatello, S., D’Orazi, V., & Cassisi, S. 2010, A&A, 516, 55
- (8) Carretta, E., Lucatello, S., Gratton, R.G., Bragaglia, A., D’Orazi, V. 2011a, A&A, 533, 69
- (9) Carretta, E., Bragaglia, A., Gratton, R.G., D’Orazi, V., Lucatello, S. 2011b, A&A, 535, 121
- (10) Carretta, E., Bragaglia, A., Gratton, R.G., Lucatello, S., D’Orazi, V. 2012, ApJL, in press
- (11) D’Antona, F., Caloi, V. 2008, MNRAS, 360, 693
- (12) Decressin, T., Meynet, G., Charbonnel C. Prantzos, N.,& Ekstrom, S. 2007, A&A, 464, 1029
- (13) Denisenkov, P.A.,& Denisenkova, S.N. 1989, A.Tsir., 1538, 11
- (14) Gratton, R.G. 1988, Rome Obs. Preprint Ser., 29
- (15) Gratton, R.G., Bonifacio, P., Bragaglia, A. et al. 2001, A&A, 369, 87
- (16) Gratton, R.G., Bragaglia, A., Carretta, E., Tosi, M. 2006, ApJ, 642, 462
- (17) Gratton, R.G., Carretta, E. & Bragaglia, A. 2012a, A&A Rev., arXiv:1201.6526
- (18) Gratton, R.G., Carretta, E., Bragaglia, A., Lucatello, S., D’Orazi, V. 2010, A&A, 517, 81
- (19) Gratton, R.G., Lucatello, S., Carretta, E., et al. 2012b. A&A, 539, 19
- (20) Gratton, R.G., Sneden, C., & Carretta, E. 2004, ARA&A, 42, 385
- (21) Gratton, R.G., Villanova, S., Lucatello et al. 2012c, A&A, submitted
- (22) Han, S.-I., Lee, Y.-W., Joo, S.-J. et al. 2009, ApJ, 707, L190
- (23) Karakas, A.I., Lattanzio, J..C. 2003, PASA, 20, 279
- (24) Langer, G.E., Hoffman, R., & Sneden, C. 1993, PASP, 105, 301
- (25) Lind, K., Charbonnel, C., Decressin, T., Primas, F., Grundahl, F., Asplund, M. 2011, A&A, 528, 103
- (26) Marino, A.F., Villanova, S., Piotto, G., Milone, A.P., Momany, Y., Bedin, L.R., Medling, A.M. 2008, A&A, 490, 625
- (27) Marino, A.F., Milone, A., Piotto, G., Villanova, S., Bedin, L., Bellini, A., Renzini, A. 2009, A&A, 505, 1099
- (28) Martell, S.L., 2011, AN, 332, 467
- (29) Milone, A.P., Bedin, L., Piotto, G. et al. 2008, ApJ, 673, 241
- (30) Piotto, G. 2009, in The Ages of Stars, IAU Symp. 258, p. 233
- (31) Sbordone, L., Salaris, M., Weiss, A., Cassisi, S. 2011, A&A, 534, 9
- (32) Ventura, P. D’Antona, F., Mazzitelli, I., & Gratton, R. 2001, ApJ, 550, L65
- (33) Yong, D., Grundahl, F. 2008, ApJ, 672, L29
- (34) Yong, D., Grundahl, F., Nissen, P.E., Jensen, H.R., Lambert, D.L. 2005, A&A, 438, 875
| obj1 | star2 | S/N3 | [Al/Fe]3 | err | lim3 | [N/Fe]3 | [Fe/H]2 | [O/Fe]2 | [Na/Fe]2 | [Mg/Fe]2 | [Si/Fe]2 | ||
|---|---|---|---|---|---|---|---|---|---|---|---|---|---|
| 541 | 13618 | 35 | -0.01 | 0.46 | 1 | -0.05 | 16.392 | 15.482 | -1.120 | -0.435 | 0.437 | 0.305 | 0.420 |
| 1461 | 14827 | 32 | 0.74 | 0.36 | 1 | 17.819 | 16.994 | -1.164 | 0.330 | 0.324 | 0.353 | ||
| 974 | 16120 | 98 | 0.41 | 0.09 | 1 | 0.10 | 16.859 | 16.012 | -1.103 | 0.236 | 0.109 | 0.354 | 0.349 |
| 1218 | 20189 | 34 | 0.44 | 0 | 0.70 | 17.339 | 16.521 | -1.155 | -0.055 | 0.129 | 0.390 | 0.403 | |
| 1186 | 20426 | 38 | 0.36 | 0 | 0.30 | 17.281 | 16.429 | -1.106 | 0.139 | 0.060 | 0.417 | 0.393 | |
| 1044 | 20653 | 35 | 0.08 | 0.28 | 1 | 0.55 | 17.002 | 16.120 | -1.184 | 0.127 | 0.287 | 0.389 | 0.365 |
| 733 | 20922 | 41 | 0.05 | 0 | 0.10 | 16.705 | 15.784 | -1.142 | 0.004 | -0.043 | 0.427 | 0.400 | |
| 766 | 21453 | 60 | 0.05 | 0.15 | 1 | 0.25 | 16.746 | 15.835 | -1.156 | -0.157 | 0.216 | 0.368 | 0.380 |
| 1211 | 21830 | 45 | 0.38 | 0.22 | 1 | 0.50 | 17.344 | 16.515 | -1.163 | -0.033 | 0.470 | 0.363 | 0.388 |
| 1103 | 22360 | 60 | -0.09 | 0 | 0.10 | 17.123 | 16.223 | -1.145 | 0.191 | -0.315 | 0.450 | 0.315 | |
| 788 | 22588 | 80 | -0.28 | 0.23 | 1 | 0.10 | 16.762 | 15.878 | -1.200 | 0.078 | -0.139 | 0.405 | 0.377 |
| 891 | 22813 | 120 | -0.30 | 0.13 | 1 | 0.20 | 16.820 | 15.945 | -1.101 | 0.131 | -0.146 | 0.449 | 0.364 |
| 719 | 23647 | 57 | 0.22 | 0.16 | 1 | 0.00 | 16.693 | 15.806 | -1.193 | -0.359 | 0.381 | 0.329 | 0.431 |
| 810 | 23765 | 61 | 0.36 | 0.14 | 1 | 0.05 | 16.765 | 15.814 | -1.145 | -0.344 | 0.409 | 0.370 | 0.403 |
| 1016 | 25037 | 63 | -0.28 | 0.29 | 1 | 0.30 | 16.975 | 16.106 | -1.151 | 0.131 | -0.044 | 0.384 | 0.387 |
| 1202 | 25799 | 38 | 0.68 | 0 | 17.344 | 16.493 | -1.214 | 0.109 | -0.078 | 0.363 | 0.393 | ||
| 1190 | 26532 | 41 | 0.68 | 0.24 | 1 | 17.293 | 16.472 | -1.180 | -0.061 | 0.650 | 0.314 | 0.422 | |
| 1045 | 26552 | 57 | -0.18 | 0 | 0.10 | 17.019 | 16.090 | -1.114 | -0.038 | 0.399 | 0.342 | 0.384 | |
| 1291 | 26880 | 57 | -0.18 | 0.33 | 1 | 0.30 | 17.537 | 16.699 | -1.161 | 0.337 | -0.151 | 0.415 | 0.336 |
| 1274 | 27491 | 43 | -0.01 | 0.48 | 1 | 0.40 | 17.499 | 16.685 | -1.177 | -0.034 | 0.203 | 0.361 | 0.378 |
| 1070 | 28116 | 32 | 0.71 | 0 | 0.40 | 17.040 | 16.200 | -1.189 | 0.010 | 0.382 | 0.345 | ||
| 418 | 29203 | 57 | 0.56 | 0.14 | 1 | 0.10 | 16.162 | 15.115 | -1.157 | -0.442 | 0.487 | 0.363 | 0.443 |
| 1232 | 29470 | 41 | 0.59 | 0.25 | 1 | 0.40 | 17.413 | 16.548 | -1.144 | 0.361 | 0.371 | 0.428 | |
| 1024 | 30286 | 28 | 0.57 | 0 | 0.20 | 16.985 | 16.115 | -1.072 | 0.031 | 0.151 | 0.432 | 0.392 | |
| 802 | 31284 | 75 | 0.05 | 0.12 | 1 | 0.00 | 16.767 | 15.893 | -1.179 | 0.057 | -0.034 | 0.389 | 0.397 |
| 1307 | 31399 | 48 | -0.02 | 0.38 | 1 | 17.569 | 16.761 | -1.158 | 0.362 | -0.018 | 0.420 | ||
| 1410 | 31463 | 30 | 1.13 | 0 | 17.774 | 17.031 | -1.163 | -0.134 | 0.430 | 0.322 | |||
| 1046 | 31520 | 61 | 0.44 | 0.16 | 1 | 0.00 | 16.998 | 16.158 | -1.230 | 0.017 | 0.539 | 0.396 | 0.388 |
| 553 | 32112 | 43 | 0.43 | 0.21 | 1 | 0.30 | 16.460 | 15.517 | -1.077 | -0.167 | 0.381 | 0.352 | 0.385 |
| 1012 | 32256 | 44 | -0.10 | 0.38 | 1 | 16.947 | 16.109 | -1.168 | 0.073 | -0.051 | 0.396 | 0.329 | |
| 875 | 35750 | 66 | 0.36 | 0.13 | 1 | 0.20 | 16.813 | 15.874 | -1.185 | -0.334 | 0.423 | 0.356 | 0.404 |
| 347 | 35999 | 49 | 1.06 | 0.18 | 1 | 0.00 | 15.962 | 14.971 | -1.147 | -0.235 | 0.541 | 0.333 | 0.390 |
| 1395 | 36292 | 27 | 0.37 | 0.33 | 1 | 17.724 | 16.917 | -1.101 | 0.128 | 0.454 | 0.365 | 0.394 | |
| 757 | 38484 | 29 | 0.61 | 0.30 | 1 | 16.727 | 15.837 | -1.198 | -0.125 | 0.542 | 0.402 | 0.411 | |
| 1324 | 38818 | 40 | 0.23 | 0.24 | 1 | 0.00 | 17.618 | 16.804 | -1.144 | 0.657 | 0.290 | 0.438 | |
| 801 | 39364 | 54 | 0.33 | 0.16 | 1 | 0.20 | 16.765 | 15.877 | -1.128 | -0.098 | 0.295 | 0.354 | 0.375 |
| 539 | 40300 | 124 | 0.49 | 0.07 | 1 | -0.10 | 16.414 | 15.533 | -1.192 | 0.327 | 0.329 | 0.373 | |
| 409 | 40615 | 72 | 0.59 | 0.12 | 1 | -0.20 | 16.114 | 15.156 | -1.231 | -0.253 | 0.407 | 0.365 | 0.419 |
| 692 | 41113 | 68 | 0.56 | 0.14 | 1 | 0.20 | 16.642 | 15.769 | -1.219 | -0.537 | 0.463 | 0.322 | 0.419 |
| 1323 | 41855 | 35 | 0.48 | 0.30 | 1 | 17.610 | 16.847 | -1.202 | 0.501 | 0.354 | 0.395 | ||
| 1339 | 43528 | 41 | -0.22 | 0.45 | 1 | 0.40 | 17.624 | 16.854 | -1.067 | 0.340 | -0.323 | 0.375 | 0.341 |
| 1351 | 44224 | 38 | 0.36 | 0.27 | 1 | 17.660 | 16.839 | -1.205 | 0.752 | 0.350 | 0.433 | ||
| 616 | 44414 | 56 | 0.23 | 0.18 | 1 | 0.10 | 16.549 | 15.653 | -1.187 | 0.064 | 0.069 | 0.381 | 0.379 |
| 346 | 44939 | 147 | -0.19 | 0.10 | 1 | -0.20 | 15.952 | 14.956 | -1.151 | 0.072 | -0.025 | 0.369 | 0.363 |
| 1119 | 45006 | 63 | -0.07 | 0.28 | 1 | 0.00 | 17.096 | 16.245 | -1.115 | 0.103 | 0.032 | 0.415 | 0.328 |
| 1080 | 45090 | 59 | 0.15 | 0.16 | 1 | 17.047 | 16.228 | -1.185 | 0.175 | 0.059 | 0.353 | 0.356 | |
| 1050 | 45413 | 88 | -0.47 | 0.21 | 1 | 0.30 | 16.981 | 16.155 | -1.125 | 0.244 | -0.157 | 0.380 | 0.351 |
| 1093 | 46228 | 73 | -0.21 | 0.21 | 1 | 17.075 | 16.238 | -1.097 | 0.198 | -0.099 | 0.350 | 0.362 | |
| 1203 | 46657 | 30 | 1.26 | 0 | 17.316 | 16.521 | -1.246 | -0.047 | 0.023 | 0.399 | |||
| 1074 | 46958 | 93 | -0.20 | 0.20 | 1 | 0.25 | 17.048 | 16.204 | -1.142 | 0.254 | -0.145 | 0.371 | 0.344 |
| 507 | 47385 | 66 | -0.17 | 0.27 | 1 | 0.00 | 16.341 | 15.437 | -1.203 | 0.171 | -0.191 | 0.401 | 0.333 |
| 746 | 47795 | 38 | 0.56 | 0.23 | 1 | 0.40 | 16.723 | 15.753 | -1.127 | -0.167 | 0.384 | 0.385 | 0.405 |
| 407 | 48085 | 119 | -0.16 | 0.11 | 1 | -0.20 | 16.115 | 15.144 | -1.111 | 0.183 | -0.090 | 0.384 | 0.396 |
| 1350 | 48277 | 26 | 1.03 | 0 | 17.659 | 16.863 | -1.068 | -0.181 | 0.399 | 0.356 | |||
| 1007 | 48388 | 58 | 0.12 | 0.16 | 1 | 0.00 | 16.937 | 16.136 | -1.163 | 0.018 | 0.369 | 0.357 | |
| 1144 | 49965 | 45 | 0.62 | 0.20 | 1 | 0.30 | 17.156 | 16.242 | -1.095 | -0.017 | 0.399 | 0.391 | 0.362 |
| 1280 | 50876 | 37 | 0.38 | 0.23 | 1 | 0.30 | 17.512 | 16.680 | -1.097 | 0.205 | 0.321 | 0.376 | |
| 588 | 50973 | 64 | 0.07 | 0.14 | 1 | -0.20 | 16.530 | 15.572 | -1.084 | -0.111 | 0.296 | 0.430 | 0.386 |
| 738 | 51311 | 62 | 0.13 | 0.16 | 1 | 0.30 | 16.706 | 15.758 | -1.256 | 0.236 | 0.251 | 0.413 | 0.408 |
| 1319 | 52579 | 33 | 0.67 | 0.28 | 1 | 17.587 | 16.801 | -1.151 | 0.447 | 0.415 | 0.396 |
-
1-
object identification, from FLAMES mask in the ESO archive
-
2-
star identification, magnitudes and abundance ratios taken from Carretta et al. (2011)
-
3-
S/N ratios and abundances derived in the present work. lim is 0 for upper limits in the Al abundance.