The Effects of Close Companions (and Rotation) on the Magnetic Activity of M Dwarfs
Abstract
We present a study of close white dwarf and M dwarf (WDdM) binary systems and examine the effect that a close companion has on the magnetic field generation in M dwarfs. We use a base sample of 1602 white dwarf – main sequence binaries from Rebassa-Mansergas et al. (2010) to develop a set of color cuts in GALEX, SDSS, UKIDSS, and 2MASS color space. Then using the SDSS DR8 spectroscopic database, we construct a sample of 1756 WDdM high-quality pairs from our color cuts and previous catalogs. We separate the individual WD and dM from each spectrum using an iterative technique that compares the WD and dM components to best-fit templates. Using the absolute height above the Galactic plane as a proxy for age, and the H emission line as an indicator for magnetic activity, we investigate the age-activity relation for our sample for spectral types M7. Our results show that early-type M dwarfs ( M4) in close binary systems are more likely to be active and have longer activity lifetimes compared to their field counterparts. However, at a spectral type of M5 (just past the onset of full convection in M dwarfs), the activity fraction and lifetimes of WDdM binary systems becomes more comparable to that of the field M dwarfs. One of the implications of having a close binary companion is presumed to be increased stellar rotation through disk-disruption, tidal effects, or angular momentum exchange. Thus, we interpet the similarity in activity behavior between late-type dMs in WDdM pairs and late-type field dMs to be due to a decrease in sensitivity in close binary companions (or stellar rotation), which has implications for the nature of magnetic activity in fully-convective stars. Using the WD components of the pairs, we find WD cooling ages to use as an additional constraint on the age–activity relation for our sample. We find that, on average, active early-type dMs tend to be younger and that active late-type dMs span a much broader age regime making them indistinguishable from the inactive late-type population. We also show that magnetic strength, as measured by H, is comparable between paired and field M dwarfs until a spectral type of M6/M7 where M dwarf activity for stars with close companions becomes much stronger. In addition, we present 37 very-close candidate pairs with fast-moving orbits that display radial velocity changes over hour time-scales.
Subject headings:
Stars: low-mass — Stars: white dwarfs — Stars: activity — Stars: rotation — binaries: spectroscopic — binaries: close1. Introduction
Aside from being cooler, dimmer, and much less massive than the stars like the Sun, M dwarfs (dM) are the major stellar constituents of the Galaxy. The ubiquitous nature of dMs, in addition to their long lifetimes, make them excellent tracers of Galactic structure, kinematics, and evolution (Gizis et al., 2002; West et al., 2004). In addition, dMs have strong magnetic fields that heat their upper atmospheres, producing excess emission in the chromosphere and corona (called ``magnetic activity''). This magnetic activity plays a vital role in the space weather environments of dMs and likely affects the true habitability of attending planets. How these small stars generate such strong fields (several kG) and the subsequent magnetic activity is still not well understood. Therefore, detailed observations of the magnetic properties of dMs are vital for constraining theoretical dynamo models. Adding to their utility, the dM sequence (M0-M9) also probes an important transition in the structure of stellar interiors, where they change from having both radiative and convective zones, to being fully convective (around a spectral type of M4; e.g., Dantona & Mazzitelli, 1985; Dorman et al., 1989; Chabrier & Baraffe, 1997). This transition has important ramifications for how magnetic fields are generated and maintained across the dM stellar sequence (e.g., Morin et al., 2008; Reiners & Basri, 2009; Morin et al., 2010).
In the Sun, magnetic field generation is thought to be primarily driven by the shear between the stratified solid body rotation of the radiative zone and the differential rotation of the convective zone (Parker, 1955, 1993; Ossendrijver, 2003). This transition region, called the tachocline, acts to strengthen and stretch poloidal magnetic fields, establishing a large-scale toroidal magnetic field that can become unstable and rise through the convective zone to become an active region on the surface of the star (e.g., Browning, 2008). Because of the importance of the tachocline shearing in this model, stellar rotation plays a major role in the strength of the magnetic field and resulting activity. Magnetic field generation in early-type dMs ( M4) is also thought to be due to a similar mechanism as early-type dMs still have tachoclines. However, dMs later than M4 (late-type) are modeled to be fully convective (e.g., Chabrier & Baraffe, 1997) and lack tachoclines. Despite these structural differences, many studies have shown that late-type dMs have strong fields and are magnetically active (the fraction of stars that are active peaks around M7; Hawley et al. 1996; Gizis et al. 2000; West et al. 2004, 2006, 2008, hereafter W08; Donati et al. 2008; Reiners & Basri 2007, 2009, 2010)
In most stars, the strength (and presence) of magnetic activity appears to correlate with age and rotation rate (as suggested above). Several decades ago, Wilson & Woolley (1970) discovered a relation linking magnetic activity (emission in Ca II H&K) and the age of a star (estimated from galactic orbital parameters) using main sequence stars (mostly G dwarfs). They found that stars that had undergone many dynamical interactions (i.e., are older) had lower levels of activity than those stars that had more circular orbits (i.e., are younger). A short time later, Skumanich (1972) discovered an age–rotation–activity relation (again using mostly G dwarfs) showing that stars tend to spin down as they age as well as decrease in activity. The Skumanich relation occurs because angular momentum is lost from magnetized stellar winds; as a result, magnetic fields (and activity) are reduced in magnitude. Subsequent studies have confirmed the Skumanich (1972) results and established relations between age and activity (e.g., Wielen 1977; Giampapa & Liebert 1986; Soderblom et al. 1991; Hawley et al. 1996, 1999, 2000; West et al. 2004, 2006, 2008; Mamajek & Hillenbrand 2008) as well as age and rotation (e.g., Barry, 1988; Soderblom et al., 1991; Mohanty & Basri, 2003; Barnes, 2007; Kiraga & Stepien, 2007; Mamajek & Hillenbrand, 2008; Collier Cameron et al., 2009; Barnes & Kim, 2010) for G, K and early-type M dwarfs.
The exact mechanism behind the magnetic field generation in late-type dMs is still unclear. A recent study (Chabrier & Küker, 2006) suggested that magnetic activity in late-type dMs is due to an mechanism, where flux tubes are twisted in a stratified rotating fluid acted upon by the Coriolis force. Browning (2008) used simulations to show that strong magnetic fields are generated in fully convective envelopes when large slowly overturning flows are acted upon by Coriolis forces. It appears that no matter the mechanism, stellar rotation still plays an important role; rotation has a strong influence on the magnitude of the Coriolis force acting upon the overturning flows.
There is some observational evidence that the age–activity and rotation–activity relations extends into the late-type dM regime (Delfosse et al. 1998; Mohanty & Basri 2003; Reiners & Basri 2007, 2008; W08). However, there are some clear difference between early and late-type dMs. W08 calibrated a ``Galactic stratigraphy'' technique (stars farther from the Galactic mid-plane are statistically older) to show that activity decreases as a function of age in all dM spectral types and that the activity lifetimes of M dwarfs change across the transition to fully convective interiors (from 1-2 Gyr to 7-8 Gyr). In addition, Reiners & Basri (2008) demonstrated that the vast majority of late-type dMs are rotating quickly (as compared to a distribution of rotation rates for early-type dwarfs). These results suggest that if rotation is a strong driver of magnetic activity, then the spindown times of late-type dMs are much longer than those of more massive stars. In a few cases, there have been reports of fast rotating dMs that do not show measurable magnetic activity (West & Basri, 2009; Reiners et al., 2012). While some of these results may be due to spurious measurements (Reiners et al., 2012), they leave open the question of exactly what role rotation plays in the generation of magnetic field in fully convective stars.
M dwarfs with close binary companions may shed some light on the role that rotation plays in the generation, strength and lifetime of magnetic activity in dMs. It is thought that the rotational evolution of isolated stars is intricately tied to the lifetime of the circumstellar disk (e.g., Barnes & Sofia, 1996; Bouvier et al., 1997; Tinker et al., 2002). Longer lived disks allow for the star to lose more angular momentum through magnetic disk-locking (e.g., Koenigl, 1991; Shu et al., 1994) or through accretion powered stellar winds (e.g., Korycansky & Papaloizou, 1995; Papaloizou & Terquem, 1997; Matt et al., 2012); stars with long-lived disks tend to be slower rotators than stars with short-lived disks (Meibom et al., 2007). Binary companions at 100 AU shorten the disk dissipation timescale (Lin et al., 1993; Artymowicz & Lubow, 1994; Armitage & Clarke, 1996), causing angular momentum loss mechanisms such as accretion powered stellar winds and magnetic disk-locking will be halted, allowing for stars in close binary pairs to remain rotating faster for longer. Close binary pairs with separations 10 AU will also undergo the effects of tidal forces, and over time will have their spin rate synchronized to the orbital motion (e.g., Meibom & Mathieu, 2005), increasing the stellar rotation. Therefore, stars in binary systems with separations 100 AU should rotate faster due to tidal effects and/or disk truncation mechanisms. If rotation indeed plays an important role in the production of magnetic acitivity of low-mass stars, then dMs in close binary pairs should be more active than their single star counterparts.
Some previous studies have found evidence for increased magnetic activity in close, eclipsing dM binaries (Morales et al., 2010, and references therein). However, the paucity of low-mass eclipsing systems precludes any statistically significant study that focuses on how a close companion affects the observable properties of dMs. Due to the intrinsically faint nature of dMs, large samples of both single or binary stars were historically untenable. However, with the advent of large, all-sky surveys (e.g., Sloan Digital Sky Survey (SDSS, Abazajian et al., 2009), Two Micron All Sky Survey (2MASS, Skrutskie et al., 2006), UKIRT Infrared Deep Sky Survey (UKIDSS111The UKIDSS project is defined in Lawrence et al. (2007). UKIDSS uses the UKIRT Wide Field Camera (WFCAM Casali et al., 2007) and a photometric system described in Hewett et al. (2006). The pipeline processing and science archive are described in Irwin et al (in prep) and Hambly et al. (2008). We have used data from the 2nd data release, which is described in detail in Warren et al. (2007).), NASA's Galaxy Evolution Explorer (GALEX, Martin & The GALEX Team, 2005), etc.), large spectroscopic and photometric catalogs of low-mass stars have emerged. SDSS alone has enabled catalogs that contain over 70,000 visually confirmed dM spectra (West et al., 2011, hereafter W11) and more than 30 million 5-band images (Bochanski et al., 2010), providing statistically robust samples of field dMs for Galactic and stellar studies. While large samples of wide binary companions have been discovered in SDSS (Dhital et al., 2010), identifying large samples of close binary companions without high-resolution spectroscopy or adaptive optics imaging is challenging. Several SDSS studies have identified samples of close dM pairs, but have not examined their effects on the measured magnetic activity properties (e.g., Becker et al., 2011; Clark et al., 2012).
One technique for identifying close companions to dMs is to focus on systems containing an dM and a white dwarf (WD), which can be easily identified in low-resolution spectroscopy. Previous SDSS spectroscopic studies used close and unresolved WDdM binary pairs to investigate the magnetic activity of dMs with close companions (e.g., Raymond et al. 2003; Silvestri et al. 2006, hereafter S06; Heller et al. 2009). S06 compared the activity fraction of 747 close WDdM binary pairs as function of spectral type to that of isolated dMs (W04). In comparison, S06 found that the activity in early-type dMs is higher in close binary pairs than in isolated dMs; similar to the result of Heller et al. (2009) who found 23.2% of early-type unresolved white dwarf-main sequence (WDMS) to be active compared to 10% of active early-type dMs from West et al. (2004). From the WD cooling ages, S06 found that all of the active, early-type dM were found around young WDs. There was some evidence that late-type dMs (in WDdM pairs) also had a higher activity fractions, but there were not enough pairs to statistically confirm this result. In addition, neither the Raymond et al. (2003) nor the S06 samples were large enough to put the WDdM pairs in their proper Galactic context (how the magnetic activity varies with location in the Galaxy). Additional SDSS data releases have dramatically increased the sample sizes of WDdM pairs (Rebassa-Mansergas et al., 2010, 2012) , which now allow for statistical investigations of the magnetic activity properties of low-mass stars in close binaries.
In this paper, we use a large sample of WDdMs to build on the S06 analysis and investigate the magnetic activity properties of close WDdM pairs as a function of spectral type, Galactic height (a proxy for age), WD cooling ages, and binary separation. In Section 2 we describe our sample selection and general properties of our sample. In Section 3 we describe the procedures we developed to separate the binary components and calculate WDdM parameters. We also present a detailed analysis of the WD spectra using cooling tracks to estimate age, mass, and temperature. In addition, Section 3 details a radial velocity (RV) analysis using individual SDSS exposures to uncover a population of very close binary pairs. In Section 4, we present our results on activity fractions, lifetimes, and strength as a function of binary, stellar and Galactic parameters. Section 5 discusses the results from our analysis and the potential implications of having close companions on the magnetic activity of dMs. Finally, we summarize our findings in Section 6.
2. Data
We identified 1756, high-quality, close WDdM spectroscopic binaries from the SDSS Data Release 8 (DR8). Our goal was not to produce a complete sample of WDdM binary pairs (something that SDSS spectral selection precludes), but rather produce a sample of high fidelity and high signal-to-noise (S/N) spectroscopic WDdM binary pairs, expanding upon previous close WDdM catalogs: the Rebassa-Mansergas et al. (2010, 2012) sample of 1602 and 2248 WDMS pairs, respectively; and the S06 catalog of 747 close WDdM pairs. In particular, we were interested in increasing the number of late-type dMs (M7-M9) found by previous studies in an attempt to better understand how activity in close pairs affects fully convective M dwarfs at the bottom of the main sequence. We employed the use of multi-wavelength color-cuts (ultraviolet, optical and infrared) to produce a sample of 1756 close WDdM spectroscopic binaries selected from the SDSS DR8 (DR8, Abazajian et al., 2009) using the Rebassa-Mansergas et al. (2010) WDMS sample as a guideline for developing our own color cuts (described below). The advantage of using a photometric selection criteria that spanned from ultraviolet (UV) to infrared (IR) wavelengths was an increased sensitivity to late-type pairs at infrared wavelengths, whose optical fluxes are dominated by the WD components. Inversely, this multi-wavelength technique was also sensitive to pairs with very faint WD components whose optical flux is dominated by the dM. In the end, our sample of 1756 close WDdM pairs does not contain as many pairs as the Rebassa-Mansergas et al. (2012) sample due to our stringent quality cuts that ensure high S/N for both the WD and dM component; which were necessary for our magnetic activity analysis.
We used photometry from four different public catalogs, spanning the ultraviolet, optical, and infrared wavelengths, in addition to the optical spectra from SDSS DR8 catalog. The fuv (1350–1750 Å) and nuv (1750–2800 Å) bands from GALEX; the bands (3000–11000 Å) from SDSS (Fukugita et al., 1996; Gunn et al., 1998); and the J (1.25m), H (1.65m), and K (2.15m) band from both 2MASS and UKIDSS were used. In addition to slightly different filters, 2MASS (Vega-based; Skrutskie et al., 2006) and UKIDSS (AB; Hewett et al., 2006) use different magnitude systems. While 2MASS is an all-sky surey, UKIDSS probes a much smaller area but goes three magnitudes deeper, creating an effective volume 12 times larger than 2MASS. Therefore, using both 2MASS and UKIDSS maximizes the number of WDdMs that are detected in the infrared.
2.1. Sample Selection
We selected all SDSS ``point sources'' with spectra that satisfied the following quality cuts: ugriz 24 and redshift 0.003. Our initial leniency helped facilitate a large number of candidate pairs, while leaving room to filter out low quality objects in later stages of the sample selection. After removing duplicate objects, our initial sample was composed of 520,701 SDSS stars. Multi-wavelength counterparts to these objects were found in GALEX, 2MASS, and UKIDSS using three arcsecond matches to their positions. There were 227,728 matches in GALEX, 300,665 matches in 2MASS, and 131,416 matches in UKIDSS.
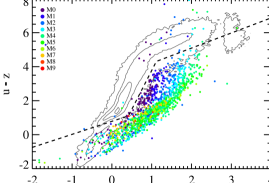
We reduced the number of false positive candidate WDdM binary systems by enforcing additional color-cuts in fuv, nuv, u, g, r, i, z, J, H, and K color space. We used the color cuts provided by Rebassa-Mansergas et al. (2010) as an initial guide for our selection. We visually inspected the 1602 WDMS spectra from Rebassa-Mansergas et al. (2010) and concluded that 1399 were WDdM pairs. We then explored the color space defined by all of the above filters and traced out regions with minimimal contamination (we defined contamination to mean the percentage of non WDdM pairs included in a color cut). Our final color cuts were similar to those described in the Rebassa-Mansergas et al. (2010) analysis, but were more useful in probing later spectral types (M7-M9) as well as spectra dominated by WD or dM flux. Our color cuts were applied to the latest SDSS DR8 catalog, where we found 364 new pairs that were not present in Rebassa-Mansergas et al. (2010). For the following discussion we will compare the effectiveness of our color cuts to the Rebassa-Mansergas et al. (2010) sample (on which we base our sample selection). Since we began our analysis, a larger sample of WDdM pairs has been published (Rebassa-Mansergas et al., 2012). We will compare our sample to that of Rebassa-Mansergas et al. (2012) in a later section. The color-cuts are shown in Figures 1-4. In each figure, the contoured data represent all SDSS point sources, while the colored filled circles represent confirmed WDdM from (Rebassa-Mansergas et al., 2010). The circles are colored according to their spectral type; this was done in an effort to identify trends in the spectral types in order to best select regions hosting the later M7-M9 spectral types that have not been well sampled in previous studies.
When using J, H, and K colors, we needed to distinguish between 2MASS (Hewett et al., 2006) and UKIDSS (Skrutskie et al., 2006) photometry separately due to the differences in the photometric precision, the zeropoints, and the filter responses. Treating them separately did not identify any significant trends that could be due to using slightly different photometric systems. However, we will present our 2MASS and UKIDSS color cut analysis separately below.
2.2. Color Cuts
WDdM systems are well separated from main sequence stars in a vs. color–color diagram (Smolčić et al., 2004). This is largely due to the fact that the color spans the wavelengths where the WD and dM components peak. The color serves to segregate the M dwarfs as a function of spectral type. Figure 1 shows the vs. color–color diagram for all SDSS stars. The main-sequence stars are shown as grey contours, while the WDdM systems spectroscopically identified in Rebassa-Mansergas et al. (2010) are shown as circles, with the colors corresponding to spectral type of the dM. The WDdM population is clearly segregated from the main-sequence stars in . We did a by-eye fit to separate the WDdM pairs from the main stellar locus, shown as dashed lines in Figure 1 and described by:
| (7) |
As can be seen in Figure 1, this selects the vast majority of WDdM pairs. However, systems that are dominated by either the WD or dM component might not be separated in the optical wavelengths. Using the UV (where the WD dominates) and the near-IR (where the dM dominates) separates those WDdM systems more cleanly. Therefore, we used the UV data from GALEX and the near-IR 2MASS and UKIDSS to identify additional pairs.
Figure 2 shows the vs. plot for our sample. The isolated objects with significant UV flux, while color separated the M dwarfs from the G and K dwarfs. While this cut is similar to the vs. cut used in Rebassa-Mansergas et al. (2010), using the color, instead of color, produced a cleaner separation. The locus of the WDdM pairs was described by
| (12) |
for 2MASS colors and by
| (13) |
for UKIDSS colors. We then used the nuv r vs. nuv H diagram to further separate WDdM pairs from the stellar locus. As Figure 3 shows, WDdM pairs are above the main-sequence stars in nuv H while nuv r spreads the pairs as a function of the dM spectral type. This cut is only slightly different from the nuv i vs. nuv H used in Rebassa-Mansergas et al. (2010) and is a better tracer of dM spectral type. The derived WDdM locus is described by
| (18) |
for 2MASS colors and
| (19) |
for UKIDSS colors. As the fourth, and final, color cut, we used nuv K vs. z J, which is only slightly different from the third one we used. However, z J is more sensitive to systems with later-type dM secondaries, as it includes the wavelength regime where late-dMs peak in flux. Figure 4 shows the WDdM locus well separated above the main stellar sequence. The derived WDdM locus is described by
| (24) |
for 2MASS colors and by
| (29) |
for UKIDSS colors.
Using the color cuts above, we selected 53,279 unique objects. The color cuts were able to recover 1379 of the 1399 WDdM pairs from Rebassa-Mansergas et al. (2010); the pairs that were missed by our color cuts had inconsistent colors with the WDdM locus (seen in Figure 1). Each object was visually inspected and given one of three simple classifications: not a WDdM, a high probability candidate, or a low probability candidate. The first two classifications are self explanatory and the third was necessary for objects that were difficult to differentiate from single WDs or dMs with low S/N or other astronomical objects. After classifying each object by-eye, there were 1,891 high-probability WDdM pairs and 2,220 low-probability pairs. We performed a detailed spectral analysis (described in Section 3) on all of the candidate pairs and were able to confirm that of the 1,891 high-probability pairs 1,460 were real and of the 2,220 low-probability pairs 199 were real, resulting in an initial sample size of 1659 WDdM pairs. The vs. cut selected 1605 of the WDdM while the IR and UV color cuts were able to select the remaining 54 pairs that were not included in the vs. cut (Equation 7). Of those 54 remaining pairs, only one pair was found exclusively using the vs. cuts (Equations 12 and 13), 18 pairs were found exclusively from the nuv r vs. nuv H cuts (Equations 18 and 19), and three pairs were found exclusively from the nuv - K vs. z -J cuts (Equations 24 and 29).
In creating the W11 M dwarf sample, over 70,000 dM were visually confirmed from over 116,000 candidate spectra from SDSS DR7. During the visual inspection process, candidate WDdM objects were flagged for later analysis, from these we added 194 possible WDdM that were not in our sample. In addition, we matched our sample to those of Rebassa-Mansergas et al. (2010) and S06 and found 522 and 144 objects, respectively, that we had missed. This resulted in a total of 910 candidate WDdM objects that we had missed in our color cut analysis. After visually inspecting each spectrum, we added 141 objects to our sample. The other 769 objects were eliminated as they were non-WDdM pairs, WD or dM stars with low S/N in the red or blue portion of the spectrum (making separation of a companion difficult), or WDdM pairs with S/N too low for our magnetic activity analysis. Finally, we did a final inspection of our sample and found 44 objects that had been misclassified or where the S/N was less than 3 near H absorption line and therefore did not meet our quality criteria. This resulted in a final sample of 1,756 confirmed close WDdM pairs. As we have mentioned earlier, this sample was not devised to be complete but rather a sample of high fidelity and high signal-to-noise spectroscopic WDdM pairs. The complete catalog will be available online.222http://vizier.u-strasbg.fr/333http://delia.phy.vanderbilt.edu/slowpokes?d=wdm
When we compared our final sample to the S06 and Rebassa-Mansergas et al. (2010, 2012) catalogs, we found that we were missing 310, 409, and 606 pairs, respectively. However, we added 847, 556, and 121 new pairs, respectively, to those three samples. The pairs missing from our sample were visually inspected; and the majority of them were not WDdM pairs but rather WDK pairs, had low S/N, or the components could not be properly separated with our spectral analysis procedure (described in Section 3.1). Thus, they were not useful for our magnetic activity study and not included in the final sample.

3. Analysis
3.1. WDdM separation procedure
Most of our sample consists of unresolved spectroscopic WDdM binaries (see in Figure 5 for 16 representative spectra from our sample). To conduct a proper analysis of the individual stellar components, it is necessary to separate the individual spectra from the combined spectrum. To do this, we constructed an iterative method for separating the combined WDdM spectrum into its individual components by fitting the appropriate WD models (Koester et al., 2001) and dM templates (Bochanski et al., 2007) to each spectrum. The Koester et al. (2001) WD models consist of 372 DA and DB WD models for varying temperatures and . The DA models vary from 6,000 to 100,000 K and each temperature bin has a separate model for values of 5, 5.5, 6, 6.5, 7, 7.5, 8, 8.25, 8.5, and 9. The DB white dwarf models vary from 10,000 to 40,000K and have values of 7, 7.5, 8, 8.5, and 9. We used half spectral type dM templates (M0, M0.5, M1, M1.5…M8.5, M9; J. Bochanski, private communication) that were derived from composites of high S/N spectra (Bochanski et al., 2007).
The iterative process was comprised of five steps: 1) We began by fitting the combined spectrum (see Figure 5 for examples) with the WD models and subtracting the best-fit model from the combined spectrum; 2) we then fit a dM template to the WD subtracted spectrum to find the best-fit dM template; 3) then, we subtracted the best-fit dM template (from step 2) from the original combined spectrum and then found the best-fit WD to the dM subtracted spectrum; 4) again, we found the best-fit dM template to the WD subtracted spectrum; and 5) we repeated this process until the best-fit WD and dM converged (did not change after repeated iterations). The process typically finished after only two or three iterations, however some fits were degenerate and alternated between different values of a single parameter. For the few cases where solutions did not converge, we stopped the procedure after ten iterations and chose the model fit with the lowest overall value. We note that we do not distinguish between cold and hot WD solutions in our fitting process as it is not imperative for our magnetic activity analysis; this could be the cause of some of the solutions failing to converge in the fitting process.
For the dM fit, we used a best-fit technique over a wavelength range of 7000-9300Å. We found that evenly weighting the entire wavelength regime of the dM provided the most accurate fits. However, the WD fitting process was more complicated; we placed higher weights on the hydrogen Balmer absorption lines and weighted them 1000 times higher than the continuum to ensure that both the shape and the depth of the absorption lines were accurately fit, features important for determining . We focused on H, H, H, and H and weighted each predicted peak (corrected for RV of the WD, detailed below) in addition to 100Å region on either side of each peak to ensure the Balmer regions were fit well. Additionally, we weighted 10Å wide portions between the absorption lines 1000 times higher to assist in properly fitting the overall shape of the WD continuum. This procedure resulted in accurate fits for both the Balmer lines as well as the continuum, which ensured an accurate subtraction of the WD from the combined SDSS spectrum and a clean dM spectrum. We also took into account possible hydrogen Balmer series emission from an active dM component that could affect the WD fit. We down-weighted the predicted locations of dM emission (corrected for RV) 1000 times lower to minimize contamination.
| SDSS ID | Plate | MJD | Fiber | dM | WD | WD Teff | WD | dM RV | WD RV |
|---|---|---|---|---|---|---|---|---|---|
| SpT | Type | (K)11We note that the values for WD and WD values are only estimates based on the best-fit models. The WD parameters reported in 2 are calculated using methods described in Section 3.2 and are more reliable. | 11We note that the values for WD and WD values are only estimates based on the best-fit models. The WD parameters reported in 2 are calculated using methods described in Section 3.2 and are more reliable. | (km s-1) | (km s-1) | ||||
| SDSS J000109.42255459.5 | 2822 | 54389 | 334 | M2.5 | DA | 16000 | 7.00 | -22.316 | 208.306 |
| SDSS J000152.10000644.7 | 387 | 51791 | 157 | M0 | DA | 40000 | 7.50 | 4.076 | |
| SDSS J000250.65045041.6 | 2630 | 54327 | 439 | M4 | DB | 20000 | 8.50 | -11.468 | -36.618 |
| SDSS J000356.93050332.7 | 2630 | 54327 | 173 | M4.5 | DA | 18000 | 8.00 | -52.853 | 73.650 |
| SDSS J000421.61004341.5 | 685 | 52203 | 561 | M5 | DB | 16000 | 9.00 | -22.385 | |
| SDSS J000447.78291140.9 | 2824 | 54452 | 600 | M0.5 | DA | 16000 | 8.00 | -18.033 | -35.996 |
| SDSS J000453.94265420.4 | 2824 | 54452 | 78 | M4 | DA | 10000 | 8.25 | -29.225 | 174.521 |
| SDSS J000504.92243409.7 | 2822 | 54389 | 180 | M4.5 | DA | 11000 | 8.25 | 41.247 | 29.640 |
| SDSS J000531.10054343.2 | 2624 | 54380 | 82 | M5 | DA | 12000 | 7.75 | -23.974 | -46.497 |
| SDSS J000559.87054416.1 | 2624 | 54380 | 60 | M1.5 | DA | 30000 | 8.00 | -9.603 | 101.562 |
After each iteration, we used a cross-correlation technique to calculate the RVs of the WD and dM components. The cross-correlation technique compared the separated WD and dM to their corresponding rest wavelength best-fit template; the shift in the cross-correlation peak yielded the component RV. The measured RV was then used to shift the wavelength axis of the template and provide a better fit in subsequent iterations. For the cross-correlations, we used a wavelength range of 3900-5200Å for the WD (this regime was chosen to include H, H, and H) and 6600-9000Å for the dM (this range includes the strong Na [8183.26, 8194.79Å] doublet and a number of TiO molecular features). In an effort to determine the uncertainty in the measured RV, we chose two bins over the wavelength ranges designated above for the WD and four bins for the dM component. For example, the WD had two bins 3900-4550 and 4550-5200Å, while the dM had four bins: 6600-7200, 7200-7800, 7800-8400, and 8400-9000Å. For each 600Å bin, we shifted the wavelength regime by 10Å 30 times towards lower wavelengths (blue) and 30 times towards longer wavelengths (red) and calculated the RV using the cross-correlation technique. The RV was taken to be the median value of all the measurements and we report the uncertainty as the median absolute deviation. The dM RVs are much more reliable because of the many narrow molecular features found in the dM spectrum, while the WD RVs have higher uncertainties due to their broad hydrogen Balmer absorption lines.

Some examples of the results from the iterative fitting process can be found in Figure 6. The top panel of the plot shows the original SDSS spectrum in black, the derived dM flux in red (SDSS spectrum – best-fit WD model), and the best-fit dM template in orange. The bottom panel is similar: the original SDSS spectrum is shown in black, the derived WD flux in light blue (SDSS spectrum – best-fit dM template), and the best-fit WD model in dark blue. Our procedure returned dM spectral type, WD effective temperature (), WD surface gravity (), and WD and dM RV . Histograms of these parameters can be found in Figure 7 and the values can be found in Table 1. We note that the WD parameters calculated through the above analysis are only estimates. In the following section (Section 3.2) we use the resulting WD spectrum (from the WDdM separation procedure described above) to perform a more detailed analysis to calculate WD parameters. When available, calculated WD parameters reported from the analysis discussed in Section 3.2 and found Table 2 should be used.
3.2. WD cooling analysis
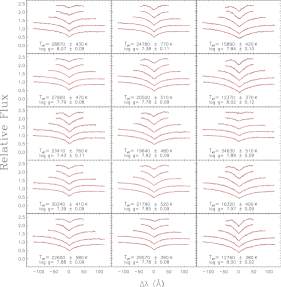
We derived the atmospheric parameters of the DA WDs ( and ) by performing a fit of the observed Balmer lines to the WD models of D. Koester (private communication). The Balmer lines in such WD models were calculated with the modified Stark broadening profiles of Tremblay & Bergeron (2009), kindly made available by the authors. For the line fitting we used the code fitsb2, which follows a procedure based on minimization (Napiwotzki et al., 2004). We considered the lines from H to H for the fitting procedure when S/N30 and from H to H when S/N30. We did not include H to minimize any effects from the M dwarf spectral subtraction technique (Section 3.1). As initial values, we considered the photometric temperature and a . The photometric were obtained by fitting the SDSS synthetic gri magnitudes to WD synthetic photometry of Holberg & Bergeron (2006). Since the SDSS gri magnitudes are likely contaminated by the M dwarf component we derived synthetic gri magnitudes from the spectrum of the WD component separated by the procedure outlined in Section 3.1. The entire WD fitting procedure is described in more detail in Garcés et al. (2011) and Catalán et al. (2008b). By using the photometric as initial value in the Balmer line fitting procedure we avoided possible degeneracies that result from the cool/hot solution (Garcés et al., 2011). In Figure 8 we show the fits to the Balmer line profiles for 15 DA WDs in our sample.
| SDSS ID | WD () | MWD () | T () |
|---|---|---|---|
| (K) | (M☉) | (Myr) | |
| SDSS J000152.10000644.7 | 7598.0 (166.0) | 0.594 (0.0006) | 1150.300 (47.500) |
| SDSS J000356.93050332.7 | 17617.0 (453.0) | 0.661 (0.0464) | 132.119 (14.636) |
| SDSS J000453.94265420.4 | 9503.0 (285.0) | 0.599 (0.0080) | 651.520 (37.821) |
| SDSS J000504.92243409.7 | 12916.0 (594.0) | 0.826 (0.0627) | 490.303 (78.049) |
| SDSS J000531.10054343.2 | 13753.0 (1505.0) | 0.789 (0.1019) | 373.370 (105.280) |
| SDSS J000559.87054416.1 | 29981.0 (523.0) | 0.767 (0.0532) | 16.788 (3.645) |
| SDSS J000651.91284647.1 | 14558.0 (1609.0) | 0.511 (0.1057) | 160.609 (51.463) |
| SDSS J000711.41283848.6 | 13401.0 (1854.0) | 0.732 (0.1254) | 350.238 (119.961) |
| SDSS J000829.92273340.5 | 17068.0 (801.0) | 0.451 (0.0786) | 77.320 (16.291) |
| SDSS J 001247.18001048.7 | 18843.0 (2922.0) | 0.993 (0.2610) | 289.300 (201.500) |
According to Bergeron et al. (1992), the atmospheres of DA WDs below K could be enriched in He while preserving their DA spectral type. This He is thought to be brought to the surface as a consequence of the development of a H convection zone. Depending on the efficiency of convection, the star could still show Balmer lines, instead of being converted into a non-DA white dwarf. The increase in He mimics the behavior of a high gravity, thus, the obtained from the spectroscopic fitting can not be trusted. For this reason when 12000K we prefer to consider the photometric and the typical value for the surface gravity .
Once we derived the and for each WD, its mass () and cooling time () were obtained using appropriate cooling sequences. We have adopted the cooling tracks of Salaris et al. (2000), which consider a carbon-oxygen (C/O) core WD (with a higher abundance of O at the central core) and a thick hydrogen envelope on top of a helium buffer, and . The resulting values for and are listed in Table 2. The total age of a WD is comprised of its cooling time plus the lifetime of its progenitor star during the pre-white dwarf stage. If a white dwarf is isolated, or in a wide binary (no interaction between members), we can calculate the mass of the progenitor using an initial-final mass relationship (e.g., Catalán et al., 2008a), and considering stellar tracks, estimate the progenitor lifetime. However, in this study we are considering white dwarfs in close binaries that may have interacted in the past, transferring mass and altering the estimated progenitor properties. However, the cooling time of the WD can be used to constrain its total age by setting a lower bound. This lower limit is particularly important when the WD companion is an dM, since determining the ages of dMs is particularly challenging (Soderblom, 2010). We derived , , , and and their corresponding uncertainties for WDs in our WDdM sample. The values are reported in Table 2.
3.3. WDdM parameters
In addition to the values presented in Tables 1 and 2, we derived additional parameters that are given in Table 3. In particular we derived the system RV through space (km s-1), the height above the Galactic plane (pc), approximate distance to the system (pc), approximate binary separation (AU) and orbital period (days) assuming circular, Keplarian orbits and an edge-on inclination, activity state (as traced by H), and magnetic activity strength (using ). In this section we discuss in detail on how we calculated each of these parameters.
3.3.1 System radial velocity
In our sample, 1714 dMs and 1674 WDs had reliable RV measurements, resulting in 1627 WDdM pairs with RV measurements for both components. In addition, we derived WD masses for 904 pairs as discussed in Section 3.2; for the rest of the WDs, we assigned a mass of 0.6 M⊙ (the average mass of 90% of WDs in SDSS DR4; Kepler et al., 2007). We inferred masses of the dMs from their spectral types (Reid & Hawley, 2005). Then using center-of-mass arguments in circular orbits, M = M, along with the measured relative RVs, we estimated the system velocity of the pair. The measured RVs are relative velocities expressed as , where is the measured RV of the WD, is the system velocity, and is the absolute RV of the WD. Similarly, we measured for the dM: . Combining these three equations, we solved for the system velocity:
| (30) |
Absolute WD and dM RVs were calculated using the measured relative RVs and the derived system velocities. Absolute WD and dM RVs, system velocities, and their corresponding uncertainties are reported in Table 3; uncertainties were calculated using standard error propagation. We note that our reported system velocities are lower limits due to the assumption of circular, edge-on, and location in the orbit. In reality, most of our measured RVs have lower values than the true stellar orbital motions. Thus, the system velocities are used for statistical relative comparisons rather than exact measurements for individual pairs.
3.3.2 Separations & Periods
Without multi-epoch RV measurements, system parameters could not be determined via full orbit solutions. Instead, we assumed the single-epoch absolute RV of each component (or ) to be its orbital velocity and calculated the projected linear separation for the binary assuming a Keplerian circular orbit and edge-on inclination. The total separation of a system was found by summing the individual component separations from the center-of-mass of the system, which was calculated by balancing centripetal and gravitational force. Considering our calculated RVs are lower limits, this suggests that our measured separations are likely upper limits. When multiple RV measurements were available (see Section 3.4), we constrained the limits on RVs and separations using the set of WD and dM measured RVs that had the maximum difference between them; this is where the RVs will be most representative of the orbital velocity. While the projection effects can be statistically corrected for ensembles, it is a steep function of orbital separation and total system mass (Dupuy & Liu, 2011). Applying the correction for individual systems introduces large uncertainties and does not affect the relative scalings; hence, we chose to not use the corrections. The estimated projected linear separations (AU) and orbital periods (days) are reported in Table 3.
3.3.3 Distances
We used a spectroscopic parallax relation that was derived from data in Bochanski (2008) to estimate the absolute magnitudes of the dM as a function of spectral type and thus calculate the approximate distance to the dM. We estimated that the distances are accurate to 20%. Photometric parallax relations for dMs are more accurate measures of distance (West et al., 2005; Davenport et al., 2006; Bochanski et al., 2010, 2011), however, due to the photometric contamination by the close WD companion (in the -band), the resulting distances would have significant errors. Calculated distances are reported in Table 3 and a distribution of distances can be found in Figure 7.
3.3.4 Vertical Distance from the Galactic plane
Using the derived distances from Section 3.3.3, the Galactic latitude and longitude, and by assuming the Sun is 15 pc above the Galactic plane (Cohen, 1995; Ng et al., 1997; Binney et al., 1997) and at a distance of 8.5 kpc from Galactic center (e.g., Matsunaga et al., 2009), we calculated the absolute height above the Galactic plane for each pair using the following relation:
| (31) |
where ZGal is the height above the Galactic plane, and are galactic latitude and longitude, is the Sun's distance from Galactic center (pc), is the Sun's height above the Galactic plane, and is the distance measured from Section 3.3.3. We used the height above the Galactic plane as a statistical proxy for the age of the binary system; younger stars are formed in the plane of the Galaxy and over time are dynamically heated and perturbed to heigher orbits (West et al. 2006; W08). Distributions of calculated Galactic heights are reported in Figure 7 and the values can be found in Table 3.
| SDSS ID | dM RV11The absolute dM radial velocity corrected for the system velocity. The corresponding dM RV uncertainties are reported in the parenthesis. | WD RV22The absolute WD radial velocity corrected for the system velocity. The corresponding WD RV uncertainties are reported in the parenthesis. | System RV33The system velocity as defined in Section 3.3.1. The system RV uncertainties calculated from the dM and RV uncertainties using standard error propogation techniques are reported in the parenthesis. | 44Projected linear separation as defined in Section 3.3.2. Recall that the separations presented in this paper are lower limits. | Period | Active | |||
|---|---|---|---|---|---|---|---|---|---|
| (km s-1) | (km s-1) | (km s-1) | (pc)55The absolute height above the Galactic plan calculated using the Equation 9 | (pc)66Distances were calculated using a spectroscopic parallax relation derived from data found in Bochanski (2008). | (AU)77The separations were calculated using the dM and WD RVs after being corrected by the system velocities. We assumed that the measured absolute RVs of each component is the orbital velocity as well as assuming edge-on circular Keplarian orbits. | (days) | |||
| SDSS J000109.42255459.5 | -22.3 (2.6) | 208.3 (208.9) | 116.1 (125.7) | -223.6 | 410.3 | 0.08 | 8.5 | no | |
| SDSS J000152.10000644.7 | -894.6 | 1047.7 | yes | 1.04e-04 | |||||
| SDSS J000250.65045041.6 | -11.5 (8.4) | -36.6 (26.5) | -28.2 (17.7) | -275.0 | 320.3 | 8.54 | 9626.5 | yes | 1.63e-04 |
| SDSS J000356.93050332.7 | -52.9 (6.3) | 73.6 (16.0) | 33.7 (14.5) | -121.8 | 150.7 | 0.40 | 93.8 | yes | 1.82e-04 |
| SDSS J000421.61004341.5 | -308.2 | 373.5 | no | ||||||
| SDSS J000447.78291140.9 | -18.0 (5.9) | -36.0 (25.9) | -27.0 (13.1) | -2070.1 | 3876.1 | 13.23 | 16066.7 | no | |
| SDSS J000453.94265420.4 | -29.2 (11.4) | 174.5 (48.2) | 106.6 (33.9) | -192.8 | 364.3 | 0.13 | 18.0 | yes | 1.24e-04 |
| SDSS J000504.92243409.7 | 41.2 (4.1) | 29.6 (14.5) | 32.7 (8.3) | -75.7 | 150.5 | 80.3 | 248091.09 | yes | 2.76e-04 |
| SDSS J000531.10054343.2 | -24.0 (3.7) | -46.5 (85.9) | -40.8 (64.4) | -33.6 | 53.2 | 21.4 | 36401.82 | yes | 9.88e-05 |
| SDSS J000559.87054416.1 | -9.6 (2.3) | 101.6 (35.7) | 60.3 (23.5) | -471.2 | 532.1 | 0.5 | 110.13 | yes | 8.82e-05 |
3.3.5 Magnetic Activity
We use the H emission line as an indicator for magnetic activity in the dMs. In order to calculate the magnetic activity strength, the line flux of H was measured using a trapezoidal integration technique over 12Å centered on the H line (West et al., 2004). The continuum was taken as the averaged flux 5Å on either side of the line region, the noise was the standard deviation of the flux over the continuum range. We calculated the of each dM using the methods described by Walkowicz et al. (2004) and West & Hawley (2008). In Walkowicz et al. (2004), the authors derived a spectral type dependent scaling factor, (the ratio of continuum flux near H over the bolometric flux), from a sample of nearby stars and 2MASS standards. Multiplying the spectral type dependent values by the measured H equivalent width (EW) resulted in independent of the dM distance. is a measure of the flux output driven by magnetic activitiy via H emission over the total bolometric luminosity of the star; this quantity is independent of the stellar continuum (unlike EW). Magnetic activity strength as measured by is reported in Table 3.
The magnetic activity state of the dMs was determined by inspecting the H line of each dM (WD subtracted) spectrum by-eye and separating them into three main categories; active, inactive, or unable to classify due to low S/N spectra. To ensure the high quality of our classifications we only considered objects to be active or inactive if the S/N near H was greater than three. Of our WDdM sample, we classified 741 as active and 496 as inactive – 526 were unclassified. Four of our objects also have very broad H emission features, possibly due to accretion (e.g., Hartigan et al., 1995); we classified these separately and excluded them from our magnetic activity analysis. A few typical examples of active and inactive stars can be found in Figure 9. The activity states are reported in Table 3 as ``yes'' for active stars, ``no'' for inactive stars, and ``N/A'' for unclassified stars.
3.4. Multiple exposure RV analysis
All SDSS spectra are composite spectra made up of multiple exposures (at least three but as many as 15). The typical exposure times were roughly 900-1200 seconds and were often made in succession. These individual exposures have been used in previous studies to investigate M dwarf flare rates (Hilton et al., 2010) and time variable spectral features (Kruse et al., 2010; Bell et al., 2012). We used the multiple exposure spectra in an effort to investigate time variability in the derived radial velocity measurements in our close WDdM binary pairs. Many of our pairs are very closely separated, and thus may have periods on the order of a few hours. The single-epoch radial velocities were calculated in a similar manner as discussed in Section 3.1, except that the best-fit template for each spectrum was already determined. We also calculated for each individual exposure as described in Section 3.3.5. The number of exposures, the median change in radial velocity (RV), the median error in the change of radial velocity (), and the time in between exposures of median RV change (hours) are reported in Table 4.
Being able to measure multiple RVs during the orbit allowed us to put better constraints on the separation of the WDdM pairs as there was a greater chance of catching the components at their maximum separation in one of the exposures (see Section 3.3.1). Very close pairs are apparent by the rapidly changing radial velocities over the baseline of the consecutive observations. In addition, these very close pairs may be interesting for followup observations and may be used to investigate the variability of magnetic activity as a function of orbital motion.
4. Results
4.1. Activity fraction vs. Galactic height
Figure 10 shows the activity fraction in close WDdM pairs (filled circles) as a function of spectral type compared to the activity fractions in the dM field sample (open diamonds, W11). The uncertainties shown in Figure 10 are calculated from the binomial distribution. We see a noticeably higher activity fraction in the close WDdM pairs than in the isolated field dMs across all spectral types. However, towards later spectral types we see the disparity in the activity fractions decrease between the WDdM and isolated dM populations. The convergence of the two populations at late spectral types seems to indicate that having a close binary companion may not affect activity in late-type M dwarfs in the same manner that it does for the earlier-type dMs.


Some of the morphology of Figure 10 is due to age effects (early-type M dwarfs have shorter active lifetimes than their late-type counterparts; W08) and the location of stars in the Galaxy (which is age dependent). Figure 11 puts our sample in the proper Galactic context by showing the activity fraction as a function of absolute Galactic height (a proxy for age) for each spectral type. The WDdM (filled circles) sample is binned by Galactic height and we chose our bin sizes to optimize the number of stars per bin; the typical bin (filled circles) has approximately 10 stars (with a minimum of 2 stars). We used the same bin sizes for the field M dwarfs (open triangles, W11). Due to the relatively small numbers of some spectral types, we combined M0 with M1 and M6 with M7 for our analysis. There are no M8 or M9 dwarfs with reliable activity parameters that were identified in our analysis.
Figure 11 shows that in comparison to isolated dMs (W11), the activity fraction is noticeably higher in almost all Galactic height bins until a spectral type of M5, confirming the higher activity fraction trend seen in Figure 10. Also, at a spectral type of M5, the disparity in activity fractions between field dM and close WDdM pairs decreases and continues to M6+M7 bins. Due to the high uncertainties the trend is not as clear in the latest type bins. Coincidently, this change occurs roughly at the spectral types with interiors that are fully convective. In addition, the activity fraction as a function of Galactic height can be interpreted as evidence for activity lifetime. By comparing the active fractions of dMs to simple 1D dynamical simulations, W08 showed that early-type dMs have short activity lifetimes (0.6-2.0 Gyr for M0-M3, respectively) and that late-type dMs have longer activity lifetimes (7.0-8.0 Gyr); there is a sharp increase of activity lifetimes at a spectral type of M4 (4.5 Gyr), the location of the onset of full convection in dMs. In Figure 11, the low activity fraction in the isolated early-type dMs (W11) can be explained by the short activity lifetimes described by W08; the activity has already had enough time to ``turn off'' near the plane. However, the isolated late-type dMs (W11) have high activity fractions close to the plane and continue to be active farther from the plane, indicating these stars remain active for longer. When examining the close WDdM population, Figure 11 shows a larger activity fraction (when compared to the field population) of early-type WDdMs close to the plane and an elevated activity fraction decreasing steadily farther from the plane, whereas almost no early-type field dMs were active farther from the plane. These results provide evidence for extended yet finite activity lifetimes for early-spectral type WDdMs (M0-M3). For the late-type dMs, Figure 11 shows that the close WDdM activity fractions are similar to the late-type field dM population close to the plane and continue to be comparable at higher Galactic heights. This similarity is interpreted as the late-type close WDdMs and late-type field dMs having the same or similar activity lifetimes. Coincidentally, M5 is just beyond the spectral type where the onset of full convection occurs in the interior of dMs.
4.2. Activity strength vs. Galactic height
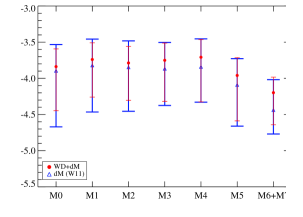
Figures 10 and 11 indicate that WDdM with early-type dMs are more likely to be active than their field counterparts while late-type dMs in close WDdM pairs show little difference in their activity state compared to late-type field dMs . Figure 12 examines the median activity strength (as measured by ) of the M dwarfs in WDdM (filled red circles) in comparison to the median activity strength in field dwarfs (open blue triangles, W11). The error bars represent the 25th and 75th quartiles of in each bin. The activity strength in WDdM pairs follows the same trend that we see in the field dM sample (W11); the activity strength is constant in early spectral types until a spectral type of M5, when the activity strength decreases. The median activity strength in the WDdM pairs is slightly larger than the median activity strength for the field dM population in every spectral type bin. Similarly, the amount by which in WDdM pairs is larger than field dMs remains constant ( dex) until a spectral type of M6+M7, where the difference in between WDdM pairs and field dMs becomes noticeably larger ( dex). This suggests that there is an increase in activity strength for later spectral types with close companions. Unfortunately, we lack large numbers of late-type dMs (M8 and later) to explore this trend further. To determine how similar the two (WDdM and isolated dMs) populations are to one another, we performed a two-sided Kolmogorov-Smirnov test (KS test, Press et al., 1992) to determine whether the for all the spectral type bins between the WDdM and isolated dM populations can be drawn from the same parent population. We found an 87.1% chance that the two populations are significantly different. Figure 12 demonstrates that the activity strengths, along with the activity fractions, are consistently stronger for dMs with close WD companions.
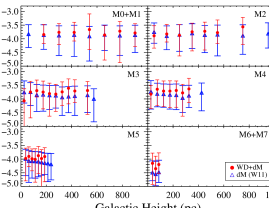
Analogous to Figure 11, Figure 13 investigates how the median activity strength (traced by ) behaves as a function of Galactic height and spectral type. We retain the same binning and formatting for Figure 13 that was used for Figure 11. Figure 13 shows that the activity strength of the dMs in WDdM pairs remains consistently higher than the activity strength of field dMs with increasing Galactic height for spectral types M0-M4. We calculated the KS test for M0+M1, M2, M3, and M4 spectral type bins and found that there is a 98.3, 66.2, 99.6, and 97.8% chance, respectively, that the binary and field populations are drawn from different parent populations. At spectral types M5, the activity strength in field dwarfs decreases with increasing Galactic height (or age), a trend that is not as obvious in the paired dMs. Using the KS test we report a 99.8% likelihood that the two M5 populations are drawn from a different parent population. Similar to M5, we see evidence that dMs in WDdM with spectral types M6+M7 had larger activity strengths than the field dwarf counterparts. With only three bins, we were unable to verify the decreasing activity strength with increasing Galactic height as seen in the M5 bins. Since we only have three bins, we performed a KS test for the stars within each of the three bins. In order of increasing Galactic height, we found 98.9, 99.5, and 78.7% significance that the two populations are drawn from different populations. Given the paucity of stars of our sample in the later spectral types, we can only speculate that the activity strength appears to remain strong in the later spectral types and also possibly with increasing height (or age). Figure 13 suggests that there may be a shift in the behavior of activity strength (as a function of spectral type and Galactic height) at spectral type M5, coinciding with a change in the structure of dM interiors.
4.3. Activity & Activity Strength vs. Binary Separation
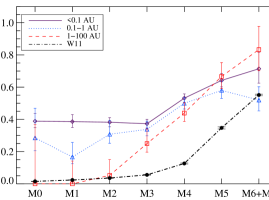
In Figure 14, we plot the fraction of active stars as a function of the dM spectral type for three separate separation bins using our projected linear separations (Section 3.3.2): than 0.1 AU, 0.1-1 AU, and 1-100 AU. Stars with separations 0.1 AU (purple solid line, diamonds) tend to be more active than stars with separations between 0.1-1 AU (blue dotted line, triangles), which are in turn more active than pairs with separations between 1-100 AU (red dashed line, squares). We also include the W11 (black dash-dotted line, solid circles) isolated dM sample to compare activity behavior between the most widely separated pairs and the field sample. Figure 14 demonstrates that at early spectral types, the widest pairs are unlikely to be active and have similar activity fractions as the field dM population. Towards later spectral types, the wide pairs appear to be more active than isolated stars, however, this result is less robust due to the increasing uncertainty in the late spectral type bins for the widest pairs. Figure 14 also shows that the difference in activity fractions between the separation populations decreases with increasing spectral type. We see a possible convergence of activity fraction in the later spectral type bins of M6+M7. Once again, this convergence appears to begin at the M3/M4 transition to fully convective interiors, which may indicate that a different mechanism is responsible for generating the magnetic fields in late-type M dwarfs.

Figure 15 shows the () vs. (binary separation) [AU] for all active pairs broken down by spectral type. For each spectral type bin we performed a linear least-squares fit to the data; the slope of each fit can be found on the corresponding panel in Figure 15. We also performed a goodness-of-fit test (F Test) comparing the linear least-squares fit to a fit using a constant line through the data. The significance values of the linear least-squares fits (as compared to a flat horizontal line) were 53.2, 11.3, 23.8, 1.9, 10.1, 53.5, 54.2, and 31.0% for spectral types M0, M1, M2, M3, M4, M5, M6, and M7, respectively. Our results suggest that there is no conclusive evidence that the binary companion increases the magnetic strength of the dM in a way that correlates with binary separation. We found no distinct change in () vs. (binary separation) across the M3/M4 fully convective boundary. From Figures 14 and 15, we see that the proximity between the WDdM pairs does not appear to strongly affect the strength of the dM chromospheric activity.
4.4. WD Cooling track ages
Using the analysis described in Section 3.2 we were able to derive physical properties for 904 of the WDs, including , mass, and cooling age (and their associated uncertainties). The WD masses were used to calculate the system velocities as well as the separations and periods of the pairs. We used the WD cooling ages as an alternative proxy for the age of the WDdM systems. The WD cooling ages are accurate to a few 100 Myr for WDs with K and accurate to 20% for WDs K; the WD cooling ages do not take into account the progenitor lifetimes. Therefore, the cooling ages are used in this study as a lower limit of the age and as a rough guide to distinguish between old and young systems. The progenitor ages cannot be determined for these systems as many of these pairs have close enough separations that mass transfer may have occurred; a slight change in the WD mass will have a significant effect on the estimated progenitor mass (and its main sequence lifetime; e.g., Catalán et al., 2008b). Figure 16, shows the WD cooling ages (Gyr) as a function of dM spectral type for the the active pairs (top panel) and the inactive pairs (bottom panel). WDs with and S/N were removed because of the large uncertainties in the calculated WD cooling ages. Figure 16 shows that there is dearth of early-type WDdM pairs with active dMs in comparison to the inactive dMs. Past spectral types of M4, both active and inactive pairs have a similar spread in WD cooling ages. We performed KS tests for spectral type bins M0+M1, M2, M3, M4, M5, and M6+7 and found that there is a 2.5, 1.7, 2.5, 82.3, 46.9, and 100.0% possibility, respectively, that the active and inactive populations are drawn from the same parent population. From the results of the KS test, we conclude that early-type, active dMs in WDdM pairs tend to have younger WD companions than the inactive sample. We see less of a difference in the active and inactive populations in the late-type dMs. In the S06 study (in which they also used WD cooling ages), WDdM pairs with active dMs in well sampled spectral type bins tended to be younger on average than WDdM pairs with inactive dMs. Our results argue that only the early-type ( M3) active dMs appear to be younger on average.

We note that there were three active, early-type WDdM pairs that exhibited old WD cooling ages, which was incongruent with the rest of the sample. We suspect that the two pairs in the M0/M1 and M2 spectral type bins were active due their very small separations (AU; see Figure 14). The WDdM pair in the M3 spectral type bin did not have as small of a separation ( AU), however, it is possible that an inactive dM was observed during a flare event (Kowalski et al., 2009).
In Figure 17, we plot the WD cooling age against the absolute Galactic height (Figure 17; left panel) and distance (Figure 17; right panel). Both the WD cooling ages and Galactic heights are proxies for the age of the binary system and we expected to see a linear relationship in Figure 17 (left panel), albeit with some scatter. However, instead of the expected linear relationship we identified a potential selection bias; there is an overdensity of systems with small WD cooling ages that span a large range of Galactic heights. Figure 17 suggests that our sample is biased towards systems that are younger; young WDs are intrinsically brighter and are easier to observe farther away. Due to the SDSS footprint (which focuses on the Northern Galactic cap), distance and absolute Galactic height are roughly equivalent. The similarity between Galactic height and distance can be seen in similar trends between the left and right panel of Figure 17. Thus, the distribution seen in Figure 17 (left panel) is due to an oversampling of the bright , young WD components that are more easily observed and can be found at farther distances. We will discuss the possible implications of this selection effect in more detail in Section 5
4.5. Very close binary pairs
| SDSS ID | Plate | MJD | Fiber | # of | RV | t | ||
|---|---|---|---|---|---|---|---|---|
| Exposures | (km s-1)11We calculated the change in radial velocities from one exposure to another (most observations were taken in succession) . RV is the median of the changes. | (km s-1)22We report in this column the calculated the uncertainty in the reported RV using each exposures individual radial velocity measurement and uncertainty. In order for the pair to be a very close WDdM candidate RV . | (hours)33The time (hours) in between exposures for the reported RV. | (AU)44Projected linear separation as defined in Section 3.3.4. Recall that the separations presented in this paper are upper limits. | ||||
| SDSS J001726.64002451.2 | 687 | 52518 | 153 | 3 | 42.1 | 11.8 | 0.375 | 0.1564 |
| SDSS J002157.91110331.6 | 1913 | 53321 | 257 | 8 | 49.1 | 14.7 | 0.375 | 0.0227 |
| SDSS J005245.12005337.2 | 394 | 51812 | 96 | 5 | 42.1 | 25.5 | 0.281 | 0.0115 |
| SDSS J015225.39005808.655This system was identified as a close binary system in Nebot Gómez-Morán et al. (2011) and has a measured spectroscopic orbital period of 2.2h. | 1504 | 52940 | 83 | 3 | 219.0 | 7.9 | 0.375 | 0.0758 |
| SDSS J023938.04273654.1 | 2444 | 54082 | 149 | 10 | 106.4 | 38.4 | 0.375 | 0.0109 |
| SDSS J030138.24050219.066This system was identified as a close binary system in Nebot Gómez-Morán et al. (2011) and has a measured spectroscopic orbital period of 12.9h. | 2307 | 53710 | 140 | 3 | 64.9 | 27.7 | 0.469 | 0.1476 |
| SDSS J030308.36005444.177This system was identified as a eclipsing binary in Pyrzas et al. (2009) | 709 | 52205 | 524 | 4 | 330.9 | 13.4 | 0.469 | 0.0088 |
| SDSS J073003.88405450.1 | 2683 | 54153 | 224 | 6 | 26.3 | 7.5 | 0.375 | 0.0076 |
| SDSS J073455.92410537.5 | 2683 | 54153 | 507 | 6 | 31.1 | 10.3 | 0.375 | 0.0282 |
| SDSS J075919.42321948.5 | 890 | 52583 | 631 | 4 | 51.1 | 11.6 | 0.375 | 0.0955 |
In our sample of 1756 pairs, 1347 had individual exposures available in SDSS DR7 that were accessible to us from previous analyses (W11). We found 37 objects that showed strong evidence of large changes in RV in small time intervals. The RVs and were calculated in the same way as was described in Section 3.1 and Section 3.3.5, respectively. The objects' primary identifiers, median change in RV, median error in the change in radial velocity (constrained using the method described in Section 3.1), and the median change in time in between exposures are reported in Table 4. As well as being interesting for studying the variability of WDdM activity, these objects are excellent candidates for studying very close binary pairs, mass accretion (e.g., Hartigan et al., 1995), eclipsing binaries (e.g., Pyrzas et al., 2009, 2012; Parsons et al., 2012), and pre-cataclysmic variables (e.g., Schreiber & Gänsicke, 2003; Tappert et al., 2009). We present these objects to the community as promising candidates for follow-up observations.
Two of the most interesting of the 37 objects can be found in Figure 18. For each pair, we plot the dM (triangles) and WD (squares) relative radial velocities vs. time elapsed since the first observation (hours). As discussed above, the WD RV calculations have larger uncertainties associated with them due to the broad WD absorption lines. Figure 18 also shows the vs. time elapsed in the bottom panel. Portions of each spectra containing the 8183Å and 8194Å Na I absorption doublet and the H line are included to provide further evidence for our radial velocity calculations. The vertical bars indicate the predicted location of the sodium doublet after being corrected to the measured system radial velocity. The fluxes of the spectra are normalized and offset for visualization purposes.
The top right panel of Figure 18 shows the dM RV for SDSS J015225.39005808.6 changing by 200 km s-1 over the course of an hour along with a correponding change in the WD RV by 100 km s-1. Previous studies have identified SDSS J015225.39005808.6 as a very close binary system with a spectroscopically determined orbital period of 2.2h (Nebot Gómez-Morán et al., 2011). In the bottom plot of Figure 18, we see that the measured dM RV for SDSS J075919.42321948.5 increases by 200 km s-1 over an hour while the WD RV decreases by the same amount. We are likely seeing a significant component of the orbital motion in this pair in a short amount of time. Previous studies have also identified SDSS J075919.42321948.5 as a very close binary system and candidate eclipsing binary (Nebot Gómez-Morán et al., 2011). We suggest that the objects found in Table 4 are promising candidates for followup studies pertaining mass accretion (e.g., Hartigan et al., 1995) or eclisping binaries (e.g., Pyrzas et al., 2009, 2012; Nebot Gómez-Morán et al., 2011; Parsons et al., 2012).
5. Discussion
We investigated how the magnetic activity of dMs in close WDdM systems compared to that in the field population (W11). In Figure 10 we found the activity fraction in WDdM pairs was higher than in isolated field dMs across all spectral types up to M7. We propose that the increased activity seen in WDdM pairs is due to increased rotation in the paired dMs. Many studies (e.g., Skumanich, 1972; Pallavicini et al., 1981; Noyes et al., 1984; Delfosse et al., 1998; Pizzolato et al., 2003; Browning et al., 2010) have correlated stellar activity with rotation in main-sequence type stars to mid-to-late dM spectral types; the larger the rotation velocities, the more activity one expects. Thus, through disk-disruption, tidal effects, and angular momentum exchange, we suspect that the rotation of the dM in a close WDdM binary system is faster than that in a typical field dM. Meibom et al. (2007) argued that disk disruption during the early stages of stellar dynamical evolution, which prevents or limits angular momentum dissipation and spin-down of the dM, is more likely the culprit than is tidal synchronization. They found no correlation between stellar rotation and orbital period or eccentricities among stars in the young (150 Myr) M35 open cluster. In addition, Meibom et al. (2007) offered the suggestion that perhaps the observed faster rotation in close binaries could be due to the varying amounts of intrinsic angular momentum present during the formation and very early evolution of the closest binary stars versus single stars.
Previous studies (e.g., S06) also found that early-type dMs ( M4) with a close WD companion have higher activity fractions than isolated field dwarfs. Due to the small number of stars with spectral types M5, S06 were unable to investigate the activity fractions of late-type WDdMs in comparison with field dwarfs from W08. Our results for the early-type dMs agree with the results of S06 and our statistics are better with over 70,000 field dMs from W11 as well as 1237 WDdMs with reliable activity properties from our sample (compared to 661 WDdMs with activity properties from S06). The S06 study also lacked sufficient numbers to explore the activity fractions in spectral types M5 with any statistical significance. We have extended the activity fraction analysis in close WDdM pairs out to spectral types M7. We show with statistical significance that the trend of higher activity fractions for dMs in WDdM pairs in comparison to field dMs extends at least to spectral types of M7 (Figure 10).
An interesting feature worth noting from Figure 10 is the convergence between the active fractions of binary and single dM populations towards later spectral types. Figure 10 shows that the activity fraction in later spectral type dMs with close binary companions is not increasing as quickly as field dMs seen by W11. If the two populations truly converge at spectral types M7, as Figure 10 suggests, then activity of late-type dMs in close WDdM pairs increases by a smaller amount in comparison with field dMs. Due to the long lifetimes of M dwarfs and the fact that their activity state is correlated with their location in the Galaxy, it is more appropriate to analyze their activity fraction within the proper Galactic context (Kowalski et al. 2009; Hilton et al. 2010; W08, W11). Figure 11 confirms that dMs in close WDdM pairs have an increased likelihood of being active. We assume that the main distinguishing property between dMs with close WD companions and field dMs is that the former have more rapid rotation (magnetic locking, disk disruption, tidal effects, or angular momentum exchange) than we might expect. This implies that the mechanism driving magnetic field generation in late-type dMs may be less sensitive to rotation than the --dynamo thought to be responsible for magnetic fields in stars with masses greater than 0.33 M☉. Previous theoretical studies have developed approaches for generating magnetic fields in fully convective stars that are correlated with rotation (Chabrier & Küker, 2006; Browning, 2008). Observationally, a few studies have suggested that the correlation between rotation and activity in fully convective stars may not be as strong as theory predicts (West & Basri, 2009; Reiners et al., 2012). Both West & Basri (2009) and Reiners et al. (2012) provide observations moderately rotating ( 3.5 km s-1), late-type dMs without any observable magnetic activity. While some of these previous results may be spurious due to low S/N spectra or other systematics, they offer a tantalizing possibility about the limited role of rotation in generating magnetic activity in late-type dMs.
Figure 11 also examines the time evolution of magnetic activity, where Galactic height was used as a proxy for the approximate age of the system. We assume all of the stars are formed close to the mid-plane of the Galaxy and over their lifetimes they are systematically able to move further from the plane due to dynamical interactions. Figure 11 shows that the activity fraction is significantly larger across all the Galactic height bins, indicating that not only are the early-type WDdMs more likely to be active than the field population, but also have longer activity lifetimes (see W08). While the activity lifetimes in early-type WDdMs may indeed be longer lived, Figure 16 (WD cooling ages as a function of spectral type for the active and inactive dMs) shows that there is a dearth of older active early-type dMs. The cooling age analysis in addition to the fact that not all early-type dM are active indicates that early-type dMs in close WDdM binary pairs still have finite active lifetimes (also seen in S06). This result is expected and agrees with the idea that dMs in WDdM pairs are sped-up (with respect to field dMs) and still contain a solar-like - dynamo. However, for the late-type WDdMs ( M5), the difference in the activity fractions becomes less obvious. In the M5 panel of Figure 11, the WDdM pairs trace the activity fraction of the field dMs very well, implying that the presence of a close WD companion no longer has an appreciable effect on the activity of dMs with spectral types M5. Not only is the activity fraction consistent between the two populations at spectral type M5, but this similarity implies that the activity lifetimes are comparable between the two populations. This is corroborated by the WD cooling age analysis (Figure 16), where the active and inactive late-type WDdM pairs appear to be drawn from the same parent distribution with higher confidence (82.3, 46.9, and 100.0% for spectral type bins M4, M5, and M6+7) compared to the early-type WDdM pairs (2.5, 1.7, and 2.5% for spectral type bines M0+M1, M2, and M3). With our assumption that dMs in close WDdM pairs are rotating faster than the field population, this result suggests that rotation is not as important in the activity state of late-type paired dMs. Evidence for this trend continues into the M6+M7 spectral types. Figure 11 suggests that whatever the driving mechanism for magnetic field generation in late-type dMs, it may not be affected by a close binary companion, or even more dramatically, rotation. The absence of enhanced activity in late-type WDdM systems can also be explained if the rotation-activity relation saturates at lower levels than in the early-type dMs. In this case, late-type dMs in close WDdM pairs are rotating faster than their single counterparts. However, once the threshold is reached, increased rotation will not cause an increase in magnetic activity (e.g., Pizzolato et al., 2003; Browning et al., 2010).
Figure 17 shows that our sample may be biased towards younger systems, where both components are intrinsically brighter and easier to observe at greater distances. We therefore, may be oversampling young WDdM pairs, which (at least for early-type dMs) tend to be more active as seen in Figures 11 and 16. Bins of higher Galactic Height (given the SDSS lines-of-sight are concentrated near the Northern Galactic Cap) will then be preferentially oversampled by active WDdM stars simply because they are brighter and easier to observe, tending to falsely inflate the activity fractions in the more distant Galactic Height bins. We examined this potential selection effect by remaking Figure 11 but only including WDdM pairs with distances 300 pc, where we would be sensitive to WDdM pairs of all WD cooling ages (Figure 19). We chose to cut on distances 300 pc because of the smooth sample distribution seen below this cutoff distance (see Figure 17; right panel). The distance cut reduced our sample to 892 WDdM pairs, which has the consequence of enlarging the uncertainties in many bins. Figure 19 shows similar behavior to Figure 11, namely increased activity fraction in the early-type dMs in WDdM pairs in comparison to the field population (with the exception of one bin in M0+M1 which is likely due to small number statistics) and similar activity fractions between the late-type WDdM and field dM populations. The trend of decreasing activity with Galactic height is somewhat lost in the M2 and M3 spectral type bins due to the small numbers and the fact we are sampling a smaller range of Galactic heights. We conclude that having a preferential selection bias towards brighter and therefore younger systems at large distances does not make a qualitative difference in our results.

Figures 10 and 11 explored the behavior of the activity state (and activity lifetimes) of dMs with close WD companions. We found evidence that the presence of close companions increases the likelihood that a star is active and extends the lifetimes of early-type dMs. However, for late-type dMs, close companions did not have much of an effect on the activity and activity lifetimes of late-type dMs. We used Figure 12 to make an analogous study, except exploring activity strength (via ) of close WDdM pairs in comparison to the field dM population. In Figure 12, the median activity strength of the active WDdM population is slightly higher across all spectral types in comparison to the field dM population. Also, is shown to remain relatively constant at approximately = 10-3.7 from spectral types M0-M4; a trend that is consistent with the field dM population (Burgasser et al. 2002; Gizis et al. 2002; W04). Towards the later spectral types ( M5), there is a decrease in activity in both populations (also seen in previous studies, Gizis et al. 2002; West et al. 2004, 2006; W11). In the M6+M7 spectral type bin we see a distinctly larger difference in between the two populations. The question is whether or not the M6+M7 result is real or simply due to a small number of stars in the M6+M7 spectral type bin. If it is a real result, then it could possibly provide some interesting insight into the magnetic field generation in stars with fully convective envelopes. Figures 10 and 11 show that the activity state in later spectral types does not seem to be affected by having a close binary companion, however, the strength of activity might be amplified by the WD. If having a close companion imparts a larger rotation to the dM, then we could be seeing that rotation in later spectral types influences the strength in activity, but has less of an effect on the likelihood of activity. In other words, rotation may play a limited role establishing magnetic activity but may have an effect on the strength of the chromospheric heating.
Figure 13 puts strength for each spectral type bin in the proper Galactic context. Figure 13 shows that the for M0+M1 and M2 dwarfs appears to be mostly flat for both the WDdM and field populations for most Galactic heights, but that the field dMs at spectral types of M3 and M4 show a slight decrease in activity with increasing Galactic height. There is no clear trend of decreasing with Galactic height seen in spectral types M3-M4 for the WDdM population. At spectral types of M5 there is a large decrease in overall activity strength in both populations, and a distinct decline in with increasing Galactic height in the field population, a trend that is indicative of activity strength decreasing with age. There is no apparent trend in the WDdM population that shows a decrease in with Galactic height as seen in the field dMs. While there are only a few objects in the M6+M7 bin, it is curious that there is a fairly large difference in activity strength between the two populations, as was identified in Figure 12. We reiterate that this could be evidence for close companions affecting the activity strength in dMs but not increasing the likelihood of activity or the lifetime of activity (Figure 11).
We have shown convincing evidence that close companions have an effect on both the activity state and activity strength in dMs. As was discussed in Section 3.3.2, we have an approximate measure for the separation for which we can investigate the effect of separation on the activity of dMs. Figure 14 is presented in the same way as Figure 10, where the activity fraction for the WDdM population is shown as a function of spectral type. The active WDdM population is further split into three separate separation bins, those less than 0.1 AU, 0.1-1 AU, and 1-100 AU. These separations bins were chosen to ensure good statistics in each spectral type bin. In comparing Figure 14 to Figure 10, the activity fraction across the spectral types follows the same trend for each separation bin as it did for the total population: low activity fractions in early spectral types and increasing activity fractions toward the later spectral types. We find that the closer separated pairs are more active than the wider separation pairs, while the widest pairs are still more active (and likely to be active) than their field counterparts. We also report an interesting trend that is seen at the later spectral types, where the active fractions for three different separation populations, as well as the field population appear to converge. Together with other results in this paper, we suggest that the mechanism driving magnetic fields in late-type dMs becomes decreasingly sensitive to the presence of a close companion, which we have interpreted as an insensitivity to rotation. However, Figure 15 shows that while every spectral type bin shows signs of decreasing activity with increased separation, a linear least-squares fit is only at most 50% significant over a flat horizontal line drawn through the data for each spectral type. Figure 14 shows that the activity state is highly dependent on the separation of the WDdM binary system while Figure 15 shows that evidence for a correlation between activity strength and separation of the WDdM binary system is inconclusive. As a result of our study and compilation of the WDdM sample we have found a number of objects that have shown convincing signs of being in a very tight binary system. We have identified 37 objects in Table 4 that we feel may be valuable to the astronomical community in studying dynamics of close binary systems, mass accretion, eclipsing binaries, and pre-cataclysmic variables.
6. Summary
Using close WDdM pairs, we have investigated the magnetic activity properties of M dwarfs in WDdM pairs. We used SDSS DR8 spectra of unresolved binaries and developed an iterative procedure to separate the two spectral components in 1756 high S/N WDdM pairs. We used the H line as an indicator of magnetic activity and both absolute Galactic height (pc) and WD cooling models to examine the activity properties as a function of age. Both the activity state and the activity strength (via ) as a function of separation were investigated using approximate binary separations found from the dM and WD component radial velocities. Below we summarize the findings of this paper.
- 1.
-
2.
We calculated numerous parameters for our sample including: dM spectral type, WD effective temperature, WD surface gravity, WD and dM relative radial velocities (km s-1), the system radial velocity through space (km s-1), galactic height above the plane (pc), approximate distance to the system (pc), approximate binary separation (AU), period of binary (days), activity (as traced by H), and , and WD ages from cooling models.
-
3.
We confirmed that paired dMs are more active than field dwarfs for early dM spectral types but then become comparable in their activity fractions at later spectral types. This gives further evidence to the notion that the mechanism that generates magnetic fields in late-type dM spectra may be different than the mechanism in early-type stars, and that it may be relatively unaffected by a close companion.
-
4.
The activity lifetimes of early-type paired dMs is longer than field dMs, but still shows sign of decreasing with increasing height, implying a finite lifetime. However, late-type paired dMs have lifetimes consistent with the lifetimes found in isolated dMs. This is reiterated when using WD cooling ages and finding that early-type active dMs in WDdM pairs are on average younger and part of a distinct population in comparison to inactive early-type dMs in WDdM pairs. In contrast, the late-type active dMs in WDdM pairs span a broader range in age and are indistinct from the late-type inactive dMs in WDdM pairs.
-
5.
We found that the median activity strength in WDdM pairs is larger across every spectral type when comparing to the field dM population. When analyzing activity strength in the proper Galactic context we find that spectral types M0-M2 remains constant for both populations; M3-M4 field dMs exhibit a decreasing with increasing galactic height while WDdMs do not exhibit a decreasing trend and are still elevated in in comparison with the field population; M5 field dMs again exhibit a decreasing with Galactic height, again not seen in WDdMs, M6+M7 field dMs show a significantly lower than in earlier spectral types while M6+M7 did not decrease in as significantly as the field population.
-
6.
The closer the separation between WDdM (and presumably any X+dM system) the more likely the dM is to be active.
-
7.
The activity strength in WDdMs shows no conclusive evidence for being dependent upon the proximity of the binary pair.
-
8.
We present 37 candidate very close pairs exhibiting significant radial velocity changes on hour timescales to which we hope will be useful for the community for follow up studies.
In investigating the activity properties of M dwarfs with close WD companions we have found some interesting trends occurring near the transition at which dMs become fully convective. Spectral types ranging from M0-M7 have been shown to exhibit higher activity fractions than the field dM population (Figure 10). However, a possible convergence between the WDdM and field dM population is seen at later spectral types. When put in the proper Galactic context, we show that early-type WDdMs still exhibit higher activity fractions as well as extended (albeit finite) activity lifetimes when compared to the field population. Beginning at spectral type of M5, we find that the activity behavior in WDdM becomes very similar to that of the field population; both in activity fractions and lifetimes. This change conveniently occurs around the proposed M4 transition to fully convective envelopes. We argue that the primary difference between the WDdM and field population is that the rotation of the dM is being sped up by the presence of a close WD companion; most likely through the destruction disk and thus reducing magnetic braking in the dM and strengthening rotation Meibom et al. (2007). The decrease in activity with the supposed increased rotation in late-type WDdM implies that the magnetic field generation mechanism is not as sensitive to rotation as in early-type M dwarfs. Almost in contradiction, we find that the activity strength does seem to increase in the presence of a WD companion in late-type WDdM. We have also shown that increases with the proximity of the binary companion. With our results we suggest that rotation in late-type dMs has a bimodal effect; rotation may play less of a role in establishing magnetic activity but does have an effect on the strength of the magnetic activity.
There are, however, alternative solutions. The first one being that rotation is important for activity and the proximity of a close binary companion is not a reliable indicator of the dM being ``sped'' up in comparison to a field dM. Another solution is that at later spectral types there is a lower rotation threshold that sets the activity and most of the late-type stars in both the populations are above that threshold. This solution is put into question by the study by West & Basri (2009), which presented field M7 dMs with significant rotation but no measured activity. Also, H emission can be induced on the dM by the irradiation of a hot WD companion in close binary systems (e.g. Tappert et al., 2011; Parsons et al., 2012). However, the effects of the irradiation only becomes significant for systems with WD K (Tappert et al., 2011). Only 78 (4%) of our sample have 45,000 K with the majority having between K and K. Hence, H emission in dM induced by WD irradiation is expected to be negligible for 96% of our sample; we expect it to have little effect on the results presented in this paper.
In the future, we hope to increase the sample size of WDdM pairs with spectral types M6 and extending this analysis to lower masses in addition to improving the overall statistics. Despite the current dearth of late-type dMs in WDdMs companions, we have added to previous studies that find likely differences in the dynamo mechanism across the fully convective boundary. We believe that close WDdM pairs provide some unique insight into the behavior of magnetic fields across the fully-convective stellar mass regime and will aid in constraining the models for generation and maintaining magnetic fields in fully convective M dwarfs.
References
- Abazajian et al. (2009) Abazajian, K. N., et al. 2009, ApJS, 182, 543
- Armitage & Clarke (1996) Armitage, P. J., & Clarke, C. J. 1996, MNRAS, 280, 458
- Artymowicz & Lubow (1994) Artymowicz, P., & Lubow, S. H. 1994, ApJ, 421, 651
- Barnes & Sofia (1996) Barnes, S., & Sofia, S. 1996, ApJ, 462, 746
- Barnes (2007) Barnes, S. A. 2007, ApJ, 669, 1167
- Barnes & Kim (2010) Barnes, S. A., & Kim, Y.-C. 2010, ApJ, 721, 675
- Barry (1988) Barry, D. C. 1988, ApJ, 334, 436
- Becker et al. (2011) Becker, A. C., Bochanski, J. J., Hawley, S. L., et al. 2011, ApJ, 731, 17
- Bell et al. (2012) Bell, K., Hawley, S. L., West, A. A., Hilton, E., & Bochanski, J. 2012, PASP
- Bergeron et al. (1992) Bergeron, P., Wesemael, F., & Fontaine, G. 1992, ApJ, 387, 288
- Binney et al. (1997) Binney, J., Gerhard, O., & Spergel, D. 1997, MNRAS, 288, 365
- Bochanski et al. (2010) Bochanski, J. J., Hawley, S. L., Covey, K. R., et al. 2010, AJ, 139, 2679
- Bochanski et al. (2011) Bochanski, J. J., Hawley, S. L., & West, A. A. 2011, AJ, 141, 98
- Bochanski et al. (2007) Bochanski, J. J., West, A. A., Hawley, S. L., & Covey, K. R. 2007, AJ, 133, 531
- Bochanski (2008) Bochanski, Jr., J. J. 2008, PhD thesis, University of Washington
- Bouvier et al. (1997) Bouvier, J., Rigaut, F., & Nadeau, D. 1997, A&A, 323, 139
- Browning (2008) Browning, M. K. 2008, ApJ, 676, 1262
- Browning et al. (2010) Browning, M. K., Basri, G., Marcy, G. W., West, A. A., & Zhang, J. 2010, AJ, 139, 504
- Burgasser et al. (2002) Burgasser, A. J., Liebert, J., Kirkpatrick, J. D., & Gizis, J. E. 2002, AJ, 123, 2744
- Casali et al. (2007) Casali, M., et al. 2007, A&A, 467, 777
- Catalán et al. (2008a) Catalán, S., Isern, J., García-Berro, E., & Ribas, I. 2008a, MNRAS, 387, 1693
- Catalán et al. (2008b) Catalán, S., Isern, J., García-Berro, E., et al. 2008b, A&A, 477, 213
- Chabrier & Baraffe (1997) Chabrier, G., & Baraffe, I. 1997, A&A, 327, 1039
- Chabrier & Küker (2006) Chabrier, G., & Küker, M. 2006, A&A, 446, 1027
- Clark et al. (2012) Clark, B. M., Blake, C. H., & Knapp, G. R. 2012, ApJ, 744, 119
- Cohen (1995) Cohen, M. 1995, ApJ, 444, 874
- Collier Cameron et al. (2009) Collier Cameron, A., et al. 2009, MNRAS, 400, 451
- Dantona & Mazzitelli (1985) Dantona, F., & Mazzitelli, I. 1985, ApJ, 296, 502
- Davenport et al. (2006) Davenport, J. R. A., West, A. A., Matthiesen, C. K., Schmieding, M., & Kobelski, A. 2006, PASP, 118, 1679
- Delfosse et al. (1998) Delfosse, X., Forveille, T., Perrier, C., & Mayor, M. 1998, A&A, 331, 581
- Dhital et al. (2010) Dhital, S., West, A. A., Stassun, K. G., & Bochanski, J. J. 2010, AJ, 139, 2566
- Donati et al. (2008) Donati, J.-F., Morin, J., Petit, P., et al. 2008, MNRAS, 390, 545
- Dorman et al. (1989) Dorman, B., Nelson, L. A., & Chau, W. Y. 1989, ApJ, 342, 1003
- Dupuy & Liu (2011) Dupuy, T. J., & Liu, M. C. 2011, ApJ, 733, 122
- Fukugita et al. (1996) Fukugita, M., Ichikawa, T., Gunn, J. E., et al. 1996, AJ, 111, 1748
- Garcés et al. (2011) Garcés, A., Catalán, S., & Ribas, I. 2011, A&A, 531, A7+
- Giampapa & Liebert (1986) Giampapa, M. S., & Liebert, J. 1986, ApJ, 305, 784
- Gizis et al. (2000) Gizis, J. E., Monet, D. G., Reid, I. N., et al. 2000, AJ, 120, 1085
- Gizis et al. (2002) Gizis, J. E., Reid, I. N., & Hawley, S. L. 2002, AJ, 123, 3356
- Gunn et al. (1998) Gunn, J. E., et al. 1998, AJ, 116, 3040
- Hambly et al. (2008) Hambly, N. C., et al. 2008, MNRAS, 384, 637
- Hartigan et al. (1995) Hartigan, P., Edwards, S., & Ghandour, L. 1995, ApJ, 452, 736
- Hawley et al. (2000) Hawley, S., Reid, I. N., & Gizis, J. 2000, in Astronomical Society of the Pacific Conference Series, Vol. 212, From Giant Planets to Cool Stars, ed. C. A. Griffith & M. S. Marley, 252–+
- Hawley et al. (1996) Hawley, S. L., Gizis, J. E., & Reid, I. N. 1996, AJ, 112, 2799
- Hawley et al. (1999) Hawley, S. L., Reid, I. N., Gizis, J. E., & Byrne, P. B. 1999, in Astronomical Society of the Pacific Conference Series, Vol. 158, Solar and Stellar Activity: Similarities and Differences, ed. C. J. Butler & J. G. Doyle, 63–+
- Heller et al. (2009) Heller, R., Homeier, D., Dreizler, S., & Østensen, R. 2009, A&A, 496, 191
- Hewett et al. (2006) Hewett, P. C., Warren, S. J., Leggett, S. K., & Hodgkin, S. T. 2006, MNRAS, 367, 454
- Hilton et al. (2010) Hilton, E. J., West, A. A., Hawley, S. L., & Kowalski, A. F. 2010, AJ, 140, 1402
- Holberg & Bergeron (2006) Holberg, J. B., & Bergeron, P. 2006, AJ, 132, 1221
- Kepler et al. (2007) Kepler, S. O., Kleinman, S. J., Nitta, A., et al. 2007, MNRAS, 375, 1315
- Kiraga & Stepien (2007) Kiraga, M., & Stepien, K. 2007, Acta Astronomica, 57, 149
- Koenigl (1991) Koenigl, A. 1991, ApJ, 370, L39
- Koester et al. (2001) Koester, D., et al. 2001, A&A, 378, 556
- Korycansky & Papaloizou (1995) Korycansky, D. G., & Papaloizou, J. C. B. 1995, MNRAS, 274, 85
- Kowalski et al. (2009) Kowalski, A. F., Hawley, S. L., Hilton, E. J., et al. 2009, AJ, 138, 633
- Kruse et al. (2010) Kruse, E. A., Berger, E., Knapp, G. R., et al. 2010, ApJ, 722, 1352
- Lawrence et al. (2007) Lawrence, A., et al. 2007, MNRAS, 379, 1599
- Lin et al. (1993) Lin, D. N. C., Papaloizou, J. C. B., & Kley, W. 1993, ApJ, 416, 689
- Mamajek & Hillenbrand (2008) Mamajek, E. E., & Hillenbrand, L. A. 2008, ApJ, 687, 1264
- Martin & The GALEX Team (2005) Martin, C., & The GALEX Team. 2005, in Multiwavelength Mapping of Galaxy Formation and Evolution, ed. A. Renzini & R. Bender, 197–+
- Matsunaga et al. (2009) Matsunaga, N., Kawadu, T., Nishiyama, S., et al. 2009, MNRAS, 399, 1709
- Matt et al. (2012) Matt, S. P., Pinzón, G., Greene, T. P., & Pudritz, R. E. 2012, ApJ, 745, 101
- Meibom & Mathieu (2005) Meibom, S., & Mathieu, R. D. 2005, ApJ, 620, 970
- Meibom et al. (2007) Meibom, S., Mathieu, R. D., & Stassun, K. G. 2007, ApJ, 665, L155
- Mohanty & Basri (2003) Mohanty, S., & Basri, G. 2003, ApJ, 583, 451
- Morales et al. (2010) Morales, J. C., Gallardo, J., Ribas, I., et al. 2010, ApJ, 718, 502
- Morin et al. (2010) Morin, J., Donati, J.-F., Petit, P., et al. 2010, MNRAS, 407, 2269
- Morin et al. (2008) Morin, J., et al. 2008, MNRAS, 390, 567
- Napiwotzki et al. (2004) Napiwotzki, R., Yungelson, L., Nelemans, G., et al. 2004, in Astronomical Society of the Pacific Conference Series, Vol. 318, Spectroscopically and Spatially Resolving the Components of the Close Binary Stars, ed. R. W. Hilditch, H. Hensberge, & K. Pavlovski, 402–410
- Nebot Gómez-Morán et al. (2011) Nebot Gómez-Morán, A., Gänsicke, B. T., Schreiber, M. R., et al. 2011, A&A, 536, A43
- Ng et al. (1997) Ng, Y. K., Bertelli, G., Chiosi, C., & Bressan, A. 1997, A&A, 324, 65
- Noyes et al. (1984) Noyes, R. W., Weiss, N. O., & Vaughan, A. H. 1984, ApJ, 287, 769
- Ossendrijver (2003) Ossendrijver, M. 2003, A&A Rev., 11, 287
- Pallavicini et al. (1981) Pallavicini, R., Golub, L., Rosner, R., et al. 1981, ApJ, 248, 279
- Papaloizou & Terquem (1997) Papaloizou, J. C. B., & Terquem, C. 1997, MNRAS, 287, 771
- Parker (1955) Parker, E. N. 1955, ApJ, 122, 293
- Parker (1993) —. 1993, ApJ, 408, 707
- Parsons et al. (2012) Parsons, S. G., Marsh, T. R., Gänsicke, B. T., et al. 2012, MNRAS, 420, 3281
- Pizzolato et al. (2003) Pizzolato, N., Maggio, A., Micela, G., Sciortino, S., & Ventura, P. 2003, A&A, 397, 147
- Press et al. (1992) Press, W. H., Teukolsky, S. A., Vetterling, W. T., & Flannery, B. P. 1992, Numerical recipes in FORTRAN. The art of scientific computing, ed. Press, W. H., Teukolsky, S. A., Vetterling, W. T., & Flannery, B. P.
- Pyrzas et al. (2009) Pyrzas, S., Gänsicke, B. T., Marsh, T. R., et al. 2009, MNRAS, 394, 978
- Pyrzas et al. (2012) Pyrzas, S., Gänsicke, B. T., Brady, S., et al. 2012, MNRAS, 419, 817
- Raymond et al. (2003) Raymond, S. N., et al. 2003, AJ, 125, 2621
- Rebassa-Mansergas et al. (2010) Rebassa-Mansergas, A., Gänsicke, B. T., Schreiber, M. R., Koester, D., & Rodríguez-Gil, P. 2010, MNRAS, 402, 620
- Rebassa-Mansergas et al. (2012) Rebassa-Mansergas, A., Nebot Gómez-Morán, A., Schreiber, M. R., et al. 2012, MNRAS, 419, 806
- Reid & Hawley (2005) Reid, I. N., & Hawley, S. L. 2005, New light on dark stars : red dwarfs, low-mass stars, brown dwarfs (Praxis Publishing Ltd)
- Reiners & Basri (2007) Reiners, A., & Basri, G. 2007, ApJ, 656, 1121
- Reiners & Basri (2008) —. 2008, ApJ, 684, 1390
- Reiners & Basri (2009) —. 2009, A&A, 496, 787
- Reiners & Basri (2010) —. 2010, ApJ, 710, 924
- Reiners et al. (2012) Reiners, A., Joshi, N., & Goldman, B. 2012, AJ, 143, 93
- Salaris et al. (2000) Salaris, M., García-Berro, E., Hernanz, M., Isern, J., & Saumon, D. 2000, ApJ, 544, 1036
- Schreiber & Gänsicke (2003) Schreiber, M. R., & Gänsicke, B. T. 2003, A&A, 406, 305
- Shu et al. (1994) Shu, F. H., Najita, J., Ruden, S. P., & Lizano, S. 1994, ApJ, 429, 797
- Silvestri et al. (2006) Silvestri, N. M., et al. 2006, AJ, 131, 1674
- Skrutskie et al. (2006) Skrutskie, M. F., et al. 2006, AJ, 131, 1163
- Skumanich (1972) Skumanich, A. 1972, ApJ, 171, 565
- Smolčić et al. (2004) Smolčić, V., et al. 2004, ApJ, 615, L141
- Soderblom (2010) Soderblom, D. R. 2010, ARA&A, 48, 581
- Soderblom et al. (1991) Soderblom, D. R., Duncan, D. K., & Johnson, D. R. H. 1991, ApJ, 375, 722
- Tappert et al. (2011) Tappert, C., Gänsicke, B. T., Rebassa-Mansergas, A., Schmidtobreick, L., & Schreiber, M. R. 2011, A&A, 531, A113
- Tappert et al. (2009) Tappert, C., Gänsicke, B. T., Zorotovic, M., et al. 2009, A&A, 504, 491
- Tinker et al. (2002) Tinker, J., Pinsonneault, M., & Terndrup, D. 2002, ApJ, 564, 877
- Tremblay & Bergeron (2009) Tremblay, P.-E., & Bergeron, P. 2009, ApJ, 696, 1755
- Walkowicz et al. (2004) Walkowicz, L. M., Hawley, S. L., & West, A. A. 2004, PASP, 116, 1105
- Warren et al. (2007) Warren, S. J., et al. 2007, ArXiv Astrophysics e-prints
- West & Basri (2009) West, A. A., & Basri, G. 2009, ApJ, 693, 1283
- West et al. (2006) West, A. A., Bochanski, J. J., Hawley, S. L., et al. 2006, AJ, 132, 2507
- West & Hawley (2008) West, A. A., & Hawley, S. L. 2008, PASP, 120, 1161
- West et al. (2008) West, A. A., Hawley, S. L., Bochanski, J. J., et al. 2008, AJ, 135, 785
- West et al. (2005) West, A. A., Walkowicz, L. M., & Hawley, S. L. 2005, PASP, 117, 706
- West et al. (2004) West, A. A., et al. 2004, AJ, 128, 426
- West et al. (2011) —. 2011, AJ, 141, 97
- Wielen (1977) Wielen, R. 1977, A&A, 60, 263
- Wilson & Woolley (1970) Wilson, O., & Woolley, R. 1970, MNRAS, 148, 463