On the thermal and double episode emissions in GRB 970828
Abstract
Following the recent theoretical interpretation of GRB 090618 and GRB 101023, we here interpret GRB 970828 in terms of a double episode emission: the first episode, observed in the first 40 s of the emission, is interpreted as the proto-black-hole emission; the second episode, observed after t0+50 s, as a canonical gamma ray burst. The transition between the two episodes marks the black hole formation. The characteristics of the real GRB, in the second episode, are an energy of erg, a baryon load of and a bulk Lorentz factor at transparency of . The clear analogy with GRB 090618 would require also in GRB 970828 the presence of a possible supernova. We also infer that the GRB exploded in an environment with a large average particle density part/cm3 and dense clouds characterized by typical dimensions of cm and . Such an environment is in line with the observed large column density absorption, which might have darkened both the supernova emission and the GRB optical afterglow.
1. Introduction
GRB 970828 is one of the first GRBs with an observed afterglow (Piro et al., 1999) and a determined redshift of =0.9578 from the identification of its host galaxy (Djorgovski et al., 2001). This source is still presenting today, after 15 years from its observations, an extremely rich problematic in the identification of its astrophysical nature.
The X-ray afterglow was discovered by the ASCA satellite 1.17 days after the GRB trigger (Murakami et al., 1997) and the data showed the presence of a feature around 5 keV, maybe associated to a radiative recombination edge of a H- or He-like ionized iron (Yoshida et al., 2001). Particularly interesting was also a variable and large intrinsic absorption column which was found from the ASCA: the absence of an optical afterglow (Groot et al., 1998), the large intrinsic absorption column detected in the X-ray data (Yoshida et al., 2001) and the contemporary detection in radio-wavelengths of the GRB afterglow, imply a very large value for the circum-burst medium (CBM), this variable absorption might be an indication of a strong inhomogeneous CBM distribution.
Pe’er et al. (2007) described the presence of an evolving thermal component in the first 40 s of the emission of GRB 970828, as observed by the BATSE detector on board the Compton Gamma Ray Telescope (Meegan et al., 1992). This thermal emission was associated to the photospheric GRB emission of a relativistic expanding fireball (Mészáros, 2002), and from the observed properties of the blackbody spectrum it was inferred the bulk Lorentz Gamma factor of the expanding plasma, . This first thermal component is followed by a second emission episode, which starts 50 s after the GRB trigger. This second episode was neglected in the analysis of Pe’er et al. (2007), where they explicitly stated to “neglect here late-time episodes of engine activity that occur after 25 and 60 s in this burst”.
We have recently proposed that some GRBs, namely GRB 090618 (Ruffini, 2011; Izzo et al., 2012) and GRB 101023 (Penacchioni et al., 2012), can be described by two sharply different emission episodes. A first episode that is characterized by a thermal component in the early phases of its emission, which originates from an expanding source, not related to the GRB emission. We have shown that this component is characterized by an expansion of the blackbody emitter, whose origin is associated to the latest phase of the life of a massive star. In the late phase of its evolution, this massive star is well-described by a bare core that has lost its Hydrogen envelope and most or entirely the Helium one, during the previous stages of its evolution. This core is then observed to expand at non-relativistic velocities. At the end of the first episode, the collapse to a black hole occurs and the actual GRB emission happens. Since this first episode occurs prior to the GRB emission and to the formation of a black hole, we have referred to this as the proto-black-hole ( PBH - from the ancient greek that means anteriority in space and in time ).
In this work we describe first the PBH component that we find in the first episode of GRB 970828 light curve. We then proceed to the description of the second episode, which in this work represents the authentic GRB emission. The GRB emission is well explained in the context of the fireshell scenario, see e.g. Ruffini et al. (2007) for a complete review of the model. We find for the GRB an -plasma total energy of erg, a baryon load and a Lorentz Gamma factor at transparency of . From the numerical simulations we confirm the presence in the CBM of large average particle density, of the order of part/cm3, and dense clouds with . We show that this can explain the “dark” nature of this GRB and the observed large and variable column absorption in the ASCA X-ray afterglow. These results are in very good agreement with the analysis presented in Yoshida et al. (2001) and represents a further confirmation of the presence of a PBH in the early emission of GRB 970828.
2. Data Analysis
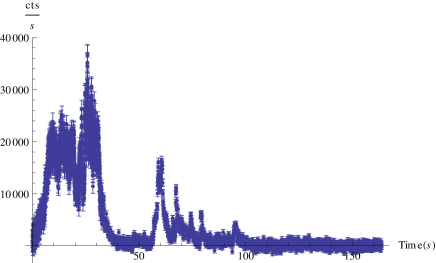
GRB 970828 was discovered with the All-Sky Monitor (ASM) on board the Rossi X-Ray Timing Explorer (RXTE) on 1997 August 28th (Smith et al., 1997). Within 3.6 hr the RXTE/PCA scanned the region of the sky around the error box of the ASM burst and detected a weak X-ray source (Marshall et al., 1997; Filippenko et al., 1997). GRB 970828 was also observed by the Burst and Transient Source Experiment (BATSE) and the GRB experiment on Ulysses (Smith et al., 1997). The BATSE-LAD light curve is characterized by two main emission phenomena, see Fig.1: the first lasts about 40 s and is well described by two main pulses, the second one is more irregular, being composed by several sharp pulses, lasting other 40 s. The X-ray afterglow observations started at about 0.1 days after the trigger time and continued up to 7-10 days. It is well described by a double power-law behavior, but a possible resurgence of soft X-ray emission, together with marginal evidence for the existence of Fe lines, was reported by Beppo-SAX and ASCA (Vietri et al., 1999).
The optical observations, which started about 4 hr after the burst, did not report any possible optical afterglow for GRB 970828 up to =23.8 (Groot et al., 1998). However, the observations at radio wavelengths of the burst position, 3.5 hrs after the initial burst, succeeded in identifying a source at a good significance level of 4.5 (Djorgovski et al., 2001) inside the ROSAT error circle (10”). The following deep searches for a possible optical counterpart of this radio source led to the identification of an interacting system of faint galaxies, successively recognized as the host galaxy of GRB 970828. The spectroscopic observations of the brightest of this system of galaxies led to the identification of their redshift, being =0.9578. The lack of an optical transient associated with the afterglow of GRB 970828 can be explained as due to the presence of strong absorption, due to dusty clouds in the burst site environment, whose presence does not affect the X-ray and the radio observations of the GRB afterglow.
To analyze in detail this GRB, we have considered the observations of the BATSE-LAD detector, which observed GRB 970828 in the 25-1900 keV energy range, and then we have reduced the data by using the RMFIT software package. For the spectral analysis we have considered the High Energy Resolution Burst (HERB) data, which consist of 128 separate high energy resolution spectra stored during the burst emission. The light curve was obtained by using the Medium Energy Resolution (MER) data, which consist of 4.096 16-channel spectra summed from triggered detectors.
2.1. The PBH emission in the first emission episode
| Spectral model | |||||||
|---|---|---|---|---|---|---|---|
| Band | -0.62 0.03 | -2.14 0.05 | 358.0 12.2 | 1.21 | |||
| BB + po | 63.00 0.89 | 1.51 0.01 | 2.10 | ||||
| DoubleBB + po | 108.0 6.5 | 40.6 2.0 | 1.54 0.02 | 0.99 |
|
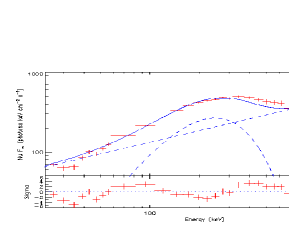
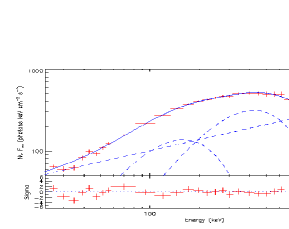
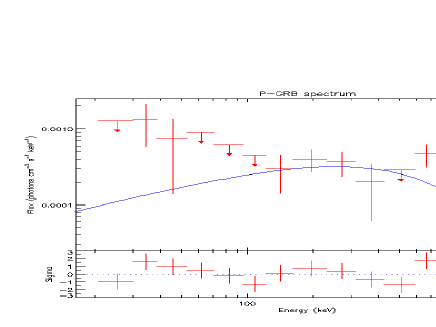
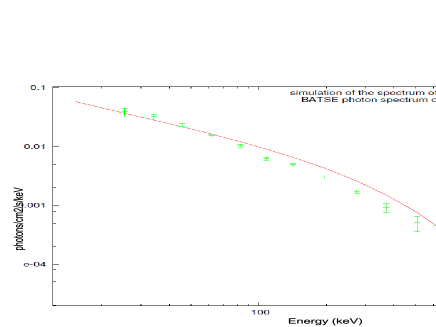
In analogy to the cases of GRB 090618 (Izzo et al., 2012) and GRB 101023 (Penacchioni et al., 2012), we analyze here the first emission episode in GRB 970828 to seek for a PBH signature. An integrated spectral analysis of these initial 40 s of emission is reported in Table 1. This first time interval is best fitted by a Band spectral model and by a double blackbody with an extra power-law component. A single blackbody with power-law is not satisfactory, providing a , see Fig. 2.
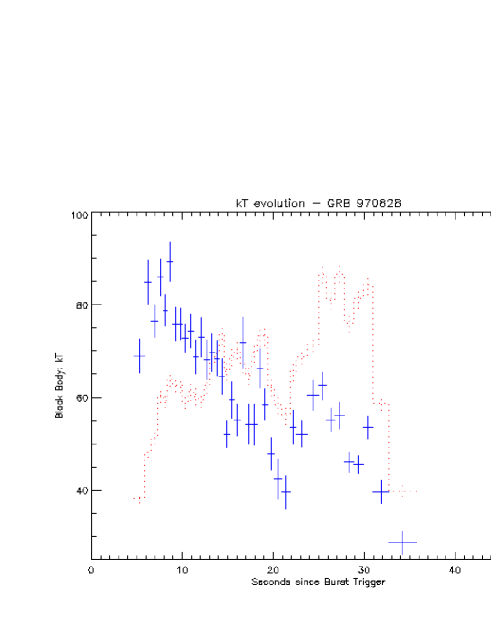
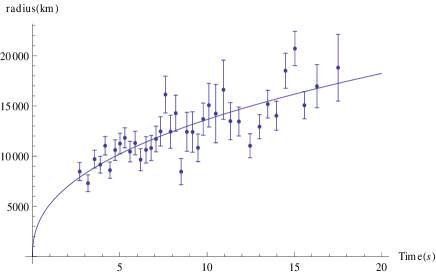
A detailed time-resolved investigation of these initial 40 s of emission has provided very interesting results: the analysis with a single blackbody plus a power-law model has revealed a double decay trend of the temperature , corresponding to the two main spikes in the observed light curve of this first episode, see Fig. 3. We have then analyzed this characteristic evolution of the blackbody in both time intervals, corresponding each one to an observed decay trend of the temperature. From the observed flux of the blackbody component for each interval, we obtain the evolution of the emitter radius, which is given by
| (1) |
where is the Stefan constant, the observed temperature, the luminosity distance of the GRB and the redshift. The evolution of the emitter radius for the complete PBH emission is shown in Fig. 4. It is very interesting that the radius monotonically increases, without showing the double trend observed for the temperature, see Fig. 3. The global evolution of the emitter radius is well-described with a power-law function and a best fit of the data provides for the index the value of 0.42 0.05, with an statistic value of 0.98, see Fig. 4.
We conclude that the double blackbody observed in the integrated emission of the first episode is indeed due to the expansion, during the PBH emission, from an initial radius of 7000 km to a final distances of 20000 km from the progenitor.
2.2. The GRB emission in the second emission episode
The observed fluence in GRB 970828 and the redshift imply an isotropic energy for the total GRB emission erg. Following the separation of this GRB in two different episodes we have computed the isotropic energies emitted in both episodes, by considering a Band model as the best fit for the observed integrated spectra: erg and erg. In what follows we explain the second emission episode of GRB 970828 as a single canonical GRB emission in the context of the Fireshell scenario.
In this model (Ruffini et al., 2001b; Ruffini, 2001; Ruffini et al., 2001a), a GRB originates from an optically thick -plasma created in the process of vacuum polarization by a charged black hole (Christodoulou & Ruffini, 1971; Damour & Ruffini, 1975). The dynamics of this expanding plasma is mainly described by its total energy , the baryon load and the circum burst matter (CBM) distribution around the burst site. The GRB light curve emission is characterized by a first brief emission, named the proper GRB or P-GRB, originating in the process of the transparency emission of the -plasma, followed by a multi-wavelength emission due to the collisions of the residual accelerated baryons and leptons with the CBM. This latter emission is assumed in a fully radiative regime and is called the extended afterglow. In the spherically symmetric approximation the interaction of the accelerated plasma with the CBM can be described by the matter density distribution around the burst site and the fireshell surface filling factor , which is the ratio between the effective emitting area and the total one (Ruffini et al., 2005). The spectral energy distribution is well-described by a “modified” thermal emission model (Patricelli et al., 2011), which differs from a classical blackbody model by the presence of a tail in the low-energy range.
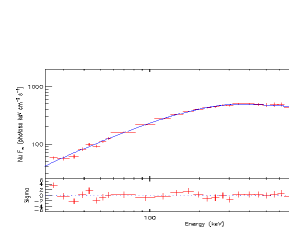
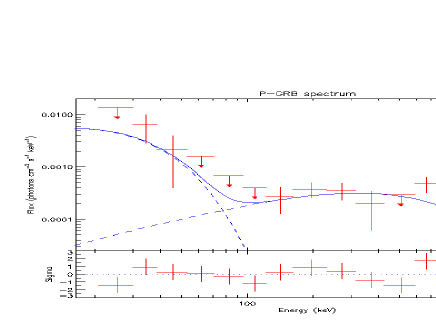
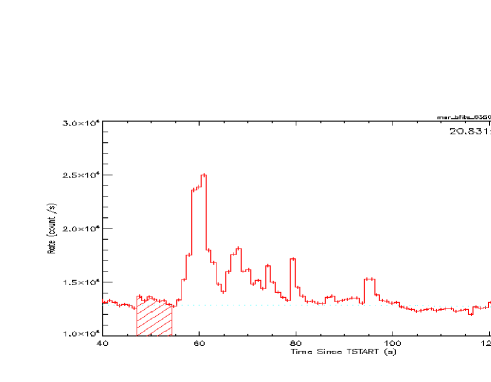
In this context, to simulate the second episode of GRB 970828, which is the actual GRB emission, we need to identify the P-GRB signature in the early second episode light curve. From the identification of the P-GRB thermal signature, and the consequent determination of the energy emitted at transparency, we can obtain the value of the baryon load assuming that the total energy of the -plasma is given by the isotropic energy observed for the second episode of GRB 970828, as it was done for the second episode in GRB 090618, see e.g. Izzo et al. (2012). We have then started to seek for any thermal feature attributable to the P-GRB emission in the early emission of the second episode. As it is shown in Fig. 6, the early emission of the second episode is characterized by an intense spike, anticipated by a weak emission of 7 s. The emission observed in this time interval can be fitted by a power-law with an exponential cut-off model (Comptonization model in RMFIT) as well as with the addition of a blackbody component, see Table 2 and Fig. 5.
|
| Spectral model | C-STAT/dof | |||
|---|---|---|---|---|
| Compt | -0.68 0.42 | 969.8 180 | 75.3/11 | |
| BB + Compt | -1.13 0.58 | 894.4 152 | 9.23 2.46 | 66.7/9 |
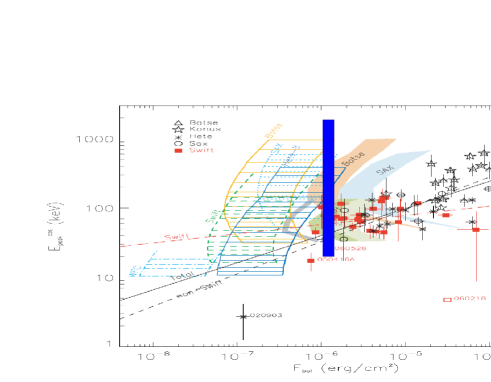
The observed fluence in the P-GRB emission, computed from the fit with the blackbody and the power-law with exponential cut-off model is . This value of the fluence is at the boundary of the region of minimum fluence that a burst should have in order to perform a spectral analysis, in a given energy range, and then derive the main spectral parameters, as the peak energy or the blackbody temperature (Ghirlanda et al., 2008), see also Fig. 7. In this light, we can conclude that the signature of the P-GRB emission is represented by these early 7 s of emission and in the following we will base on this time interval for the P-GRB emission of the second episode of GRB 970828.
| Parameter | Value |
|---|---|
| (1.60 0.03) 1053 erg | |
| (7.00 0.55) 10-3 | |
| 142.5 57 | |
| (7.4 1.3) keV | |
| (1.46 0.43) 1051 erg | |
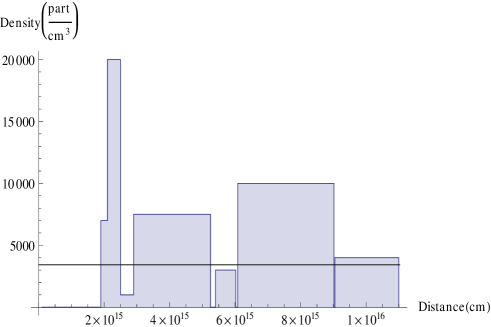
From the observed fluence and the values obtained from the spectral fits, we have computed the energy emitted in the P-GRB by using the Schaefer formula of the K-correction (Schaefer, 2007) and the redshift of the source: it is erg. This value of the P-GRB energy is only 9 10-3 the isotropic energy of the second episode, which we can assume as equal to the energy of the -plasma of the GRB emission. In this way, with the knowledge of the temperature at transparency and of the P-GRB energy, we can derive the value of the baryon load from the numerical solutions of the fireshell equations of motion. These solutions for four different values of the total e+e--plasma energy are shown in the Fig. 4 of Izzo et al. (2012). We find that the baryon load is , which corresponds to a Lorentz gamma factor at transparency . The GRB emission was simulated with very good approximation by using a density mask characterized by an irregular behavior: all the spikes correspond to spherical clouds with a large particle density part/cm3, and with radius of the order of cm, see Fig. 8. Considering all the clouds found in our analysis, the average density of the CBM medium is particles/cm3. The corresponding masses of the blobs are of the order of g, in agreement with the clumps found in GRB 090618.
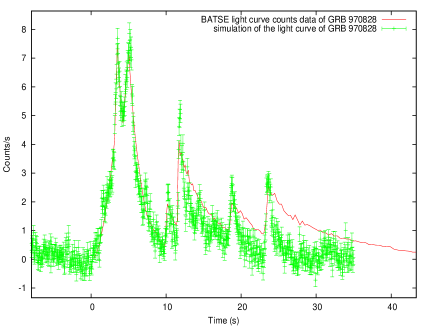
The results of the fireshell simulation are shown in Table 3 while the simulated light curve and spectrum are shown in Fig. 9.
2.3. Limits on a possible SN-related observations and neo-neutron star
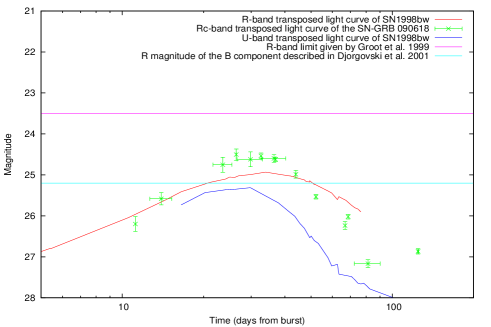
The analysis of GRB 090618 (Izzo et al., 2012) and GRB 101023 (Penacchioni et al., 2012) represents an authentic “Rosetta Stone” for the understanding of the GRB-SN phenomenon. The possible presence of a supernova emission, observed ten days after the burst in GRB 090618 (Cano et al., 2011) but not spectroscopically confirmed, is at the same time very intriguing in light of the still unknown GRB-SN connection (Della Valle, 2011). We have transposed the data of the “bump” Rc-band light curve observed in the optical afterglow of GRB 090618, associated to the presence of a possible underlying supernova (Cano et al., 2011), to the redshift of GRB 970828. This simple operation concerns only the transformation of the flux observed, under the assumption that the SN has the same intrinsic luminosity: the variation of the magnitude only depends on the square of the difference between the luminosity distances. Moreover, we have also transposed the and band light curves of SN 1998bw (Galama1998), which is the prototype of a supernova associated to a GRB. From the correction transformation formula, the band light curve, transposed at =0.9578, corresponds approximately to the observed band light curve, so in principle we should consider the nm transposed light curve as the actual one observed with the nm optical filter. These transposed light curves are shown in Fig. 10. We conclude that the possible Supernova emission could have been seen between 20 and 40 days after the GRB trigger, neglecting any possible intrinsic extinction. The optical observations were made up to 7 days from the GRB trigger, reaching a limit of (Groot et al., 1998) and subsequent deeper images after days (Djorgovski et al., 2001), so there are no observations in this time interval. However, the -band extinction value should be large since the observed column density from the X-ray observations of the GRB afterglow is large as well (Yoshida et al., 2001): the computed light curve for the possible SN of GRB 970828 should be lowered by more than 1 magnitude, leading to a SN bump below the = 25.2 limit, see Fig. 10. The presence of very dense clouds of matter near the burst site might be the cause of these absorptions. Indeed we find the presence of clouds in our simulation at the average distances of cm from the GRB progenitor, with average density of part/cm3 and typical dimensions of cm, see Fig. 8.
The possibility to observe the energy distribution from a GRB in a very wide energy range, thanks to the newly space missions dedicated, has allowed to definitely confirm the presence of two separate emission episodes in GRBs associated to SNe. Future missions, as the proposed LOFT 111http://www.isdc.unige.ch/loft/index.php/the-loft-mission, will allow to observe the thermal decay from these objects down to keV. The Large Area Detector, designed for the LOFT mission, could be also able to observe in timing mode the emission from the newly born neutron star (NS) from Supernovae Ib/c, catching a possible characteristic signature of the neo-NS (Negreiros et al., 2012), shedding more light on the SN-GRB enigma.
3. Conclusions
A general conclusion is therefore appropriate: it is mandatory to proceed to a detailed spectral analysis in parallel to an identification of the physical and astrophysical nature of the source. This has been made explicitly clear in the analysis of GRB 090618 (Izzo et al., 2012). The crucial role of GRB 090618 has been to evidence the existence of a new family of GRBs, associated to SNe, composed of two distinct emission episodes.
This has been made possible thanks to different reasons: 1) the large number of detectors, Fermi, Swift BAT and XRT, AGILE, Suzaku-WAM, Konus-WIND and Coronas PHOTON RT-2, that allowed to study that GRB in a very wide electromagnetic energy range, from 0.3 keV to 40 MeV; 2) the very large intensity emitted from GRB 090618, erg; 3) the low redshift of the GRB, = 0.54. Although both episodes radiate in the hard X-ray energy range, the first episode originates from a non-relativistic expansion process, having an expansion velocity of 1000 km/s, see Fig. 4, and occurring prior to the formation of a black hole; the second one is the one occurring at the formation of the black hole and is the authentic GRB emission. Of course, the understanding of these two components cannot be done only on a phenomenological basis, but it requires an understanding of the underlying physical and astrophysical processes.
We verify in this work that indeed GRB 970828 is a member of this family. The new understanding leads to a wealth of information on the evolution of the thermal component and of the radius of the blackbody emitter, given by Eq. (1), in the first emission episode, see Figs. 3, 4. Similarly, for the second episode we obtained the CBM structure, see Fig. 8, the details of the simulation of the lightcurve and the spectrum of the real GRB emission, see Fig. 9. We have also shown in Table 2 the final results of the GRB simulation, the total energy of the plasma, the baryon load , the temperature of the P-GRB and the Lorentz Gamma factor at transparency , as well the average value of the CBM density and the density ratio of the clouds . Finally, from the analogy with the optical bump observed in GRB 090618, see Fig. 10, associated to a possible SN emission (Cano et al., 2011), we have given reasons why a possible SN associated to GRB 970828 would not have been observable due to the large interstellar local absorption, in agreement with the large column density observed in the ASCA X-ray data Yoshida et al. (2001) and with the large value we have inferred for the CBM density distribution, particles/cm3.
We thank J. Rafelski for useful discussions about the writing of this manuscript. We also thank Z. Cano for providing the data of the optical bump observed in the afterglow of GRB 090618. HD, GP and AVP acknowledge the support for the fellowship awarded for the Erasmus Mundus IRAP PhD program.
References
- Cano et al. (2011) Cano, Z., Bersier, D., Guidorzi, C., et al. 2011, MNRAS, 413, 669
- Christodoulou & Ruffini (1971) Christodoulou, D., & Ruffini, R. 1971, Phys. Rev. D, 4, 3552
- Damour & Ruffini (1975) Damour, T., & Ruffini, R. 1975, Physical Review Letters, 35, 463
- Della Valle (2011) Della Valle, M. 2011, International Journal of Modern Physics D, 20, 1745
- Djorgovski et al. (2001) Djorgovski, S. G., Frail, D. A., Kulkarni, S. R., et al. 2001, ApJ, 562, 654
- Filippenko et al. (1997) Filippenko, A. V., Stern, D., Treffers, R. R., et al. 1997, IAU Circ., 6729, 1
- Ghirlanda et al. (2008) Ghirlanda, G., Nava, L., Ghisellini, G., Firmani, C., & Cabrera, J. I. 2008, MNRAS, 387, 319
- Groot et al. (1998) Groot, P. J., Galama, T. J., van Paradijs, J., et al. 1998, ApJ, 493, L27
- Izzo et al. (2012) Izzo, L., Ruffini, R., Penacchioni, A. V., et al. 2012, ArXiv e-prints
- Marshall et al. (1997) Marshall, F. E., Cannizzo, J. K., & Corbet, R. H. D. 1997, IAU Circ., 6727, 1
- Meegan et al. (1992) Meegan, C. A., Fishman, G. J., Wilson, R. B., et al. 1992, Nature, 355, 143
- Mészáros (2002) Mészáros, P. 2002, ARA&A, 40, 137
- Murakami et al. (1997) Murakami, T., Ueda, Y., Yoshida, A., et al. 1997, IAU Circ., 6732, 1
- Negreiros et al. (2012) Negreiros, R., Ruffini, R., Bianco, C. L., & Rueda, J. A. 2012, A&A, 540, A12
- Patricelli et al. (2011) Patricelli, B., Bernardini, M. G., Bianco, C. L., et al. 2011, International Journal of Modern Physics D, 20, 1983
- Pe’er et al. (2007) Pe’er, A., Ryde, F., Wijers, R. A. M. J., Mészáros, P., & Rees, M. J. 2007, ApJ, 664, L1
- Penacchioni et al. (2012) Penacchioni, A. V., Ruffini, R., Izzo, L., et al. 2012, A&A, 538, A58
- Piro et al. (1999) Piro, L., Costa, E., Feroci, M., et al. 1999, ApJ, 514, L73
- Ruffini (2011) Ruffini, R. 2011, ArXiv e-prints
- Ruffini et al. (2005) Ruffini, R., Bernardini, M. G., Bianco, C. L., et al. 2005, in American Institute of Physics Conference Series, Vol. 782, XIth Brazilian School of Cosmology and Gravitation, ed. M. Novello & S. E. Perez Bergliaffa, 42
- Ruffini et al. (2001a) Ruffini, R., Bianco, C. L., Fraschetti, F., Xue, S., & Chardonnet, P. 2001a, ApJ, 555, L117
- Ruffini et al. (2001b) Ruffini, R., Bianco, C. L., Fraschetti, F., Xue, S.-S., & Chardonnet, P. 2001b, ApJ, 555, L107
- Ruffini et al. (2010) Ruffini, R., Chakrabarti, S. K., & Izzo, L. 2010, Submitted to Adv. Sp. Res.
- Ruffini et al. (2007) Ruffini, R., Bernardini, M. G., Bianco, C. L., et al. 2007, in ESA Special Publication, Vol. 622, ESA Special Publication, 561
- Ruffini (2001) Ruffini, R. J. 2001, Analogies, new paradigms and observational data as growing factors of Relativistic Astrophysics
- Schaefer (2007) Schaefer, B. E. 2007, ApJ, 660, 16
- Smith et al. (1997) Smith, D., Levine, A., Remillard, R., et al. 1997, IAU Circ., 6728, 1
- Vietri et al. (1999) Vietri, M., Perola, C., Piro, L., & Stella, L. 1999, MNRAS, 308, L29
- Yoshida et al. (2001) Yoshida, A., Namiki, M., Yonetoku, D., et al. 2001, ApJ, 557, L27