Analysis of the Early-Time Optical Spectra of SN 2011fe in M101
Abstract
The nearby Type Ia supernova SN 2011fe in M101 ( km s-1) provides a unique opportunity to study the early evolution of a “normal” Type Ia supernova, its compositional structure, and its elusive progenitor system. We present 18 high signal-to-noise spectra of SN 2011fe during its first month beginning 1.2 days post-explosion and with an average cadence of 1.8 days. This gives a clear picture of how various line-forming species are distributed within the outer layers of the ejecta, including that of unburned material (C+O). We follow the evolution of C II absorption features until they diminish near maximum light, showing overlapping regions of burned and unburned material between ejection velocities of 10,000 and 16,000 km s-1. This supports the notion that incomplete burning, in addition to progenitor scenarios, is a relevant source of spectroscopic diversity among SNe Ia. The observed evolution of the highly Doppler-shifted O I absorption features detected within five days post-explosion indicate the presence of O I with expansion velocities from 11,500 to 21,000 km s-1. The fact that some O I is present above C II suggests that SN 2011fe may have had an appreciable amount of unburned oxygen within the outer layers of the ejecta.
Subject headings:
supernovae: general supernovae: individual (SN 2011fe)1. Introduction
SN 2011fe in M101 is the closest (6.9 Mpc) Type Ia supernova (SN Ia) in 25 years. It was discovered only 11 hours after explosion, the earliest of any SN Ia (Nugent et al., 2011) and has revealed more about its progenitor than any other recent SN Ia. In the canonical picture of a SN Ia, a CO white dwarf (WD) gains mass until it approaches the Chandrasekhar mass, either by mass transfer from a nondegenerate companion, or by merging with another WD (for a review, see Howell 2011).
The merger of two WDs has been strongly suspected in the case of “super-Chandra” SNe Ia, those that are so luminous they appear to require a progenitor above the Chandrasekhar mass (Howell et al., 2006; Scalzo et al., 2010). Unlike most SN Ia, these subtypes are known for showing conspicuous and relatively long-lasting spectroscopic signatures of carbon in their outer layers, possibly left over from the violent CO-WD merger (Silverman et al., 2011). But this scenario cannot explain all SNe Ia as some show narrow lines of sodium from circumstellar material (CSM), thought to be from a nondegenerate secondary star in a single-degenerate system (Dilday 2012 and references therein). Sternberg et al. (2011) estimate that at least 20% of SNe Ia in spiral galaxies arise from this channel. Furthermore, it remains to be seen if circumstellar sodium is concurrent with carbon detections. Could abundance studies of carbon lines reveal the progenitor system?
With SN 2011fe, it was confirmed observationally for the first time that the exploding star was a WD (Nugent et al., 2011; Bloom et al., 2012). Pre-explosion Hubble Space Telescope images revealed that any secondary star could not be a luminous red giant (Li et al., 2011). Furthermore, the lack of an observed shock, expected when the ejecta hits any nondegenerate secondary (Kasen, 2010), suggests that the secondary could not be a red giant (Nugent et al., 2011), and probably not any nondegenerate star (Bloom et al., 2012). Nondetections of radio and X-ray emission place strong limits on the amount of CSM, disfavoring most single-degenerate hypotheses, but consistent with the merger of two WD stars (Horesh et al., 2012; Chomiuk et al., 2012; Margutti et al., 2012).
In addition, thorough and complete spectroscopic observations of SN 2011fe offer a chance to study the distribution of ejected material. For instance, as many as a third of SNe Ia show evidence of unburned material if spectra are obtained early enough (Parrent et al., 2011; Thomas et al., 2011a; Folatelli et al., 2012; Silverman & Filippenko, 2012; Blondin et al., 2012). Carbon features may not always, if at all, be the signature of a merger (Scalzo et al., 2010), but rather signal some difference in the explosion physics of the primary WD (Baron et al., 2003; Thomas et al., 2007). Abundance studies of unburned material can be coupled with constraints on material that is synthesized in the explosion, as some explosion models predict the complete burning of the WD, leaving no unburned carbon (Kasen et al., 2009; Maeda et al., 2010b).
To investigate these questions it is necessary to combine our limited progenitor knowledge with a map of the elemental distribution of ejected material in SNe, including unburned material. Here we present 18 high signal-to-noise (S/N) optical spectra of SN 2011fe during its first month, starting one day after explosion. We fit all spectra with the automated spectrum synthesis code, SYNAPPS242424Derived from SYNOW, see Branch et al. (2005) and Thomas et al. (2011b)., to trace the compositional structure of the ejected material.
2. Observations
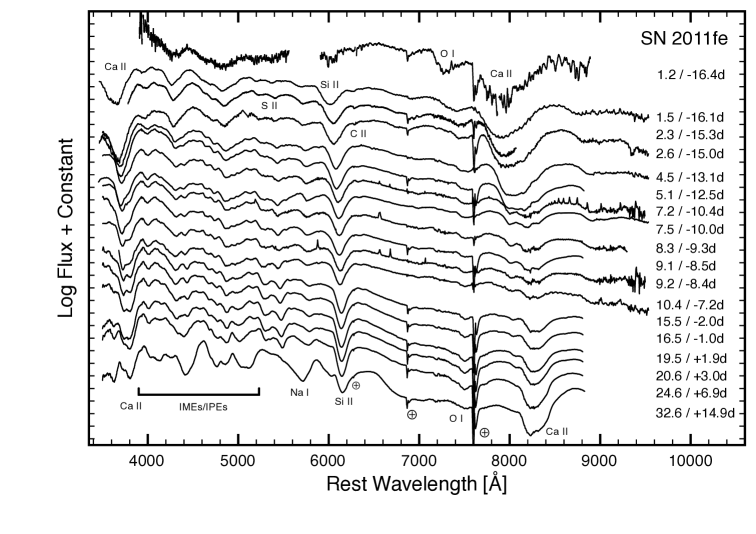
On 2011 August 24.167 (UT dates are used throughout this Letter), the Palomar Transient Factory (PTF) discovered SN 2011fe in M101. The SN was discovered early enough that the time of explosion, , could be estimated to within minutes of 2011 August 23.69 (Nugent et al., 2011). The SN reached a -band peak brightness on September 10.3 (Bianco in preparation). Optical spectra were obtained on eight different telescopes (Table 1, Figure 1). Reductions were done with IRAF252525IRAF is distributed by the National Optical Astronomy Observatory, which is operated by the Association of Universities for Research in Astronomy, Inc., under cooperative agreement with the National Science Foundation (NSF)..
3. Spectroscopic Analysis
From the onset, the spectroscopic features of SN 2011fe appear broad and comprised of P-Cygni absorption/emission profiles of intermediate-mass elements (IMEs) and iron-peak elements (IPEs) typically seen in supernova spectra (Branch & Patchett, 1973; Filippenko, 1997). Over time the features narrow, depicting an evolution similar to “normal” subtype objects. Most notably the spectra exhibit: (1) high velocity features (HVFs; 16,000 km s-1) of Si II, Ca II and Fe II absorption lines from the onset of the explosion, (2) unburned material in the form of a C II 6578 absorption feature, and (3) O I 7774 at velocities higher than previously detected for a SN Ia (Nugent et al., 2011). From the lack of conspicuous Ti II/Fe III absorption features sometimes observed in sub- and over-luminous SNe Ia, respectively, as well as the slowly decreasing blueshift of the Si II 6150 Å feature, our spectroscopic observations of SN 2011fe in Figure 1 are consistent with characteristics of a “low velocity gradient”/“core normal” subtype (see Blondin et al. 2012 and references therein).
3.1. Line Identifications: SYNAPPS
Given that supernova expansion velocities are 104 km s-1, Doppler line blending can be an obstacle for mapping the underlying compositional structure. SYNAPPS is a useful tool for identifying line features in photospheric phase spectra through its empirical spectrum synthesis procedure which requires no a priori compositional structure as input. Under the assumption of pure-resonance line transfer and a sharp blackbody-emitting photosphere, an atomic line list is used to construct a basic spectrum from a pseudo-blackbody continuum level. The optical depth profile for a line is modeled as , where is the expansion velocity, is an arbitrary normalization velocity, is the e-folding velocity, and (Thomas et al., 2011b).
Because the sources of line formation influence nearly all regions of the spectrum from a wide range of depths within the ejecta, we model the spectrum approximately by treating the minimum reference velocity, , for every ion as a free parameter. For a given set of ions in a fit, we set the photospheric velocity, , equal to the lowest measured . This follows the notion that not all blended absorption minima coincide with the Doppler-shifted location of the photosphere over time (Bongard et al., 2008). Furthermore, we use a quadratic warping function to simplify the treatment of the continuum, calibration errors, and uncorrected reddening. Consequently, our fits are constrained by how we are able to best match absorption minima and the relative strengths of all features.
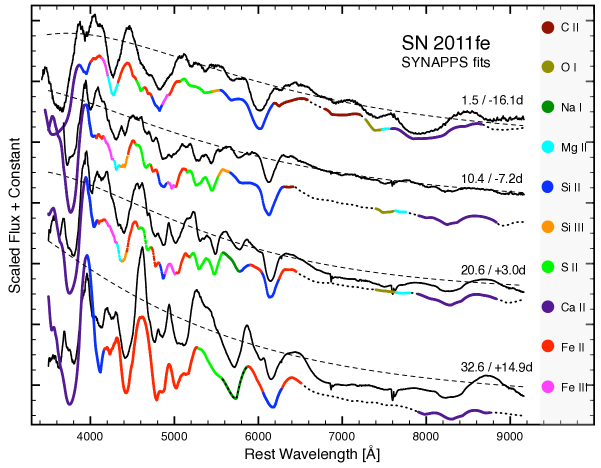
For the spectra in Figure 1, we converged a series of SYNAPPS fits. In Figure 2 we plot the spectra for the days 1.5, 10.4, 20.6 and 32.6 post-explosion, as they best document the relevant temporal changes on which we focus our attention. For each epoch, we compare our SYNAPPS fit and over-plot the continuum fit for reference. We have loosely highlighted various regions of the fits to indicate which parts of the data we use to infer, and thereby constrain, the presence of particular ions. For example, the two broad absorption features centered around 4300 and 4800 Å are complex blends of three or more ions. When we remove any one of these ions from the fit, we are unable to compensate for it with any reasonable perturbations of the remaining parameters. That is to say, while one or two ions may dominate it, the shape of a particular blended feature is still subject to the minor but observable influences of other species.
For the 1.5 day fit we set = 16,000 km s-1 and include photospheric components of C II, O I, Mg II, Si II, S II, Ca II, and Fe III. In addition, we include higher velocity components of O I, Si II, Ca II, and Fe II above 16,000 km s-1 in order to follow the evolution of the corresponding HVFs detected during the earliest observed epochs (Nugent et al., 2011). Overall, many of the features are accounted for in our subsequent fits, and the relative fluxes and respective minima match nicely.
Over the course of their detection, we model the Ca II HVFs as material “detached” 10,000 km s-1 above the photospheric line forming regions. It is clear when the Ca II HVFs disappear for SN 2011fe at 5 days after ; however, the same is not true for Si II. We model Si II as present in both photospheric and higher velocity regions, despite the separation of 2000 km s-1 near maximum light. It is sometimes clear that the 6150 Å feature requires two distinctly separate components of Si II for a best fit (most notably SN 2009ig; see Foley et al. 2012). Recently however, Smith et al. (2011) presented spectropolarimetry of SN 2011fe showing two Si II absorption line polarizations at 7300 and 12,000 km s-1 just after maximum light (see their Figure 3). During this phase our two components of Si II are at 8000 and 11,000 km s-1. While the overlap is not exact, the finding of a two-component Si II feature is consistent with the spectropolarimetry.
The set of ions mentioned above is primarily the same used until maximum light, at which point Na I, S II, and Fe II begin to account best for most of the features. For SN 2011fe, while using only SYNAPPS, we cannot definitively infer the presence of ions such as cobalt and nickel from the first month of optical observations alone, i.e., species responsible for powering SN Ia lightcurves (Colgate & McKee, 1969). However, early-phase broadband photometry, as well as spectroscopic analyses of infrared data, could help in this regard (Marion et al., 2009; Piro, 2012).
3.2. Spectroscopic Modeling: SYNAPPS
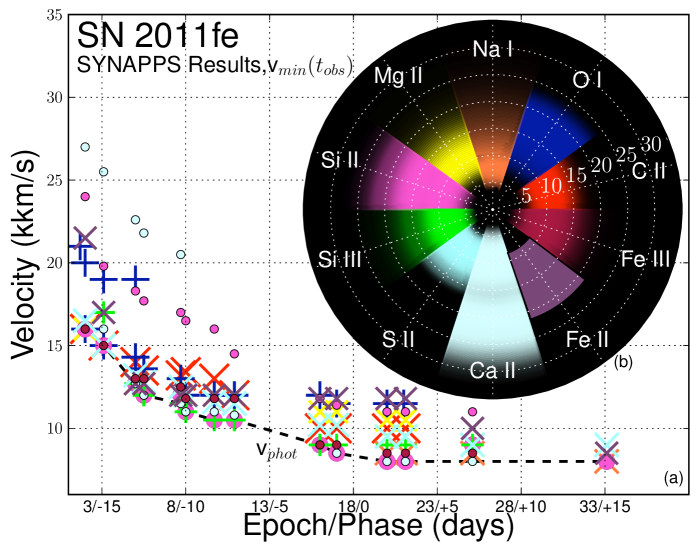
The result of any series of SYNAPPS fits is the estimation of velocities spanned by a particular set of ions. Therefore, we can use spectra in two different ways, as seen in Figure 3. From our time-series fits, in Figure 3(a) we show our estimates for each of the proposed ions in §3.1. A clear separation between outer and inner regions of ejected material can be seen. The material near photospheric velocities that span roughly km s-1 includes Na I, C II, O I, Mg II, Si II, S II, Ca II, and Fe III, whereas most of the higher velocity material between 16,000 and 30,000 km s-1 is comprised of O I, Ca II, Si II, and Fe II.
Since we treat as a free parameter, there is some dispersion among ions near the modeled photosphere for a given epoch (black dashed line in Figure 3(a)). However, SYNAPPS fits are generally good to within 250 km s-1 and the scatter of our inferred is no less than 500 km s-1. Therefore we consider the dispersion consistent with what should be expected in an environment of multiple line forming regions.
When we take into account the Doppler-widths of our fits, we are able to place tighter constraints on the location of species by constructing a velocity-scaled map that traces how far each ion extends. In Figure 3(b) we plot a single normalized absorption profile for each ion, summed over the first month. Clearly, a photospheric and higher velocity region can be seen. In addition, Figure 3(b) yields some insight into where species are likely to be present, with respect to one another, throughout the ejecta. This is particularly important for investigating unburned material since its location with respect to burned material can be used to constrain the details of the explosion nucleosynthesis.
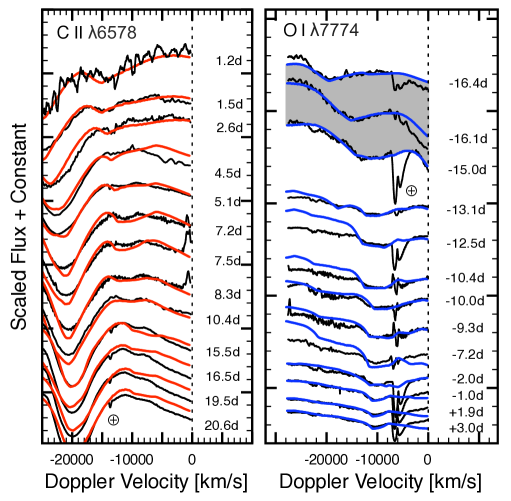
Figure 4 highlights regions of interest for tracing unburned material with C II 6578 and potentially O I 7774 (see also Figure 3). For our C II fits, we are able to follow the suspected absorption feature as it evolves across the emission component of the Si II 6355 line over time. This implies that unburned carbon is present at least between 10,000 and 16,000 km s-1. Our O I fits in Figure 4 require both photospheric and higher velocity components of O I for the 1.2, 1.5, 2.6 and 4.5 day spectra as the O I HVF disappears quickly and within 5 days after . Within the time-frame of our observations, C II 6578 is present from 1.5 to 20.6 days after , i.e., from the onset and until at least maximum light. The same is true for O I; however we find that O I initially extends at least 5000 km s-1 above C II, within the outermost layers. This suggests the O I detected during the earliest epochs is likely to be unburned progenitor material rather than a product of carbon burning in the SN.
4. Discussion & Conclusions
Thanks to the proximity of SN 2011fe, we have been able to obtain frequent high S/N spectra and use SYNAPPS to produce what may be the best-ever map of the material distribution in a “normal” SN Ia for the first month of its evolution. For SN 2011fe, it is important to note that, apart from differences in relative expansion velocities (Figure 3(a)), the spectra do not vary significantly from one epoch to another. Furthermore, as in most SNe Ia, in SN 2011fe we find O I, Mg II, Si II, S II, Ca II, and Fe II present from 16,000 km s-1 or more down to about 7000 km s-1 (later spectra will probe deeper). This implies similar compositional constituents over a large region of ejected material and is supported by our SYNAPPS fitting results (Figure 3(b)).
Stretching to nearly 30,000 km s-1, high velocity regions of silicon and calcium are inferred from pre-maximum light spectra. A region of sodium is inferred to be present at high velocities as well, but is detected post-maximum light when the outer layers begin to cool. However, rather than large-scale asymmetries, as predicted by Maeda et al. (2010a), these high velocity features may trace only a small amount of material, as little as in the case of Ca II (Hatano et al., 1999; Mazzali et al., 2005; Tanaka et al., 2008). Such a small inferred Ca mass supports the notion that strong features in SN spectra do not always correspond to large masses of line-forming ejecta.
We also find Si III and Fe III present at early times (before 3 days after maximum light), indicating that some parts of the ejecta achieved high temperatures, although the entire photosphere was not excessively hot. Even a day after explosion the spectra were not particularly blue, nor were they dominated by high-ionization species. Various scenarios that predict an early shock from interaction with a nondegenerate secondary star (Kasen, 2010), a torus of material from a disrupted secondary (Scalzo et al., 2010), or CSM, are not supported by the data. This is consistent with a lack of radio and X-ray detections (Horesh et al., 2012; Chomiuk et al., 2012; Margutti et al., 2012), although the spectra here start a day earlier, providing additional constraints.
Regarding unburned material, other SNe Ia show distributions of unburned carbon spanning a range of velocities. This suggests that carbon in some SNe Ia arises from incomplete burning, in contrast to the predictions of some delayed detonation models and merger scenarios (Marion et al., 2009; Fryer et al., 2010; Röpke et al., 2012). In general, due to the rarity of early SN Ia observations, little is certain about the conditions under which carbon is observable in all subtypes. Noise makes weak carbon lines difficult to detect, especially when supernovae are faint at early times, and different velocities cause it to be blended with other features. Furthermore, SN Ia subtypes have different temperatures (Nugent et al., 1995), and these change with time, affecting whether carbon signatures exists as C I, C II, or C III. Thus carbon may be fairly common in SNe Ia, but only apparent if spectra are obtained early (Parrent et al., 2011; Thomas et al., 2011a; Folatelli et al., 2012; Silverman & Filippenko, 2012; Blondin et al., 2012). In addition, asymmetry may play a part in whether carbon is detected given that both explosive burning and WD mergers are inherently asymmetric processes (Livio & Pringle, 2011; Pakmor et al., 2012). Spectropolarimetry and late-time observations, which are only possible for bright, nearby SNe like SN 2011fe, can shed light on these links.
For the carbon in SN 2011fe, we find C II to be strongest in the earliest spectra, suggesting it is mostly concentrated in the outer layers. The C II 6578 detection persists until just before maximum light, although at later times it is very weak and would have been missed in any but the highest S/N spectra. Note, however, its presence throughout regions of freshly synthesized material shows that it is indeed distributed within the ejecta and is not just concentrated within the outermost layers. Because the high velocity O I is located above the outermost reaches of the C II, it is likely unburned progenitor material (Nugent et al., 2011).
For the purposes of investigating spectroscopic diversity, it is convenient that SN 2011fe exhibits the characteristic signatures of a “normal” SN Ia. Future comparative studies of SNe Ia will benefit from these results and that of other well observed objects. The map of elements in SN 2011fe can now be used as input for model atmosphere codes, such as PHOENIX (see Hauschildt & Baron 1999 and references therein), enabling us to better determine abundances, test theories of the explosion physics, and perhaps gain further insight into progenitor scenarios.
References
- Baron et al. (2003) Baron, E., Lentz, E. J., & Hauschildt, P. H. 2003, ApJ, 588, L29
- Bianco (in preparation) Bianco, F. in preparation, ApJ
- Blondin et al. (2012) Blondin, S., Matheson, T., Kirshner, R. P., et al. 2012, AJ, 143, 126
- Bloom et al. (2012) Bloom, J. S., Kasen, D., Shen, K. J., et al. 2012, ApJ, 744, L17
- Bongard et al. (2008) Bongard, S., Baron, E., Smadja, G., Branch, D., & Hauschildt, P. H. 2008, ApJ, 687, 456
- Branch et al. (2005) Branch, D., Baron, E., Hall, N., Melakayil, M., & Parrent, J. 2005, PASP, 117, 545
- Branch & Patchett (1973) Branch, D., & Patchett, B. 1973, MNRAS, 161, 71
- Chomiuk et al. (2012) Chomiuk, L., Soderberg, A. M., Moe, M., et al. 2012, ApJ, 750, 164
- Colgate & McKee (1969) Colgate, S. A., & McKee, C. 1969, ApJ, 157, 623
- Dilday (2012) Dilday, B. 2012, Nature
- Filippenko (1997) Filippenko, A. V. 1997, ARA&A, 35, 309
- Folatelli et al. (2012) Folatelli, G., Phillips, M. M., Morrell, N., et al. 2012, ApJ, 745, 74
- Foley et al. (2012) Foley, R. J., Challis, P. J., Filippenko, A. V., et al. 2012, ApJ, 744, 38
- Fryer et al. (2010) Fryer, C. L., Ruiter, A. J., Belczynski, K., et al. 2010, ApJ, 725, 296
- Hatano et al. (1999) Hatano, K., Branch, D., Fisher, A., Millard, J., & Baron, E. 1999, ApJS, 121, 233
- Hauschildt & Baron (1999) Hauschildt, P. H., & Baron, E. 1999, J. Comput. Appl. Math., 109, 41
- Horesh et al. (2012) Horesh, A., Kulkarni, S. R., Fox, D. B., et al. 2012, ApJ, 746, 21
- Howell (2011) Howell, D. A. 2011, Nature Communications, 2
- Howell et al. (2006) Howell, D. A., Sullivan, M., Nugent, P. E., et al. 2006, Nature, 443, 308
- Kasen (2010) Kasen, D. 2010, ApJ, 708, 1025
- Kasen et al. (2009) Kasen, D., Röpke, F. K., & Woosley, S. E. 2009, Nature, 460, 869
- Li et al. (2011) Li, W., Bloom, J. S., Podsiadlowski, P., et al. 2011, Nature, 480, 348
- Livio & Pringle (2011) Livio, M., & Pringle, J. E. 2011, ApJ, 740, L18
- Maeda et al. (2010a) Maeda, K., Benetti, S., Stritzinger, M., et al. 2010a, Nature, 466, 82
- Maeda et al. (2010b) Maeda, K., Röpke, F. K., Fink, M., et al. 2010b, ApJ, 712, 624
- Margutti et al. (2012) Margutti, R., Soderberg, A. M., Chomiuk, L., et al. 2012, ApJ, 751, 134
- Marion et al. (2009) Marion, G. H., Höflich, P., Gerardy, C. L., et al. 2009, AJ, 138, 727
- Mazzali et al. (2005) Mazzali, P. A., Benetti, S., Altavilla, G., et al. 2005, ApJ, 623, L37
- Nugent et al. (1995) Nugent, P., Phillips, M., Baron, E., Branch, D., & Hauschildt, P. 1995, ApJ, 455, L147
- Nugent et al. (2011) Nugent, P. E., Sullivan, M., Cenko, S. B., et al. 2011, Nature, 480, 344
- Pakmor et al. (2012) Pakmor, R., Kromer, M., Taubenberger, S., et al. 2012, ApJ, 747, L10
- Parrent et al. (2011) Parrent, J. T., Thomas, R. C., Fesen, R. A., et al. 2011, ApJ, 732, 30
- Piro (2012) Piro, A. L. 2012, arXiv:1201.5398
- Röpke et al. (2012) Röpke, F. K., Kromer, M., Seitenzahl, I. R., et al. 2012, ApJ, 750, L19
- Scalzo et al. (2010) Scalzo, R. A., Aldering, G., Antilogus, P., et al. 2010, ApJ, 713, 1073
- Silverman et al. (2011) Silverman, J. M., Ganeshalingam, M., Li, W., et al. 2011, MNRAS, 410, 585
- Silverman & Filippenko (2012) Silverman, J. M., & Filippenko, A. V. 2012, arXiv:1202.3788
- Smith et al. (2011) Smith, P. S., Williams, G. G., Smith, N., et al. 2011, arXiv:1111.6626
- Sternberg et al. (2011) Sternberg, A., Gal-Yam, A., Simon, J. D., et al. 2011, Science, 333, 856
- Tanaka et al. (2008) Tanaka, M., Mazzali, P. A., Benetti, S., et al. 2008, ApJ, 677, 448
- Thomas et al. (2007) Thomas, R. C., Aldering, G., Antilogus, P., et al. 2007, ApJ, 654, L53
- Thomas et al. (2011a) Thomas, R. C., Aldering, G., Antilogus, P., et al. 2011a, ApJ, 743, 27
- Thomas et al. (2011b) Thomas, R. C., Nugent, P. E., & Meza, J. C. 2011b, PASP, 123, 237
[b] UT MJD Epochaafootnotemark: Phasebbfootnotemark: Telescope Exp. Time Range Date 55,000 days days + Instrument (s) (Å) 2011 Aug 24 797.86 1.2 16.4 LT+FRODOSpec 1800 3900 9000$\dagger$$\dagger$footnotemark: 2011 Aug 25 798.16 1.5 16.1 Lick3-m+Kast 1200 3420 10290$\dagger$$\dagger$footnotemark: 2011 Aug 25 798.95 2.3 15.3 TNG+DOLORES 300 3780 8070 2011 Aug 26 799.26 2.6 15.0 UH88+SNIFS 300 3300 9700 2011 Aug 28 801.19 4.5 13.1 P200+DBSP 120 3300 10000 2011 Aug 29 801.74 5.1 12.5 GN+GMOS 120(4) 3500 9700 2011 Aug 30 803.86 7.2 10.4 WHT+ISIS 60(2) 3500 9500 2011 Aug 31 804.23 7.5 10.0 Keck1+LRIS 45 3050 10200 2011 Aug 31 804.94 8.3 9.3 WHT+ISIS 60(2) 3500 9300 2011 Sep 1 805.75 9.1 8.5 GN+GMOS 60(2) 3500 9700 2011 Sep 1 805.90 9.2 8.4 WHT+ISIS 120 3500 9300 2011 Sep 3 807.13 10.4 7.2 P200+DBSP 120 3680 9700 2011 Sep 8 812.23 15.5 2.0 GN+GMOS 60(2) 3500 9700 2011 Sep 9 813.23 16.5 1.0 GN+GMOS 60(2) 3500 9700 2011 Sep 12 816.22 19.5 +1.9 GN+GMOS 60(2) 3500 9700 2011 Sep 13 817.27 20.6 +3.0 GN+GMOS 60(2) 3500 9700 2011 Sep 17 821.27 24.6 +6.9 GN+GMOS 60(2) 3500 9700 2011 Sep 25 829.27 32.6 +14.9 GN+GMOS 60(2) 3500 9700
-
a
Relative to an estimated explosion JD of 2,455,797.187 0.014 (Nugent et al., 2011).
-
b
Relative to an estimated Mb,max JD of 2,455,814.28 0.02 (Bianco in preparation).
-
Spectra presented in Nugent et al. 2011.