Interlinkages and structural changes in cross-border liabilities: a network approach
Abstract
We study the international interbank market through a geometrical and a topological analysis of empirical data. The geometrical analysis of the time series of cross-country liabilities shows that the systematic information of the interbank international market is contained in a space of small dimension, from which a topological characterization could be conveniently carried out. Weighted and complete networks of financial linkages across countries are developed, for which continuous clustering, degree centrality and closeness centrality are computed. The behavior of these topological coefficients reveals an important modification acting in the financial linkages in the period 1997-2011. Here we show that, besides the generalized clustering increase, there is a persistent increment in the degree of connectivity and in the closeness centrality of some countries. These countries seem to correspond to critical locations where tax policies might provide opportunities to shift debts. Such critical locations highlight the role that specific countries play in the network structure and helps to situates the turbulent period that has been characterizing the global financial system since the Summer 2007 as the counterpart of a larger structural change going on for a more than one decade.
Keywords: Cross-border exposures, interbank networks, financial
linkages, debt shifting
Corresponding author: tanya@iseg.utl.pt
1 Introduction
Globalization of economies leads to an ever-increasing interdependence of countries. The late-2000s financial crisis - considered by many economists to be the worst financial crisis since the Great Depression - resulted in the collapse of large financial institutions, the bailout of banks by national governments and downturns in stock markets around the world. Such a large set of outcomes has stressed the need of understanding financial systems as networks of countries where cross-border financial linkages play the fundamental role.
While some authors have investigated the role globalization plays in shaping the spread of financial crisis [20],[1], studies on the consequences of financial crises to the international banking system are less prominent. As we recently argued [21], the adoption of an evolving network approach is recommended not only because of the proper emphasis on the financial interdependencies but also due to the possibility of describing how the structure of these interdependencies evolves in time. In so doing, we are able to address the role that an existing network structure plays in the spread of shocks and conversely, the effectiveness of stress events and their impact on the structure of the network of cross-border interdependencies.
During the last years, several authors have approached financial systems through a network approach. Some papers have favored the study of interdependencies between credit banks [13], or focused on the analysis of shocks storming the financial systems of several countries [10]. The topological properties of some national interbank markets have been studied by Soramaky and co-authors [19], who analyzed the network topology of the interbank payments transferred between commercial banks by the Fedwire Funds Services. Another example is the work of Fuijwara [7] exploring the credit relationships that exist between commercial banks and large companies in Japan.
Empirical studies have also been carried out on some European national interbank markets ([16],[5]) throughout the analysis of the topological properties of the networks of Italian and Austrian banks.
Using the Bank of international settlements (BIS) data set, some papers have addressed the evolution of networks of bank transfers ([5], [8], [7], [13], [17] ). It is evident from the work of McGuire [17] that the international banking system has become an important conduit for the transfer of capital across countries. The work of Minoiu [18] also explored the proprieties of the global banking networks; for several networked systems, he found evidence of important structural changes follow on the occurrence of stress events.
Nevertheless, yet few papers have addressed the impact of the recent financial crises in the international banking system from a topological point of view.
Topological coefficients have been the object of growing attention ever since some network regimes were identified as the underlying structures of important phenomena found in many different fields.
Stock market crises were characterized in the past through a geometrical and a topological analysis of the time series of stock returns. It implied that the most of the systematic information of the financial markets was contained in a space of small dimension ([23],[2],[3],[4]) from which both geometrical and topological characterizations could be carried out.
In the present paper, we explore an equivalent low-dimensional space to find out the topological signature of networks of financial linkages across countries. The networks are built from time series of interbank liabilities conducted through the international banking system along the last 28 years.
From the geometrical setting, the behavior of the low-dimensional spaces highlights an important modification acting in the financial linkages in the period 1997-2011, and situates the turbulent period that has been characterizing the global financial system since the Summer 2007 as the counterpart of a larger structural change going on for more than one decade.
From the topological perspective, our results reveal an important increase in the coefficient of clustering since 2006. They also show that the most connected countries (largest degrees) are typically not the ones with the largest closeness centrality. This is observed in different time periods, allowing to identify some structural patterns that emerge from the evolution of the network of country debts.
Here, we identify the chronological chain of countries with the highest closeness centrality and hypothesize that their critical locations in the network of countries are associated to low taxes policies, since they have been considered inward recipients of debt shifting, due to a lower effective taxation of foreign banks.
The paper is organized as follows: Section 2 briefly presents the set of empirical data and the methodology we work with. Section 3 is targeted at presenting the first results obtained from the application of a stochastic geometry technique. The main contributions of the paper are presented in Section 4, where a network approach is used to analyze the structural changes in the cross-border liabilities across countries along the last 28 years. The paper ends with appropriate conclusions.
2 Data and Methodology
The Bank for International Settlements (BIS) locational banking statistics (IBLR) - including international claims and liabilities of reporting banks by country of residence - provides a plentiful data set of aggregate cross-border exposures for a set of reporting and non-reporting countries all over the world. These statistics were originally introduced in 1964 to monitor the development of euro-currency markets, starting to be available in 1977 111The statistics prior to 1983 include just fifteen countries.. The locational reporting system collects quarterly data on the gross international financial claims and liabilities of banks resident in a given country. The main purpose of the statistics is to provide information on the role of banks and financial centers in the intermediation of international capital flows.
Since the BIS locational banking statistics capture the net flows of financial capital between any two countries channeled through the banking system [17] this data set is an appropriate source to the empirical study of temporal patterns arising from financial linkages across countries.
The locational statistics are intended to complement monetary and credit aggregates, being consistent with both the national balances of payments and the systems of national accounts. For a set of 57 reporting countries and aggregate zones, we considered a subset of 24 countries (see Table 1), each of them represented by the amounts of its liabilities vis-a-vis the other reporting countries, measured on a quarterly basis, from the last quarter of 1983 (Q4-1983) to the third quarter of 2011 (Q3-2011).
| AT: Austria | IT: Italy |
|---|---|
| BS: Bahamas | JP: Japan |
| BH: Bahrain | LU: Luxemburg |
| BE: Belgium | NL: Netherlands |
| CA: Canada | AN: Netherlands Antilles |
| KY: Cayman Islands | NO: Norway |
| DK: Denmark | SG: Singapore |
| FI: Finland | ES: Spain |
| FR: France | SE: Sweden |
| DE: Germany | CH: Switzerland |
| HK: Hong Kong | GB: United Kingdom |
| IE: Ireland | US: United States |
Table 1: Reporting Countries
2.1 The Method
Cross-correlation based distances, as applied in reference [14] to the study of stock market structures have been used in the analysis and reconstruction of geometric spaces in many different fields ([23], [3], [4]). The quantity
| (1) |
where is the correlation coefficient of two time series and computed along a given time window
| (2) |
has been shown [15] to satisfy all the metric axioms. Therefore, it may be used to develop a geometrical analysis of the interbank market structure. To this end, we applied the following technique.
2.2 The Stochastic Geometry Technique
Using the BIS quarterly based time series of liabilities of each country () vis-a-vis the other reporting countries, we define a normalized vector
| (3) |
being the number of components (number of time labels) in the vectors . With this vector one defines the distance between the countries and by the Euclidean distance of the normalized vectors,
| (4) |
where is the correlation coefficient of the liabilities and , respectively of countries and computed along a time window of (quarterly) observations.
Having computed the matrix of distances for the set of reporting countries, one obtains coordinates in compatible with these distances and the countries can now be represented by a set of points in . Then, the center of mass and the center of mass coordinates are calculated.
The covariance distance matrix
| (5) |
is diagonalized to obtain the set of eigenvalues and normalized eigenvectors {}. The eigenvectors define the characteristic directions of this geometric space. Their coordinates along these directions are obtained by projection
| (6) |
The same analysis is performed for random and time permuted data and the relative behavior of the eigenvalues is compared.
The characteristic directions correspond to the eigenvalues that are clearly different from those obtained from surrogate data. They define a subspace of dimension which contains the systemic information related the interbank market structure.
Having found the number of characteristic dimensions () we are able to denote by the restriction of the country to the subspace and by the distances between countries and restricted to this low-dimensional space.
3 First Results
Our study starts with the application of the stochastic geometry technique to the time series of interbank liabilities. Each time series corresponds to one reporting country and provides quarterly observations over 28 years, from the last quarter of 1983 to the third quarter of 2011.
3.1 The Dimensional Reduction
Having carried out this analysis for the 24 reporting countries over the 28 years we concluded that the systematic information related to the interbank market structure is contained in a reduced subspace of just three dimensions, meaning that the number of characteristic dimensions of this subspace is three ().
Figure 1(a) shows the ordered eigenvalue distributions of actual () and random () data. From the difference between the decay of actual and random (time-permuted) eigenvalues we conclude that the first three dimensions capture the structure of the deterministic correlations and economic trends that are driving the cross-border financial system, whereas the remainder of the space may be considered as being generated by random fluctuations.
Eigenvalues from the 4th to the 23th have a quite similar behavior in both actual and time-permuted cases, showing that for this cross-border system the three largest dimensions define our empirically constructed variables.
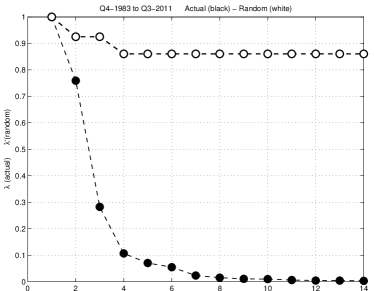
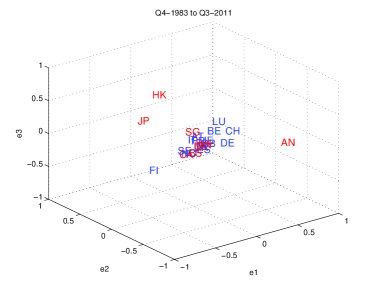
Figure 1(b) shows the projections () of the 24 countries along the first three eigenvectors obtained from the entire 28-years actual data ( and quarters), over the period 1983-2011. Different colors are used to identify European (blue) and non-European (red) member states.
The 3-dimensional plot in Figure 1(b) shows that the most eccentric positions in the reduced subspace are occupied by countries outside the European Union (EU). Countries like Japan (JP), Hong Kong (HK) and the Netherlands Antilles (AN) are far away from all other countries, whereas a much greater centrality (and closeness) is characteristic of many EU countries. Notice that to be close to each other in the 3-dimensional space comes from positive and strong correlations between country debts. Conversely, the countries that split apart from the others have debt positions that are negatively (and strongly) correlated to the debt positions of the other countries. In this example and when the whole 28 years are considered, Finland (FI), Japan (JP), the Netherlands Antilles (AN) and Hong Kong (HK) are strongly and negatively correlated to the great majority of reporting countries.
To have a qualitative idea concerning the structure of the characteristic dimensions, we have divided the data in two chronologically successive batches and performed the same operations. The subplots in Figure 2 show the reduced subspaces associated to the three largest eigenvalues obtained over the 14-years periods 1983-1997 and 1997-2011.
Apart from statistical fluctuations, the reconstructed sub-spaces in Figure 2 show a reasonable degree of stability. The ordering of the largest eigenvalues changes in time although the overall distribution remains approximately the same. These ordering change may have an economic meaning and be related to the relative importance and stability of groups of countries in different periods.
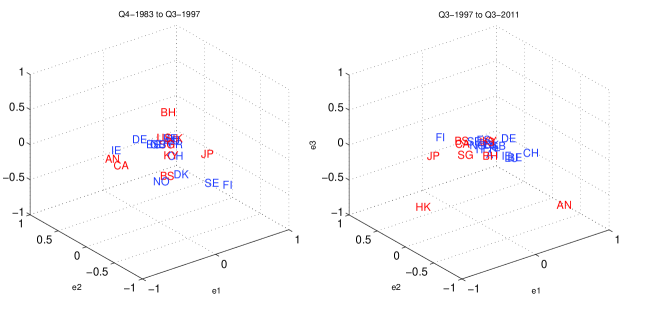
Although stable, the geometrical spaces in Figure 2 show that there are some important differences in the interbank market of those different time periods. The main difference seems to rely on the clustering trend that characterizes the 1997-2011 geometrical space, where the distances between countries seem to be shortened; except for the few examples of the Netherlands Antilles (AN) and Hong Kong (HK) that like in the subplot presented in Figure 1(b) remain far from almost all other countries.
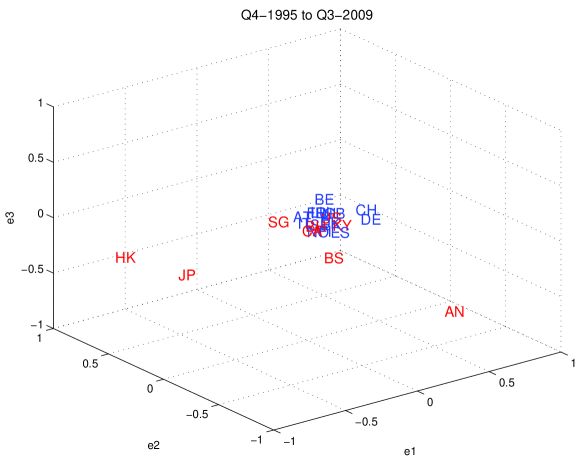
To better investigate the shortening of the distances between countries that may occur in different historical periods, the plot in Figure 3 provides the geometrical space of another 14-years period, from 1995 to 2009. Again, closeness among the European countries seems to be stronger. What is interesting, however, is the contraction of volume that characterizes the reduced subspace presented in Figure 3. It shall be noticed that this is the first 14-years interval that includes the failure of the Lehman Brothers and the recent turmoil in the international banking sector.
3.2 The Space Volume
The observation of the plots presented in Figures 2 and 3 shows that a generalized shortening of most of the distances leads to a contraction effect in the volume of the 3-dimensional space. To capture the extent of a contraction (or expansion) effect, we take the largest 3 eigenvalues that define the effective dimension of the market space and compute its volume () as
| (7) |
This measure is used throughout this paper as a reference for the identification of the abnormal periods. As the plot in Figure 3 clearly indicates, clustering emerges together with a contraction effect in the shape of the reduced space. Such a contraction effect is registered as a lower value of . It so happens that, when the geometrical spaces are built from cross-correlation based distances (Eq.1), expanded volumes correspond to business as usual periods while contractions have been associated to the occurrence of economic crises ([3],[4]).
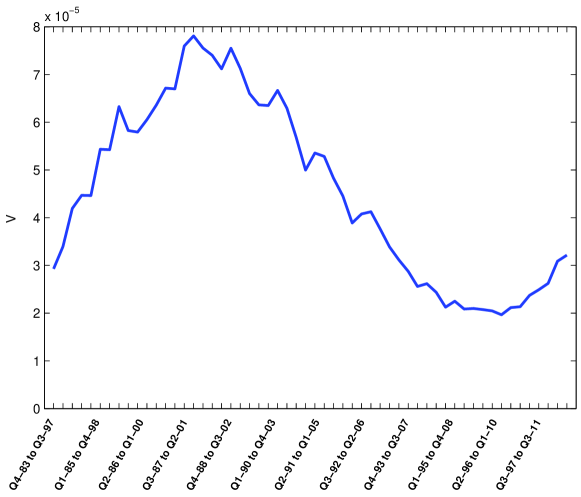
Figure 4 shows the behavior of along the 28 years. At each time interval (), is computed from the distances measured over a moving window of length 56 (14 years). The choice of such a wide window ensures statistical robustness and allows for capturing the main differences in the behavior of when the latest nineties start to be taken into account.
The lowest values in the evolution of for the period under consideration correspond to the 14-years slot Q2-1996 to Q1-2010. Figure 4 also shows that the highest values of correspond to the time slot Q3-1987 to Q2-2001. After that and up to 2010, one observes a persistent decreasing trend in the values of and a contraction effect in the corresponding 3-dimensional spaces.
The evolution of confirms our previous results, identifying the major changes in the 28-years period and highlighting the relevance of the recent economic crises.
It shall be noticed that after 2009, the value of starts to increase, meaning that a small recovery from the recent crises - translated into a return to the situation of business as usual - is taking place.
4 The Topological Perspective
In the previous section we have described the interbank market from a geometrical approach. Here, departing from this geometrical setting, our approach is driven by a topological perspective. Since the distances between countries are properly defined distances, it gives a meaning to topological tools in the study of the interbank market.
The first step in this direction concerns the definition of the fully-connected and weighted networks of 24 reporting countries. These networks are time-constrained since the strength of the links (their weights) between each pair of countries depends on how distant they are in the time-dependent 3-dimensional space.
4.1 Networks of Bilateral Exposures
Formally, countries and are linked by their bilateral exposure () computed as
| (8) |
where denotes the distance between countries and restricted to the 3-dimensional space and computed over a given time interval (). As usual, the inverse of the distance corresponds to the intensity (strength) of a link between the involved entities. Therefore, the bilateral exposure between each pair of countries, is given by the strength of the link that binds the two countries, which depends on how close they are in the 3-dimensional space.
4.1.1 Spatial Dimension
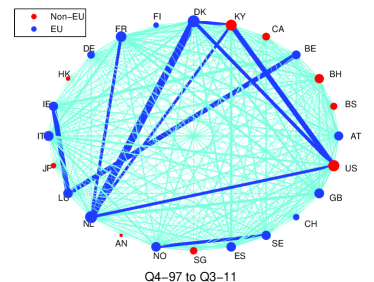
Taking the time interval of 110 quarters, from 1983 to 2011, we built the network of 24 reporting countries connected by their bilateral exposures, as the graphs in Figures 5 and 6 show. In the first graph, European countries are represented in blue nodes and non-EU countries are colored red. There, the size of a country () is given by its degree, i.e. by the total strength of the links () in which this country () participates. The width of the links are also proportional to their strength, being the 10 stronger links of the whole network colored blue while the remaining (weaker) links are colored cian. The graph in Figure 6 shows the corresponding network using the kamada-kawai layout 222Kamada-kawai is a graph-drawing algorithm that after assigning forces among the set of links and the set of nodes, pull them closer together or push them further apart depending on the forces assigned to both nodes and links.
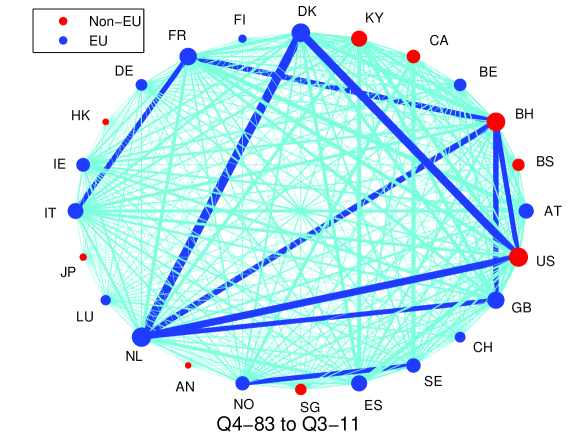
These two graphs provide complementary information on the way the countries are connected. The one in Figure 5 is aimed at emphasizing the heavily connected countries and the intensity of country links. However, unless one looks at the corresponding connections presented in the graph of Figure 6, one is unable to identify the critical roles that some countries play in the network structure. In this example, Figure 6 shows that when the 28-years period is considered, the topological signature of this set of interbank liabilities is characterized by the critical roles of Hong Kong (HK), Finland (FI), Japan (JP) and Netherlands Antilles (AN).
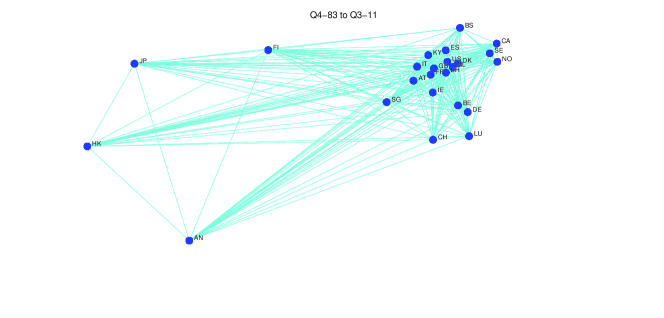
Figure 5 informs that the strongest links are those involving nine countries: United States (US), Denmark (DK), the Netherlands (NL), France (FR), Italy (IT), Bahrain (BH) and the United Kingdom (GB). Norway (NO) and Sweden (SE) are also among the strongly connected countries, although they seem to form a separate group.
Albeit less evident in Figure 5, the Netherlands (NL), the United States (US) and Bahrain (BH) hold the strongest four links. Despite the heavy contributions of the United States (US) and Bahrain (BH), European countries are, in general, those that display the strongest connections. Surprisingly, this property does not hold for either Germany (DE) or Switzerland (CH).
4.1.2 Temporal Dimension
A further possibility in analyzing cross-country exposures is to consider the time dimension of the data. The comparison of the data over time may reveal to which countries bilateral exposure has become significantly larger or smaller in specific time periods. Moreover, it might improve knowledge on the impact of the recent financial crises to the interbank market structure as a whole.
We proceed by developing, for specific time intervals of 56 quarters (14 years), the corresponding networks of country links. In so doing we are able to observe the evolution of some structural patterns that emerge from the dependencies between country debts over those time periods.
The observation of the graphs in Figure 7, where the periods 1983-1997 and 1997-2011 are represented, shows that the intensities of the links (the degree of the nodes) have been greatly reinforced in the time period going from 1997 to 2011, revealing that the amounts of liabilities between countries became more strongly correlated during this last period.
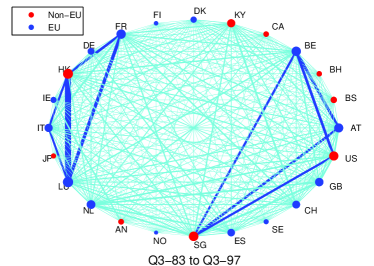
In the period 1983-1997 (l.h.s. in Figure 7) there are two separate sets of strongly connected countries: France (FR), Hong Kong (HK), Luxembourg (LU) and Italy (IT) in one side, and the United States (US), Belgium (BE), Singapore (SG) and Austria (AT) in the other. The link between Hong Kong (HK) and Luxemburg (LU) is the strongest one.
This situation undergoes a relevant change after 1997 (r.h.s. in Figure 7), there being now three groups of strongly connected countries. The biggest group comprises both EU and non EU countries: the United States (US), Denmark (DK), the Netherlands (NL), France (FR) and the Caiman Islands (KY). The second one is formed by Ireland (IE), Luxemburg (LU) and Belgium (BE). There is also the geographically-oriented group, formed by Norway (NO) and Sweden (SE). The Netherlands (NL) is the country reached by the stronger links, including its remarkable connection to Denmark (DK).
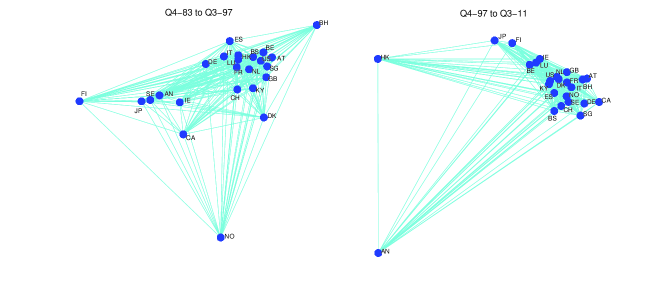
When we look at the kamada-kawai graphs corresponding to each time period (Figure 8), there is also a relevant change to be highlighted: the critical locations of Norway (NO) and Finland (FI) are now replaced by the one of the Netherlands Antilles (AN). Comparing the graphs in Figures 7 and 8, leads to the following summarizing remarks:
-
•
There is a generalized increase in the strength of the links (in the network degree) in 1997-2011.
-
•
There is also a corresponding increase in clustering, in the sense that the intensity of the links within the group of the strongly connected countries are stronger than those that link them to any other (weakly connected) country.
-
•
North EU countries (Norway and Finland) lost their critical positions, being replaced by Hong Kong and the Netherlands Antilles.
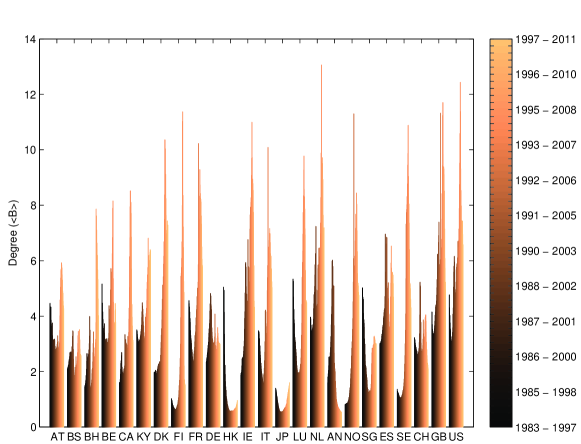
To give a quantitative idea of the evolution of the structure of the network of liabilities, we computed, for each country () and over the same time intervals used in the last plots, its average degree (). The results are presented in the histogram of Figure 9, where light colors correspond to periods close to 2011 and dark ones indicate closeness to 1983.
The fact that the amounts of liabilities in the international interbank market become high correlated in the last period gives place to a much strongly connected network of countries. The histogram in Figure 9 confirms that this effect is most apparent in North Europe countries such as Sweden (SE), Finland (FI) Norway (NO) and Denmark (DK). The main feature in that evolution relies on a kind of permutation taking place in the ranking of the most connected countries. While the Netherlands Antilles (AN) and Hong Kong (HK) suffer a relevant downgrade in that ranking, North EU countries moved in the opposite direction, showing a remarkable increase in the degree of connectivity.
4.2 Clustering and Closeness
Although the graph structures presented so far provide pictorial and detailed representations of the topological properties of the networks, to have a wider view on their continuous evolution, there is a need to compute - besides the degree of the nodes - the values of other topological coefficients at each time period. These coefficients might also help to figure out the extent to which the network structure was affected by the recent financial crises. To this end, Closeness Centrality and Continuous Clustering were calculated over each 14-years period along the 110 time intervals from Q4-1883 to Q3-2011.
4.2.1 Continuous Clustering
Usually, topological coefficients apply to graph structures that are connected and sparse. Using the distance matrix to construct the Minimal Spanning Tree333A spanning tree of a connected and undirected graph is a subgraph that is a tree and connects all the nodes together. The minimal spanning tree is the spanning tree to which the sum of the weights of the links is minimal. connecting countries, as in Mantegna [14], we might start by applying the graph theoretical notion of clustering to the spanning tree. However this construction neglects part of the information contained in the distance matrix. Instead we use the notion of Continuous Clustering [23].
Since is the distance between the countries and restricted to the 3-dimensional space and the average distance, we define a function
| (9) |
which represents the neighbor degree of the countries and . A continuous clustering coefficient is then defined by
| (10) |
The application of this measure to networks of stocks showed that a relevant increase in the values of the coefficient of clustering is empirically related to periods of market shocks or crises ([23],[3],[4]), capturing maximal information on market synchronization in these periods and displaying a completely different behavior in normal periods.
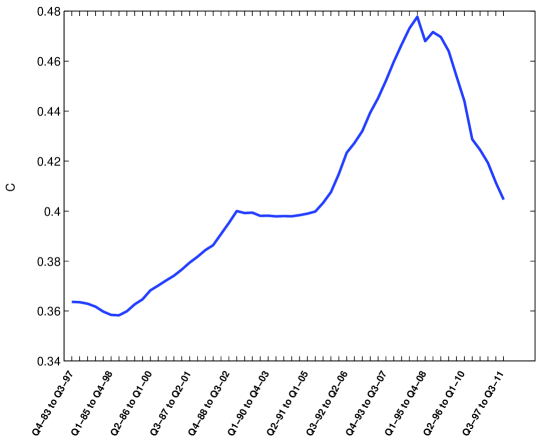
Figure 10 shows the continuous clustering coefficient calculated over a moving window of 56 quarters. It displays an increasing trend with a steeper slope starting in the time slot Q3-1992 to Q2-2006 and reaching the highest value in 2008. After that, the values of indicate that the situation is moving back to the one that characterizes the less synchronized behavior of the earlier nineties.
The relative increase of reaches less than 10% along the first 20 years and after a stationary period that ends in 2006, shows a fast increase of more than 15% in just two years. After 2008, however, clustering - and thus synchronous behavior in terms of correlated debts - starts to behave in the opposite way, helping to shed some light on how the recent financial crisis affected the interbank sector.
Our results are in line with the work of Hattory [9], who found enough evidence of a significant augmentation of the values of the network degree and a corresponding increase in the clustering coefficient over the last decade444The author investigates the changes in cross-border bank exposures between 16 reporting countries over the period 1985-2006.. Additionally, we envision that such a clustering enlargement is the topological signature of a period of mutation taking place in the market of cross-border liabilities during the last 14 years.
4.2.2 Closeness Centrality
We have also computed the Closeness Centrality of each country. In a connected graph, the closeness centrality of a node is the mean geodesic distance from to any other node, being given by
| (11) |
where is the distance between and reduced to the 3-dimensional space. As a geodesic path is the shortest path between a pair of nodes, closeness centrality is lower for nodes that are more central in the sense of having a shorter average distance to the other nodes.
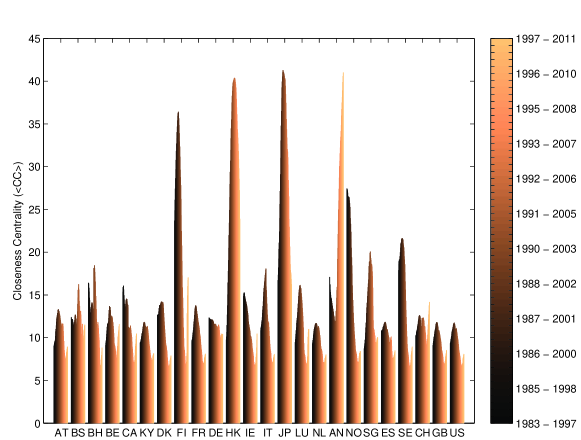
The histogram presented in Figure 11 shows the values of closeness centrality of each country along the whole 28 years. As usual, the values were computed using a moving window of 56 quarters. Initially, both Finland (FI) and Norway (NO) display high closeness. Later, they have been replaced by Japan (JP) and Hong Kong (HK), and more recently, the country with the highest closeness centrality turns to be the Netherlands Antilles (AN). This result is in line with the evolution of the networks presented in Figure 8. Noteworthy is the path followed by the most critical position in the interbank network along the last 20 years, shifting from North Europe to an off-shore country.
Such an important displacement could have been triggered by the European Monetary System (EMS) crises in the early nineties, being then reinforced by the Asian crisis in 1997. While EMS crisis was certainly associated to the North Europe lost of closeness in the earlier nineties, the Japanese turmoil in 1997-1998 might explain that closeness was shifted to an off-shore country as the Netherlands Antilles.
Earlier we saw that Hong Kong (HK) and the Netherlands Antilles (AN) became the lowest connected countries and those with the most critical positions (greatest closeness) in the network. According to the histogram in Figure 11, such a critical role was earlier performed by the North European countries Norway (NO) and Finland (FI).
In our example, the shift in the closeness centrality that was experienced by the chain:
| (12) |
reveals a moving trend grounded on successive financial crises and showing part of their impact on the interbank international market.
Since the latest nineties, we know that crises were imposed either by disarrangements of national markets or emerging economies like Russia and Asian countries or by the performance of global players such as Japan. It is also known that North European countries as Norway, Sweden and Finland suffered important financial crises in the end of the eighties. As Vale points out, the Norwegian crisis lasted from 1988 to 1993 and peaked in the autumn of 1991 with the largest bank facing serious difficulties. It was followed by the Finnish and Swedish crises, which significantly contributed to the beginning of an important crisis in the European Monetary System (EMS) [22].
A clarifying contribution comes from the work of Huizinga and co-workers, who evaluated the extent to which the international banking flows come to be reflected in tax policies of a large set of countries. In a recent paper [12], they examine the relation between tax policies and the amount of foreign liabilities in each national banking sector. As indicated, foreign banks are expected to have relatively abundant opportunities to shift profits when the host countries are characterized by low levels of taxation. In this context, they found enough evidence on the inward profit shifting role played by Norway and Hong Kong in the last decade. Additionally, they recall that the most obvious recipients of inward profit shifting are the low or no-tax off-shore financial centers as the Cayman Islands and the Netherlands Antilles.
Here we envision that the network of cross-border liabilities channeled through the banking system might be influenced by the sequence of financial crises that impacted cross-border flows since the earlier nineties, contributing to the emergence of the critical locations that correspond to countries where tax policies provide opportunities to shift debts.
5 Concluding Remarks
In this paper we have investigated the modifications that may occur in the structure of the cross-border financial linkages as a consequence of economic crises, which in different historical periods, might be associated to the opportunity to shift debts offered by countries with low tax policies.
Using time series of interbank liabilities conducted through the international banking system, we have developed complete and weighted networks of debt positions between 24 countries. These structures were developed for (i) a 28-years period that goes from 1983 to 2011 and two 14-years periods (ii) from 1983 to 1997, and (iii) from 1997 to 2011.
The geometrical analysis of (i), (ii) and (iii) implied that most of the systematic information of the interbank international market was contained in a 3-dimensional space, from which a topological characterization could be conveniently carried out.
From the geometrical perspective, the reduced subspaces of countries showed that the most eccentric positions are occupied by countries outside the European Union. Moreover, it also showed that comparing (ii) and (iii), the main difference relies on the clustering trend that characterizes the later period, where the distances between countries seem to be shortened, except for the few examples of the Netherlands Antilles and Hong Kong. Such a clustering effect is followed by a contraction of the volume () of the corresponding geometrical space. When is computed over (i), its evolution confirms our previous results, identifying the major changes in the 28-years period and highlighting the relevance of the recent economic crises.
Our approach is complemented by a topological perspective. Since the distances between countries are properly defined distances, it gives a meaning to topological tools in the study of the interbank market. The first step in this direction concerned the definition of fully-connected and weighted networks of reporting countries. The analysis of the networks obtained for (ii) and (iii) showed that: (a) there is a generalized increase in the network degree (strength of the links) in 1997-2011; (b) there is also a corresponding increase in clustering, and (c) North EU countries lost their critical positions in the network, being replaced by Hong Kong and the Netherlands Antilles.
Additionally, we argue that the chain of countries displaying the stronger modifications in closeness and connectivity reflects the sequence of financial crises that impacted cross-border flows since the earlier nineties. We envision that the networks of cross-border liabilities channeled through the banking system have critical locations that correspond to countries where tax policies provide opportunities to shift debts.
As the data and the method suggest, such a feature is part of a mutation in the structure of the cross-border interdependencies since the latest nineties. Results highlight an important modification acting in the financial linkages across countries in the period 1997-2011, and situate the recent financial crises as a counterpart of a larger structural change going on since 1997.
Acknowledgement: This work has benefited from partial financial support from the Fundação para a Ciência e a Tecnologia-FCT, under the 13 Multi-annual Funding Project of UECE, ISEG, Technical University of Lisbon.
References
- [1] G. Akerlof and R. Shiller (2009), Animal Spirits. How Human Psychology Drives the Economy and Why It Matters for Global Capitalism, Princeton University Press.
- [2] T. Ara jo and R. Vilela Mendes (2000) ”Function and form in networks of interacting agents”, Compl. Syst. 12, 357–378.
- [3] T. Ara jo and F. Lou (2007) ”The Geometry of Crashes - A Measure of the Dynamics of Stock Market Crises”, Quantitative Finance, 7(1), 63-74.
- [4] T. Ara jo and F. Lou (2008) ”The Seismography of Crashes in Financial Markets”, Physics Letters A, 372, 429-454.
- [5] M. Boss, H. Elsinger, M. Summer and S. Thurner (2004) ”An empirical analysis of the network structure of the Austrian interbank market”, Oesterreichische Nationalbank Financial Stability Report, June, 77-87.
- [6] L. Errico, A. Musalem Borrero (1999) ”Off-shore Banking-An Analysis of Micro- and Macro-Prudential Issues”, International Monetary Fund, IMF Working Papers: 99/5.
- [7] Y. Fujiwara, H. Aoyama, Y. Ikeda, H. Iyetomi, and W. Souma (2009), ”Structure and temporal change of the credit network between banks and large firms in Japan”, Economics E-Journal, 3.
- [8] R. Garratt, L. Mahadeva and K. Svirydzenka (2011) ”Mapping systemic risk in the international banking network”, Bank of England Working Paper 413.
- [9] M. Hattori, Y. Suda (2007) “Developments in a Cross-Border Bank Exposure ‘Network”’, proceedings of a CGFS workshop held at the Bank for International Settlements.
- [10] E. Helpman and P. Krugman (1985) ”Market Structure and Foreign Trade: Increasing Returns, Imperfect Competition and the International Economy”, MIT Press, 1985.
- [11] P. Holme and B.J. Kim (2002) ”Attack vulnerability of complex networks”, Phys. Rev. E 65, 056109.
- [12] H. Huizinga, G. Nicodeme (2004) ”Are International Deposits Tax-Driven”. Journal of Public Economics, (88), 1093-1118.
- [13] C. Kubelec and F. Sa (2009) ”The Geographical Composition of National External Balance Sheets: 1980-2005”, Bank of England and University of Cambridge Working Paper.
- [14] R. Mantegna, (1999) ”Hierarchical Structure in Financial Markets”, Eur. Phys. J. B 11, 193-197.
- [15] R. Mantegna and H. Stanley (2000) An Introduction to Econophysics: Correlations and Complexity in Finance, Cambridge: Cambridge University Press.
- [16] G. De Masi, G.Iori and G. Caldarelli (2006) ”A fitness model for the Italian Interbank Money Market”, Phys. Rev. E 74, 66112.
- [17] P. McGuire and N. Tarashev (2006) ”Tracking International bank flows”, BIS Quarterly Review, December, 27-40.
- [18] C. Minoiu and J. A. Reyes (2011) ”A Network Analysis of Global Banking: 1978–2009”, IMF Working Paper No. 74 (Washington: International Monetary Fund).
- [19] K. Soramaki, M. Bech, J. Arnold, R. Glass and W. Beyeler (2007) ”The topology of interbank payment ows”, Physica A, Vol. 379, 317-333.
- [20] G. Soros (2008) ”The new paradigm for financial markets: The credit crisis of 2008 and what it means”. New York: Public Affairs.
- [21] A. Spelta and T. Ara jo (2012) ”The topology of cross-border exposures:beyond the minimal spanning tree approach”, Physica A, to appear.
- [22] B. Vale (2006) ”The Norwegian Banking Crisis”, Occasional Paper No 33, Norges Bank.
- [23] R. Vilela Mendes, T. Ara jo and F. Lou (2003) ”Reconstructing an Economic Spaces from a Market Metric”, Physica A, 32, 635-650.