The gamma-ray flaring properties of the blazar 3C 454.3
Abstract
3C 454.3 is the most variable and intense extragalactic gamma-ray blazar detected by AGILE and Fermi during the last 4 years. This remarkable source shows extreme flux variability (about a factor of 20) on a time-scale of 24–48 hours, as well as repeated flares on a time-scale of more than a year. The dynamic range, from the quiescence up to the most intense gamma-ray super-flare, is of about two orders of magnitude. We present the gamma-ray properties of 3C 454.3, comparing both the characteristics of flares at different levels and their multi-wavelength behavior. Moreover, an interpretation of both the long- and short-term properties of 3C 454.3 is reviewed, with particular emphasis on the two gamma-ray super-flares observed in 2009 and 2010, when 3C 454.3 became the brightest source of the whole gamma-ray sky.
I INTRODUCTION
Multi-wavelength studies of -ray active galactic nuclei (AGNs) date back to the late ’70s and early ’80s with the COS–B detection of 3C 273 Swanenburg78 ; Bignami81 . It was during the ’90s, with the launch of CGRO, that EGRET allowed us to establish blazars as a class of -ray emitters and to start multi wavelength studies of such sources. For a few sources, it was possible to study both the properties of the spectral energy distributions (SEDs) during different -ray states, and the search for correlated variability at different bands (e.g., 3C 279 Hartman2001:3C279:multiwave ; Hartman2001:3C279:gammaopt ). The launches of the AGILE Tavani2009:Missione and Fermi Atwood2009:fermi_lat -ray satellites allowed a tremendous improvement in the monitoring of blazars in the -ray energy band, thanks to their wide field of view and all-sky scanning pointing mode111The AGILE satellite switched from a pointing to a spinning observing mode on 2009 November because of a permanent reaction wheel failure..
The flat-spectrum radio quasar 3C 454.3 (PKS 2251158; ) became one of the most investigated sources, thanks to its high dynamic range flux variations from the radio to the -ray energy bands. A study Vercellone2004:duty showed that during the EGRET era this source exhibited the highest -ray activity index value222The activity index is defined as the ratio between the number of the source high states and the exposure, in unit of cm-2 s-1. See Vercellone2004:duty for further details., despite moderate -ray peak fluxes ( photons cm-2 s-1). In 2005 May 3C 454.3 exhibited an extremely intense flare at different energies Fuhrmann2006:3C454_REM ; Giommi2006:3C454_Swift , but no information on the -ray flux level was available. A simultaneous SED is the “Rosetta Stone” which helps to study the emission processes at different wavelengths. We obtained almost simultaneous SEDs of 3C 454.3 from the radio to the -ray energy band through dedicated blazar observations both in the low and and in the high emission levels performed by the WEBT-GASP Consortium Villata2004:WEBT:BLLac (radio, optical, and NIR), and, thanks to its extremely rapid repointing capability, by Swift Gehrels2004:Swift (optical, UV, X-rays, and hard X-rays). Here we present the results of four years of AGILE -ray and multi-wavelength observations of 3C 454.3, discussing its short- and long-term properties.
II SHORT-TERM MONITORING RESULTS
Since 2007, AGILE detected several -ray flares from 3C 454.3 Vercellone2008:3C454_ApJ ; Vercellone2008:3c454:ApJ_P1 ; Donnarumma2009ApJ_P2 ; Vercellone2010ApJ_P3 ; Striani2010ApJ_3c454 ; Pacciani2010ApJ_3c454 ; Vercellone2011:ApJL_3C454_nov2010 . The rapid analysis of the -ray data allowed us to provide almost real-time alert to other Observatories at different wavelengths, from radio up to the hard X-ray. This allowed us to obtain detailed multi-wavelength light-curves which can be used to extract time-selected SEDs.
Among several -ray flares, those which occurred on 2009 December and 2010 November represent the most intense -ray emission from an extra-galactic source so far.
The first one occurred on 2009 December 2–3 when 3C 454.3, after an enhanced -ray state lasted about 2 weeks, displayed an extremely fast flux increase up to photons cm-2 s-1, as reported in Striani2010ApJ_3c454 . A multi-wavelength campaign Pacciani2010ApJ_3c454 showed that while the pre- and post-flare SEDs can be modeled in terms of a one-zone synchrotron self-Compton (SSC) plus external Compton emission (EC), the flare one requires an additional particle component.
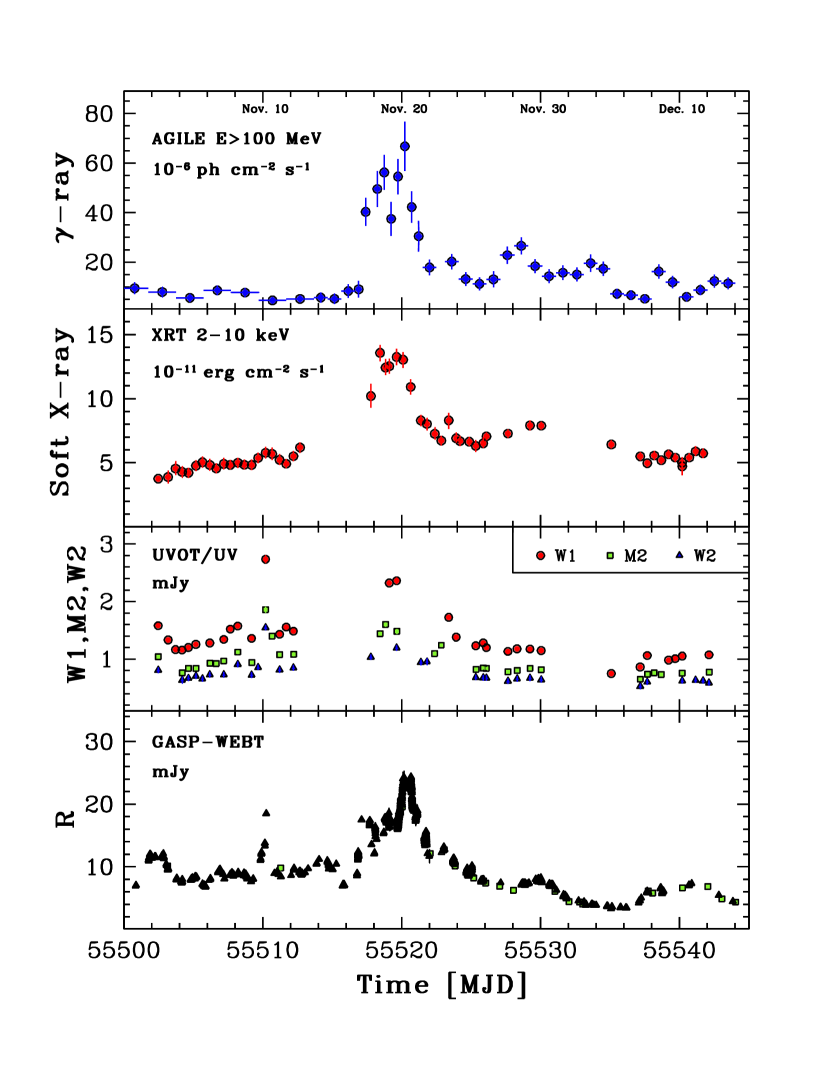
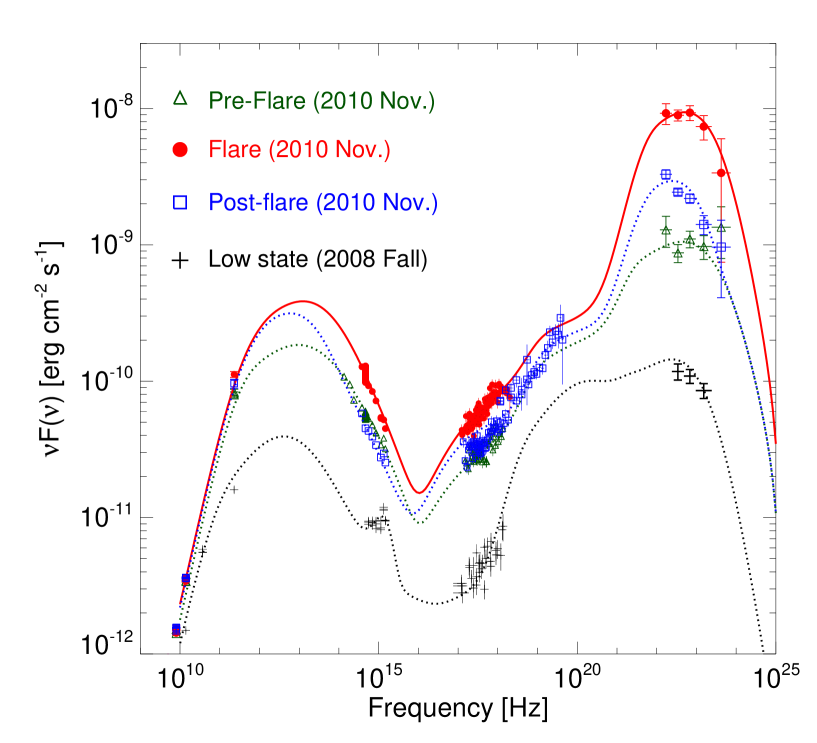
The second -ray super-flare from 3C 454.3 occurred on 2010 November 20, when 3C 454.3 reached a -ray peak flux of photons cm-2 s-1, as reported in Vercellone2011:ApJL_3C454_nov2010 . Figure 1 shows the multi-wavelength light curves of this extremely intense flare. While on MJD 55520 a clear peak is visible in all the energy bands, about ten days earlier a remarkably fast optical flare (with rise and fall of about a factor of 2–2.5 in about 48 hr) occurred, with no significant variation in the -ray energy band and a modest 20% increase in the X-ray. Figure 2 shows the SEDs accumulated before, during, and after the 2010 November -ray flare (color points) in comparison with the SED accumulated in the Fall 2008 during a particularly low state. A modeling of the evolution of the super-flare SED, taking into account the “-ray orphan” optical flare on MJD 55510, challenges a model with a uniform external photon field. Moreover, the modeling places the -ray emission region within the BLR.
Short-term observing campaigns allowed us to study the variability properties of -ray flares. 3C 454.3 shows extremely fast -ray flares (e.g., Foschini2011:fsrq_variab ), which favor the hypothesis of a dissipation region within the BLR Bonnoli2011:3c454 . Moreover, during previous multi-wavelength campaigns, by combining the AGILE ( MeV) and WEBT-GASP (-band) data we investigated the possible delay between the -ray flux variations with respect to the optical ones. We found Vercellone2008:3c454:ApJ_P1 ; Donnarumma2009ApJ_P2 ; Vercellone2010ApJ_P3 a moderate correlation with no time-lag between the emission in the two energy bands.
III LONG-TERM MONITORING RESULTS
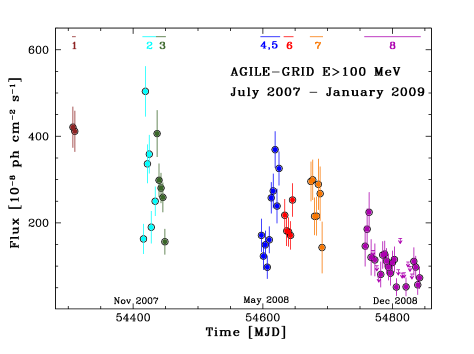
The AGILE pointing scheme changed since 2009 November, from a pointed strategy to a quasi all-sky one. Figure 3 shows the light-curve accumulated during an eighteen-month period (2007 July - 2009 January) obtained by combining several pointed observations. We can appreciate the dynamic range of the different flares (about a factor of 2–4) and the dimming trend towards the end of 2008.
Such a long-time coverage was supported by co-ordinated multi-wavelength observations. In particular, we obtained data with Swift, INTEGRAL, RXTE, and from ground-based Facilities (e.g., GASP-WEBT, UMRAO, the MOJAVE Project). Figure 4 shows, from top to bottom, the light-curves in the radio, optical, millimeter and -ray energy bands, respectively.
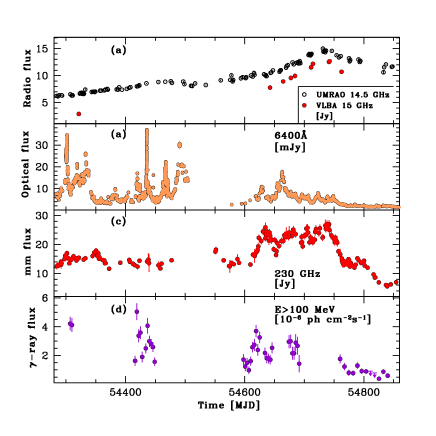
When comparing the radio flux variation with respect to the optical and -ray ones, we see how the former one has a single flux density peak on MJD 54742. This variability is not well correlated with the variability at higher frequencies: optical and -ray data show more different flares in the period MJD 54300–54800. Moreover, the radio flux density increase is smooth and longer in time, while -ray and optical flares are evolving faster. We can speculate that a multiple source activity in the optical and -ray bands is integrated in the radio emitting region in a single event.
The comparison of the light-curves in the mm, optical and -ray energy bands can shed some light on the geometrical properties of the jet. Following Villata2009:3C454:GASP:accep , a possible interpretation Vercellone2010ApJ_P3 arises in the framework of a change in orientation of a curved jet, yielding different alignment configurations within the jet itself. During 2007, the more pronounced fluxes and variability of the optical and -ray bands seem to favor the inner portion of the jet as the more beamed one. On the other hand, the dimming trend in the optical and in the -ray bands, the higher mm flux emission and its enhanced variability during 2008, seem to indicate that the more extended region of the jet became more aligned with respect to the observer line of sight.
The Swift satellite flexibility allowed for the first time to monitor high-energy blazars during -ray flares. Figure 5 shows the X-ray photon index as a function of the 2–10 keV flux during different observing campaigns.
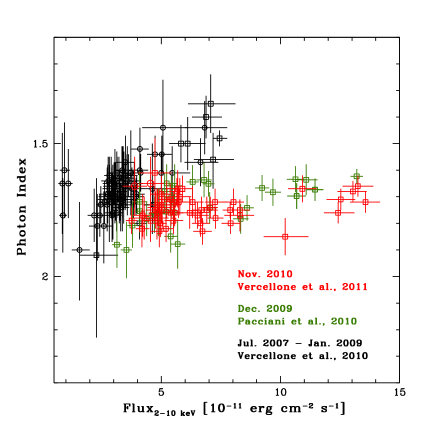
During the 18-months AGILE campaign (black symbols), Vercellone2010ApJ_P3 found a clear harder-when-brighter trend, in particular for fluxes above (1–2) erg cm-2 s-1 . As reported in Vercellone2011:ApJL_3C454_nov2010 , during the 2010 November flare (red points) this trend no longer stands. Remarkably, Donnarumma2011:intergral_PoS show that a behavior similar to the November 2010 one was already present during the 2009 December -ray flare (green points; see also Pacciani2010ApJ_3c454 ). We can describe the harder-when-brighter trend in terms of a dominant contribution of the EC off the disk seed photons, EC(Disk), over the SSC component, probably due to an increase of the accretion rate. We note that an increase of the electron density () and/or of the break energy Lorentz factor () would cause a softer-when-brighter trend, inconsistent with our findings.
The constant X-ray photon index during the extreme -ray flares in 2009 and 2010 can be interpreted in terms of a balance of the SSC contribution with respect to the EC(Disk). If we assume that increases significantly with respect to the 2007–2008 ones ( in 2007–2008, see Vercellone2010ApJ_P3 ; in 2009–2010, see Pacciani2010ApJ_3c454 ; Vercellone2011:ApJL_3C454_nov2010 ), we obtain both an increase of the EC(Disk) component (and the shift of the peak of its emission to higher frequencies), and a simultaneous increase of the SSC. The net result is a roughly achromatic increase of the X-ray emission.
IV DISCUSSION AND CONCLUSIONS
AGILE and Fermi are providing an enormous step forward the understanding of the -ray blazar class, under complementary points of view (the former more prone to dedicated multi-wavelength campaigns on a small number of sources, the latter discovering and analyzing more than one order of magnitude more blazars with respect to EGRET). The -ray energy band alone cannot conclusively derive the physical properties of these sources. While radio and optical monitoring has been performed for several years, only the Swift satellite can now provide a detailed monitoring from the optical to the hard X-ray energy bands.
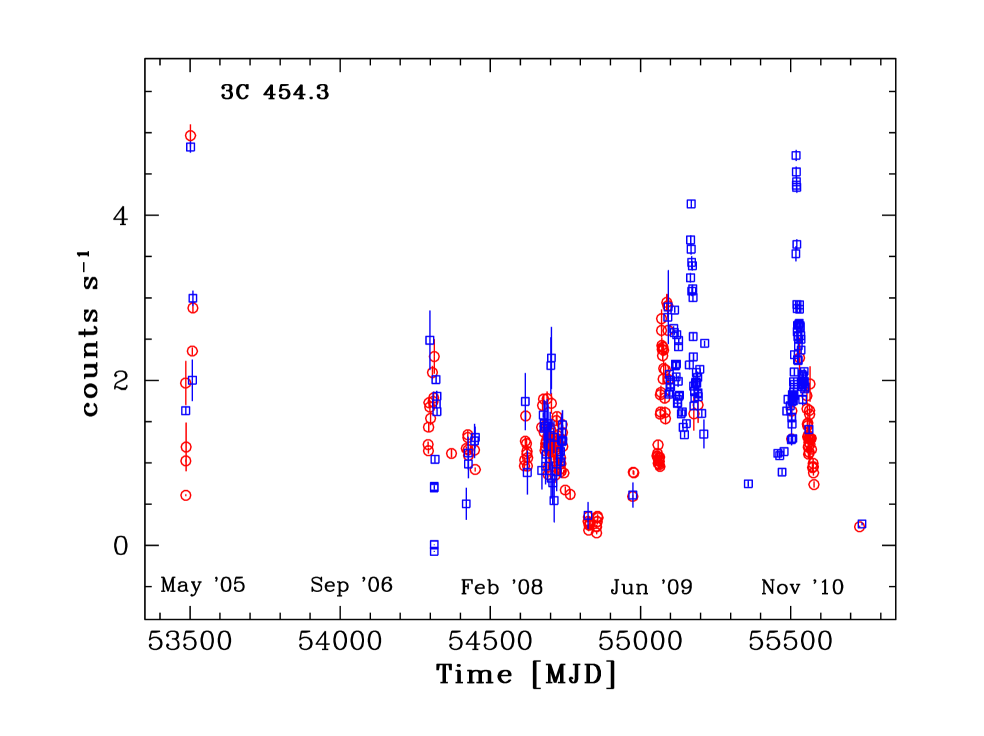
Figure 6 shows the Swift/XRT light-curve accumulated during the period 2005–2011. Such a coverage is astonishing because it is obtained with a “pointed” instrument, not with an all-sky one. We can clearly identify the 2005 May, 2009 December, and 2010 November flares. Starting from 2007 mid July (MJD ) we see a much denser monitoring of 3C 454.3 by means of Swift/XRT, being the epoch of the first -ray flare detected by AGILE (see Vercellone2008:3C454_ApJ ). Moreover, for bright sources ( erg cm-2 s-1, i.e., 1–2 counts s-1) we can obtain spectral informations on a time-scale of about 5 ksec, allowing the study of the synchrotron-to-inverse Compton transition region. The optical-UV filters on-board Swift/UVOT allow us to study the disc emission in flat-spectrum radio quasars. The black SED in Figure 2 clearly shows the thermal contribution of the accretion disc at Hz during a particularly low -ray state. This feature is completely swamped out by the intensity of the synchrotron continuum during flaring -ray states (SEDs in colors).
The combination of the AGILE, Fermi, Swift, and radio data will allow us to investigate the properties of the jet. Moreover, simultaneous optical/UV spectroscopy of the BLRs and optical polarimetry observations would greatly improve our knowledge of the flaring episodes in 3C 454.3.
Acknowledgements.
We acknowledge financial contribution from the agreement ASI-INAF I/009/10/0. The AGILE Mission is funded by the Italian Space Agency (ASI) with scientific and programmatic participation by the Italian Institute of Astrophysics (INAF) and the Italian Institute of Nuclear Physics (INFN). We acknowledge ASI contract I/089/06/2. This work made use of data supplied by the UK Swift Science Data Centre at the University of Leicester.References
- [1] B. N. Swanenburg, et al., Nature 275, 298–+ (1978).
- [2] G. F. Bignami, et al., Astron. & Astrophys. 93, 71–+ (1981).
- [3] R. C. Hartman, et al., Astrophys. J. 553, 683–694 (2001).
- [4] R. C. Hartman, et al., Astrophys. J. 558, 583–589 (2001).
- [5] M. Tavani, et al., Astron. & Astrophys. 502, 995–1013 (2009).
- [6] W. B. Atwood, et al., Astrophys. J. 697, 1071–1102 (2009).
- [7] S. Vercellone, S. Soldi, A. W. Chen, and M. Tavani, Mon. Not. R. Astron. Soc. 353, 890–902 (2004).
- [8] L. Fuhrmann, et al., Astron. & Astrophys. 445, L1–L4 (2006).
- [9] P. Giommi, et al., Astron. & Astrophys. 456, 911–916 (2006).
- [10] M. Villata, et al., Astron. & Astrophys. 424, 497–507 (2004).
- [11] N. Gehrels, et al., Astrophys. J. 611, 1005–1020 (2004).
- [12] S. Vercellone, et al., Astrophys. J. Letters 676, L13–L16 (2008).
- [13] S. Vercellone, et al., Astrophys. J. 690, 1018–1030 (2009).
- [14] I. Donnarumma, et al., Astrophys. J. 707, 1115–1123 (2009).
- [15] S. Vercellone, et al., Astrophys. J. 712, 405–420 (2010).
- [16] E. Striani, et al., Astrophys. J. 718, 455–459 (2010).
- [17] L. Pacciani, et al., Astrophys. J. Letters 716, L170–L175 (2010).
- [18] S. Vercellone, et al., Astrophys. J. Letters 736, L38+ (2011).
- [19] L. Foschini, G. Ghisellini, F. Tavecchio, G. Bonnoli, and A. Stamerra, Astron. & Astrophys. 530, A77+ (2011).
- [20] G. Bonnoli, G. Ghisellini, L. Foschini, F. Tavecchio, and G. Ghirlanda, Mon. Not. R. Astron. Soc. 410, 368–380 (2011).
- [21] M. Villata, et al., Astron. & Astrophys. Letters 504, L9–L12 (2011).
- [22] I. Donnarumma, et al., PoS(INTEGRAL 2010)008 (2010).
- [23] P. A. Evans, et al., Mon. Not. R. Astron. Soc. 397, 1177–1201 (2009).