Large magnetic penetration depth and thermal fluctuations in a Ca10(Pt3As8)[(Fe1-xPtx)2As2]5 (x=0.097) single crystal
Abstract
We have measured the temperature dependence of the absolute value of the magnetic penetration depth in a Ca10(Pt3As8)[(Fe1-xPtx)2As2]5 (x=0.097) single crystal using a low-temperature magnetic force microscope (MFM). We obtain (0)1000 nm via extrapolating the data to . This large and pronounced anisotropy in this system are responsible for large thermal fluctuations and the presence of a liquid vortex phase in this low-temperature superconductor with critical temperature of 11 K, consistent with the interpretation of the electrical transport data. The superconducting parameters obtained from and coherence length place this compound in the extreme type II regime. Meissner responses (via MFM) at different locations across the sample are similar to each other, indicating good homogeneity of the superconducting state on a sub-micron scale.
Iron-based superconductors offer an opportunity to explore superconductivity over a very wide range of superconducting properties, such as critical fields, superfluid densities, and their anisotropy.Paglione 2010 Comparing iron-based superconductors with cuprates provides clues to the mechanism of high superconductivity that determine fundamental superconducting parameters, such as the gap symmetryYin 2009 ; Chubukov 2009 and the upper critical fields,Yuan 2009 as well as complex vortex dynamics due to the thermal fluctuations.Blatter ; Prozorov 2008 ; Beek 2010 Understanding the correlation between intrinsic properties and the pinning mechanism is thus intriguing from both basic and applied points of view. Recently, superconductivity has been reported in a new family of highly anisotropic materials; Ca10(PtnAs8)[(Fe1-xPtx)2As2]5 (Ca-Pt-Fe-As) with n=3 (“10-3-8”) and n=4 (“10-4-8”).Ni 2011 ; Kakiya 2011 ; Lohnert The 10-3-8 phase has symmetry and a of up to 11 K upon Pt doping; the 10-4-8 phase has tetragonal symmetry with the highest of 38 K. It is worth noting that well-defined Fermi surface sheets with tetragonal symmetry, similar to other pnictides, are observed in the 10-3-8 phase in spite of its triclinic symmetry.Neupane Anisotropy of the critical field in the 10-3-8 phase near , ( Ref. 8), is much larger than that of the 122 pnictide compounds, (Ref. 12), consistent with a more anisotropic 2D nature of the 10-3-8 system. In contrast to Ba(Fe1-xCox)2As2 superconductors, well-studied by a variety of techniques,Ni 2008 10-3-8 shows a broadened superconducting transition temperature with applied field,Ni 2011 consistent with strong thermal fluctuations of vortices.Blatter
In this Rapid Communication we present measurements of the absolute value of the magnetic penetration depth in the 10-3-8 compound. We derive the values of several basic superconducting parameters from our measurements and relate them to other unusual properties observed in the 10-3-8 compound, such as a broadened superconducting phase transition. We have determined the temperature dependence of the absolute value of in a 10-3-8 single crystal (x=0.097)Ni 2011 with 11 K using a Meissner technique employing magnetic force microscopy (MFM). Our experimental approach for measurements is simple, robust, and independent of the MFM tip model whereas most previous MFM studies provided either variations or the absolute value from modeling the tip magnetization instead of measuring directly.Luan 2010 ; Nazaretski 2009 Recently, the temperature dependence of was measured via a tunnel-diode resonator technique, and it showed an increasing anisotropy of the superconducting gap as doping decreases from optimal doping towards the edges of the superconducting dome.Cho Our MFM results show that the superconductivity is homogeneous, which agrees well with tunnel diode,Cho transport,Ni 2011 and angle resolved photoemission spectroscopy (ARPES) data.Neupane By extrapolating our temperature dependent data from 4 K to , we obtain (0)1000 nm. The short electron mean free path in this system, compared to the coherence length, suggests that this system is in the dirty limit, which is partly responsible for the large value. Strong thermal fluctuations inferred from the Ginzburg number are consistent with a wide superconducting transition under field and the presence of a vortex-liquid phase in this highly anisotropic superconductor with relatively low .Ni 2011
Synthesis of the 10-3-8 system is described elsewhere.Ni 2011 All measurements described here were performed in a home-built low-temperature MFM apparatus,Nazaretski RSI 2009 which allows acquisition of a complete set of MFM data on several samples with identical MFM tip conditions. With this apparatus, a Meissner response curveLuan 2010 is measured first as a function of the tip-sample separation in the reference sample (Nb film), and then, the cantilever is moved to the sample of interest (10-3-8) where its Meissner response as a function of tip-sample distance is obtained. Direct comparison of these curves yields the absolute value of in 10-3-8 and its temperature dependence . (We measure since the shielding currents run in the basal plane.) The value of the reference Nb film was verified by both a different MFM technique and SQUID magnetometry measurements, as described elsewhere.Nazaretski 2009 The vortex imaging, after field-cooling the sample in a field of a few Oersted to avoid the demagnetization effect of the sample, was performed in a frequency modulation mode with the tip-lift height of 400 nm above the sample surface. The zero point of the tip-sample separation was determined by touching the surface of the sample; this touchdown of the tip resulted in a substantial negative frequency shift. The tip-sample separation was measured based on the calibration of the piezo scanner. We used a high resolution cobalt-coated Nanosensors cantileverNanosensors that was polarized along the tip axis in a 30-kOe magnetic field (). The Meissner experiment was performed under the conditions of no vortices being present in a 20 m 20 m field of view, which eliminates possible force contributions of vortices to the Meissner force. Before vortex measurements on the 10-3-8 sample, the stray field () from a superconducting magnet was calibrated by measuring the number of vortices as a function of field on the Nb reference (see Fig. 1(b)): the Nb reference serves as a magnetic field sensor. The red line in Fig. 1(b) is a linear fit to the experimental data with a fit function of , where is a number of vortices. The obtained slope and from the fit are 1.6 Oe-1 and -2.6 Oe, respectively. The calculated single vortex flux from the slope of the fit and the area of a vortex image is Gm2, which is in good agreement with the theoretical value of a single flux quantum . The Nb reference film is homogeneous with a uniform (though irregular) distribution of vortices. The stray field calibration in panel (b) in Fig. 1 was reproducible at 3 different locations of the Nb reference.
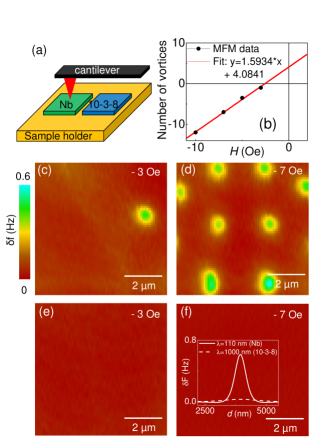
Figs. 1(c)-(f) show MFM images obtained at two different nominal fields of Oe and Oe in both the Nb reference (panels (c) and (d)) and the 10-3-8 single crystal (panels (e) and (f)). We obtained MFM images at several locations across the sample’s surface separated by hundreds of microns and observed no vortices. Thermal drift of the MFM system equals a few nanometers per hour at 4 K. The low drift comes from a rigid design of the MFM apparatus. More technical details can be found in Ref. 15. This indicates that the lack of vortices in a 10-3-8 sample is an intrinsic property. The lack of vortices may be due to a large , leading to a very slow exponential decay of the vortex profile over a large length scale, and hence a smaller intensity of the MFM signal in the vortex center.vortex-profile To verify this possibility, we measured the Meissner response as a function of the tip-sample separation. An MFM tip experiences a Meissner force because of the interaction between the tip magnetic moment and a field generated from the shielding current induced by the tip moment. The Meissner response force can be expressed as a function of and the tip-sample separation , , where is a prefactor that reflects the sensor’s geometry and the magnetic moment.Luan 2010 ; Auslaender 2009 ; Straver 2008 ; Luan arxiv ; Shapoval 2011 The Meissner forces obtained from a Nb reference and the 10-3-8 sample have the same functional form, and , respectively. Note that and are the same in both cases when the tip is at the same condition. As a result, , where the reference 110 nm has been previously determined Nazaretski 2009 and is the shift required to overlay the curves.
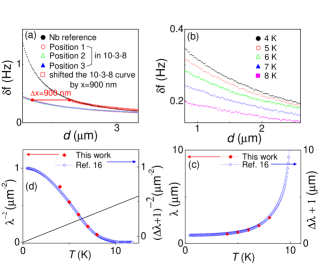
Fig. 2(a) shows Meissner curves obtained from the Nb film and the 10-3-8 single crystal. The Meissner curves in the 10-3-8 sample were obtained at three lateral positions separated by approximately 10 m: the uniformity of the curves indicates that is homogeneous on a sub-micron scale. As opposed to the Nb reference, the Meissner curve for the 10-3-8 crystal decays slowly as the tip-sample separation increases, indicating the for the 10-3-8 compound is larger than that of Nb. The absolute value of in the 10-3-8 sample is obtained by offsetting the 10-3-8 Meissner curve to overlay the response in the Nb reference. The offset yields of 900 nm, as shown by the arrow in Fig. 2(a), and therefore nm. The temperature-dependent penetration depth, shown in Fig. 2(c), was obtained from Meissner curves measured at different temperatures, as shown in Fig. 2(b). Fig. 2(c) displays the absolute values of of obtained using MFM (red filled diamonds) and using tunnel diode measurementsCho (blue empty diamonds). To compare the two data sets, the tunnel diode data () are shifted along the axis by 1 m, the absolute value of obtained from MFM measurements. These data sets demonstrate consistency, proving the validity of the MFM approach. We also measured the absolute value of in a 10-3-8 sample with a different doping level (; 10 K) and obtained (a doping dependence) 100 nm.
The large measured here can be due to either impurity scattering or an intrinsically small superfluid density. To evaluate the contribution from impurities, we first estimate the electronic mean free path using the Drude model: , where is the von Klitzing constant ( ), is the Fermi wave vector, is the charge carrier density, and is the resistivity. We obtain 1.5 nm, using and obtained via transport measurementsNi 2011 and from ARPESLohnert . The mean free path ( nm) is shorter than the coherence length ( nm) obtained from transportNi 2011 (), and indicates that the system is in the dirty limit, partially explaining the large value. In the dirty limit the effective penetration depth is using the local approximation and the effective coherence length is .Tinkham ; Kim For 19.7 nm (obtained from the equation of ), 1000 nm, and 1.5 nm, in the clean limit is approximately 270 nm.
A large also can be due to a small superfluid density. The London penetration depth , where is an effective electron mass, is the vacuum permeability, is the charge carrier density, and is an electron charge. ARPES E(k) data allow us to calculate the effective mass of the charge carriers using the expression . We obtain 7.3, where is a bare electron massLohnert . This and m-3, obtained from transport measurements,Ni 2011 results in nm. This calculated corresponds to an intrinsic , because the experimental band dispersion and carrier density do not depend on disorder. Therefore, we can directly compare nm with nm from ARPES and transport. The discrepancy is likely a result of the carrier density being obtained using a single band approximation; whereas, ARPES and theoretical electron band calculations show a multiband character of the Fermi surface.
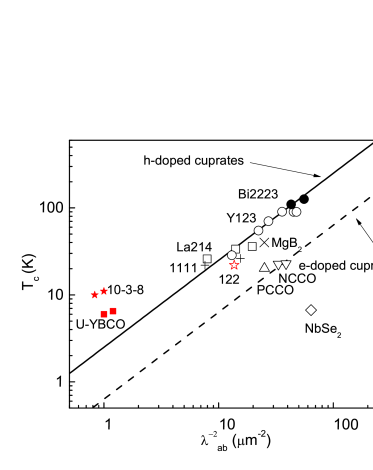
The small superfluid density, reflected in the large measured penetration depth, indicates a weak phase stiffness of the superconducting order parameter and suggests that phase fluctuations may be important in 10-3-8. We add in Fig. 3 the values of for 10-3-8 as red filled stars to the Uemura plot,Uemura 1989 which shows the scaling between and in unconventional superconductors. We see that the phase stiffness relative to is weaker than in other Fe-based superconductors as well as the cuprates, even weaker than that in highly underdoped YBCO.Luetkens 2008 ; Broun 2007 ; Zuev 2005 This may reflect a “Swiss cheese” like response of the system to impurities, indicating nanoscale inhomogeneity is likely present in 10-3-8.Franz ; Das Our measurement of is not sensitive to heterogeneity on this scale. The relatively large anisotropy of the upper critical field further suggests that 10-3-8 may be the most quasi-2D material of all Fe-based superconductors,Ni 2011 thus bearing more resemblance to the cuprate superconductors. Fig. 2(d) shows the measured superfluid density as well as prediction of the Kosterlitz-Thouless-Berezinsky (KTB) theory of vortex-unbinding that should be applicable to a highly anisotropic 2D superconductor.BTK passes smoothly through the KTB line, indicating that superconductivity of the 10-3-8 phase is still of a 3-D character.
We now discuss the effects of the large on other superconducting properties. The values obtained from the Werthamer-Helfand-Hohenberg theoryWerthamer 1966 are = 55 T and = 13 T, and the corresponding values are = 5 nm and = 1.2 nm.Ni 2011 We calculate 200, using nm and nm, the thermodynamic critical field Oe, and the depairing current MAcm2. These values indicate that the 10-3-8 compound is an extreme type II superconductor. Anisotropy of the critical field in this compound shows a strong temperature dependence, ranging from 10 near to 5 at 0.9.Ni 2011 The resistive signature of the superconducting transition broadens with increasing magnetic field, indicating the presence of strong magnetic fluctuations.Ni 2011 The fundamental parameter governing the strength of the thermal fluctuations is the Ginzburg number , , where is the thermodynamical critical field and is the anisotropy parameter.Blatter Using K, , nm, and nm, we obtain . The theoretical width of the transition, , is approximately 1.8 K, consistent with the experimental value of K; although, we can not rule out that the rounding is also partially a result of nanoscale spatial inhomogeneity of Tc.Ni 2011 The in the 10-3-8 compound is larger than that in YBCO (0.01) and BiSCCO (0.1).Blatter The broadening of the superconducting transition with increasing magnetic field is consistent with the presence of a vortex-liquid phase, similar to cuprates.Blatter
In conclusion, we measured the absolute value of in a single crystal of Ca10(Pt3As8)[(Fe1-xPtx)2As2]5 (x=0.097) using a Meissner technique in a low temperature MFM apparatus. Similar Meissner responses in different regions of the sample indicate that the superconductivity is homogeneous on a scale of . We obtain the value of in our sample of approximately 1000 nm. The clean limit penetration depth is calculated to be 270 nm based on an impurity scattering model. The large Ginzburg number () agrees well with the previously reported data that show a broad superconducting transition and a signature of a vortex liquid phase in this highly anisotropic low K superconductor.
We acknowledge valuable discussions with M. Graf. Work at Los Alamos was supported by the US Department of Energy, Office of Basic Energy Sciences, Division of Materials Sciences and Engineering. Work at Brookhaven was supported by the US Department of Energy under Contract No. DE-AC02-98CH10886. Work at Princeton was supported by the AFOSR MURI on superconductivity, grant FA9550-09-1-0593. We thank K. Cho, M. Tanatar, and R. Prozorov for supplying data from Ref. 16. N. H. is member of CONICET, Argentina.
References
- (1) J. Paglione and R. L. Greene, Nat. Phys. 6, 645 (2000).
- (2) Yi Yin, M. Zech, T. L. Williams, X. F. Wang, G. Wu, X. H. Chen, and J. E. Hoffman. Phys. Rev. Lett. 102, 097002 (2009).
- (3) A. V. Chubukov, M. G. Vavilov, and A. B. Vorontsov. Phys. Rev. B 80, 140515 (2009).
- (4) H. Q. Yuan, J. Singleton, F. F. Balakirev, S. A. Baily, G. F. Chen, J. L. Luo, and N. L. Wang, Nature 457, 33 (2009).
- (5) G. Blatter, M.V. Feigel′man, V.B. Geshkenbein, A.I. Larkin and V.M. Vinokur, Rev. Mod. Phys. 66 1125 (1994).
- (6) R. Prozorov, N. Ni, M. A. Tanatar, V. G. Kogan, R. T. Gordon, C. Martin, E. C. Blomberg, P. Prommapan, J. Q. Yan, S. L. Bud’ko, and P. C. Canfield, Phys. Rev. B 78, 224506 (2008).
- (7) C. J. van der Beek, G. Rizza, M. Konczykowski, P. Fertey, I. Monnet, Thierry Klein, R. Okazaki, M. Ishikado, H. Kito, A. Iyo, H. Eisaki, S. Shamoto, M. E. Tillman, S. L. Bud’ko, P. C. Canfield, T. Shibauchi, and Y. Matsuda, Phys. Rev. B 81, 174517 (2010).
- (8) Ni Ni, Jared M. Allred, Benny C. Chan, and Robert Joseph Cava, PNAS 108, E1019 (2011).
- (9) S. Kakiya, K. Kudo, Y. Nishikubo, K. Oku, E. Nishibori, H. Sawa, T. Yamamoto, T. Nozaka, and M. Nohara, J. Phys. Soc. Japan 80, 093704 (2011).
- (10) C. Löhnert, T. Stürzer, M. Tegel, R. Frankovsky, G. Friederichs, and D. Johrendt, Angew. Chem. Int. Ed., 50, 9195 (2011).
- (11) M. Neupane, C. Liu, S.-Y. Xu, Y. J. Wang, N. Ni, J. M. Allred, L. A. Wray, H. Lin, R. S. Markiewicz, A. Bansil, R. J. Cava, M. Z. Hasan, e-print arXiv:1110.4687v1 (2011).
- (12) A. Gurevich, Rep. Prog. Phys. 74 124501 (2011).
- (13) N. Ni, M. E. Tillman, J.-Q. Yan, A. Kracher, S. T. Hannahs, S. L. Budko, and P. C. Canfield, Phys. Rev. B 78, 214515 (2008).
- (14) L. Luan, O. M. Auslaender, T. M. Lippman, C. W. Hicks, B. Kalisky, J. H. Chu, J. G. Analytis, I. R. Fisher, J. R. Kirtley, and K. A. Moler, Phys. Rev. B 81, 100501(R) (2010).
- (15) E. Nazaretski, J. P. Thibodaux, I. Vekhter, L. Civale, J. D. Thompson, and R. Movshovich, Appl. Phys. Lett. 95, 262502 (2009).
- (16) K. Cho, M. A. Tanatar, H. Kim, W. E. Straszheim, N. Ni, R. J. Cava, and R. Prozorov, Phys. Rev. B 85, 020504(R) (2012).
- (17) E. Nazaretski, K. S. Graham, J. D. Thompson, J. A. Wright, D. V. Pelekhov, P. C. Hammel, and R. Movshovich, Rev. Sci. Instrum. 80, 083704 (2009).
- (18) A SSS-QMFMR cantilever, Nanosensors, Inc, www.nanoandmore.com/USA/AFM-Probe-SSS-QMFMR.html.
- (19) The maximum force gradient at the center of a vortex, max() (MFM is sensitive to a force gradient), is proportional to for a monopole-monopole model of the tip-vortex interaction. In this model, the larger value of results in a smaller force gradient at the center of a vortex.
- (20) O. M. Auslaender, L. Luan, E. W. J. Straver, J. E. Hoffman, N. C. Koshnick, E. Zeldov, D. A. Bonn, R. Liang, W. N. Hardy, and K. A. Moler, Nature Phys., 5 35 (2009).
- (21) E. W. J. Straver, J. E. Hoffman, O. M. Auslaender, D. Rugar, and Kathryn A. Moler, Appl. Phys. Lett. 93, 172514 (2008).
- (22) Lan Luan, Ophir M. Auslaender, Nadav Shapira, Douglas A. Bonn, Ruixing Liang, Walter N. Hardy, Kathryn A. Moler, e-print arXiv:1103.6072v1.
- (23) T. Shapoval, H. Stopfel, S. Haindl, J. Engelmann, D. S. Inosov, B. Holzapfel, V. Neu, and L. Schultz, Phys. Rev. B 83, 214517 (2011).
- (24) M. Tinkham, Introduction to Superconductivity (McGraw Inc., NY, 1975).
- (25) T. K. Kim, A. N. Yaresko, V. B. Zabolotnyy, A. A. Kordyuk, D. V. Evtushinsky, N. H. Sung, B. K. Cho, T. Samuely, P. Szabó, J. G. Rodrigo, J. T. Park, D. S. Inosov, P. Samuely, B. Büchner, and S. V. Borisenko, Phys. Rev. B 85, 014520 (2012).
- (26) Y. J. Uemura, G. M. Luke, B. J. Sternlieb, J. H. Brewer, J. F. Carolan, W. N. Hardy, R. Kadono, J. R. Kempton, R. F. Kiefl, S. R. Kreitzman, P. Mulhern, T. M. Riseman, D. Ll. Williams, B. X. Yang, S. Uchida, H. Takagi, J. Gopalakrishnan, A. W. Sleight, M. A. Subramanian, C. L. Chien, M. Z. Cieplak, Gang Xiao, V. Y. Lee, B. W. Statt, C. E. Stronach, W. J. Kossler, and X. H. Yu, Phys. Rev. Lett. 62, 2317 (1989).
- (27) H. Luetkens, H.-H. Klauss, R. Khasanov, A. Amato, R. Klingeler, I. Hellmann, N. Leps, A. Kondrat, C. Hess, A. Köhler et al., Phys. Rev. Lett. 101, 097009 (2008).
- (28) Jeehoon Kim et al., unpublished.
- (29) J. D. Fletcher, A. Carrington, P. Diener, P. Rodiere, J. P. Brison, R. Prozorov, T. Olheiser, and R. W. Giannetta, Phys. Rev. Lett. 98, 057003 (2007).
- (30) D. M. Broun, W. A. Huttema, P. J. Turner, S. Özcan, B. Morgan, R. Liang, W. N. Hardy, and D. A. Bonn, Phys. Rev. Lett. 99, 237003 (2007).
- (31) Yuri Zuev, Mun Seog Kim, and Thomas R. Lemberger, Phys. Rev. Lett. 95, 137002 (2005).
- (32) M. Franz, C. Kallin, A. J. Berlinsky, and M. I. Salkola, Phys. Rev. B 56, 7882 (1997).
- (33) T. Das, J. X. Zhu, and M. J. Graf, Phys. Rev. B 84, 134510 (2011).
- (34) J. M. Kosterlitz and D. J. Thouless, J. Phys. C 6, 1181 (1973); V. L. Berezinskii, Sov. Phys. JETP 32, 493 (1971).
- (35) N. R. Werthamer, E. Helfand, and P. C. Hohenberg, Phys. Rev. 147, 295 (1966).