Constraining stellar assembly and AGN feedback at the peak epoch of star formation
Abstract
We study stellar assembly and feedback from active galactic nuclei (AGN) around the epoch of peak star formation (), by comparing hydrodynamic simulations to rest-frame -optical galaxy colours from the Wide Field Camera 3 (WFC3) Early-Release Science (ERS) Programme. Our Adaptive Mesh Refinement simulations include metal-dependent radiative cooling, star formation, kinetic outflows due to supernova explosions, and feedback from supermassive black holes. Our model assumes that when gas accretes onto black holes, a fraction of the energy is used to form either thermal winds or sub-relativistic momentum-imparting collimated jets, depending on the accretion rate. We find that the predicted rest-frame -optical colours of galaxies in the model that includes AGN feedback are in broad agreement with the observed colours of the WFC3 ERS sample at . The predicted number of massive galaxies also matches well with observations in this redshift range. However, the massive galaxies are predicted to show higher levels of residual star formation activity than the observational estimates, suggesting the need for further suppression of star formation without significantly altering the stellar mass function. We discuss possible improvements, involving faster stellar assembly through enhanced star formation during galaxy mergers while star formation at the peak epoch is still modulated by the AGN feedback.
keywords:
galaxies: formation – galaxies: high-redshift – ultraviolet: galaxies1 Introduction
The present-day galaxy luminosity function shows a rapid turnover at luminosity (Cole et al., 2001), while CDM cosmology predicts a power-law form for the dark matter halo mass function (Jenkins et al., 2001). The low mass-to-light ratio in low- and high-mass halos is interpreted as evidence for the existence of baryonic feedback, that regulates star formation (e.g. Binney, 2004). Consensus favours a picture in which energy from active galactic nuclei (AGN) regulates the formation of massive galaxies (e.g. Ciotti & Ostriker, 1997; Kaviraj et al., 2011a), despite the significant difference in the scale of a supermassive black hole (SMBH) from that of its host galaxy. This picture appears to be supported by the tight observed correlation between SMBH mass and the bulge of its host galaxy (e.g. Häring & Rix, 2004), evidence for the suppression of gas cooling and star formation due to AGN interaction with the interstellar/intracluster medium (e.g. McNamara & Nulsen, 2007), high-velocity galactic outflows that are commonly detected in quasars (Pounds et al., 2003; Ganguly & Brotherton, 2008) and X-ray cavities inflated by radio jets, associated with AGN, that are observed in cluster centres (Fabian et al., 2006). Nevertheless, it is still unclear as to how, to what extent, and at what epochs, AGN feedback shapes the star formation history (SFH) of galaxies in the Universe.
Several studies have used semi-analytic or fully hydrodynamic models of galaxy formation, to understand the effect of negative feedback on the cosmic SFH (e.g. Fontanot et al., 2009). While detailed physical ingredients and prescriptions differ in each model, such studies agree on the importance of AGN feedback for reproducing the masses, colours, and star formation rates (SFRs) of local massive galaxies (e.g. Kimm et al., 2009). However, the comparisons are almost exclusively performed in the nearby Universe, while the bulk of the stellar assembly in these galaxies takes place at high redshift (). Unfortunately, 8-10 Gyrs of evolution can easily wash out many of the details of stellar assembly, and thus it is necessary to investigate the epoch at which the bulk of the star formation takes place () (Madau et al., 1998). Confronting the observed galaxy colours with the models at these epochs represents a more stringent test of their reliability.
In this Letter, we study the stellar assembly in massive galaxies, by comparing a fully hydrodynamical cosmological simulation to rest-frame UV-optical galaxy colours from the WFC3 Early Release Science (ERS) programme (Windhorst et al., 2011). The rest-frame UV (shortward of 3000Å), which is sensitive to even residual amounts of star formation, is a powerful tracer of how quiescent a galaxy is (e.g. Kaviraj et al., 2011b; Rutkowski et al., 2012), enabling us to constrain the quenching of star formation due to AGN and stellar feedback. By contrast, the rest-frame optical colours constrain the average epoch of stellar mass assembly. This is the first direct comparison to simulations of rest-frame UV-optical colours at the epoch of peak star formation. We describe the data and simulations in § 2 and 3 respectively. We present the comparison between observations and models in § 4, and discuss the implications of our results on galaxy formation in § 5. Throughout, we adopt following the WMAP-3 results (Hinshaw et al., 2009). All fluxes are based on the AB magnitude system.
2 Observations
The WFC3 ERS programme (Windhorst et al., 2011) has imaged 1/3 of the GOODS-South field (45 arcmin2), using the WFC3 F225W, F275W, F336W, F098M, F125W, and F160W filters, with exposure times of 1-2 orbits per filter. In combination with the existing GOODS BViz coverage (Giavalisco et al., 2004), this provides 10-filter panchromatic coverage (0.2–1.7 ) to point source depths of AB 26.5–27.5 mag (UV–IR, 5). Here, we study 188 and 151 galaxies with , for comparisons at and respectively. Note that the ERS sample is complete down to and the observed images that trace both the rest frame UV and the rest frame optical are deep enough for all massive galaxies to be detected (Windhorst et al., 2011). For every galaxy, photometric redshifts were calculated using EAZY, based on all 10 filters with all possible combinations of pairs of the EAZY_v1.0 templates (Brammer et al., 2008). The absorption due to intervening intergalactic HI clouds is taken into consideration. No redshift prior probability distribution specific to these fields is used. The resulting mean reduced of the fit is 0.94, and the typical redshift uncertainty of the sample is . We note that no k-correction is applied to the observed sample, and that we refer the rest-frame UV and optical fluxes to the fluxes through the WFC3/ACS bandpass that roughly trace the GALEX or Johnson /. Thus our estimated rest-frame or optical fluxes are slightly different from GALEX or Johnson / fluxes.
In addition, the full suite of WFC3/ACS photometry of each galaxy is compared to a library of exponentially decaying model star formation histories, based on the Bruzual & Charlot (2003) stellar models. A wide range of ages (0.001–13 Gyr), decay timescales (0.1–9 Gyr), metallicities (0.005–2 ) and dust extinctions are employed, with the normalisation of the models yielding the stellar mass. The likelihood of individual models () are calculated and parameters are marginalised. The median of the marginalised probability distributions are taken to be the best estimates, with the 25 and 75 percentile values (which enclose 50% of the total probability) providing an associated uncertainty (see e.g. Kaviraj et al., 2011b). Specific SFRs (SSFRs) and stellar masses thus derived have uncertainties of 0.3 dex.
3 Simulation
In this paper, we use the octree-based Eulerian hydrodynamics code, Ramses (Teyssier, 2002). Metal-dependent radiative cooling is modelled based on Sutherland & Dopita (1993), and a uniform UV background is instantaneously turned on at following Haardt & Madau (1996). Star particles are created following a Schmidt law with 2% efficiency, when the density of a gas cell reaches a critical density, . We use the polytropic equation of state for the gas above the threshold density, with the minimum temperature of . Massive stars are assumed to lose their mass through stellar winds and a supernova phase, dispersing gas and metals (18% and 2% by mass, respectively) into their surroundings. Feedback is modelled as an isotropic kinetic outflow, which carries matter amounting to ten times the mass loss from the stars (Dubois & Teyssier, 2008).
Our model assumes that seed BHs of form in regions of high gas density, ensuring that only one BH is formed per galaxy (Dubois et al., 2012). The growth of the BH is tracked self-consistently, based on a modified Bondi-Holye-Lyttleton accretion rate. We adopt a density-dependent boost factor , following Booth & Schaye (2009). When gas accretes onto BHs, we assume that a central BH can impact the ambient gas in two ways, depending on the Eddington ratio (). For a high accretion rate (), 1.5% of the accretion energy is injected as thermal energy (quasar-like mode), whereas sub-relativistic () momentum-imparting collimated winds are launched for a low accretion rate () event with 10% efficiency (Dubois et al., 2012). The parameters are chosen to match the stellar baryon fraction in groups and clusters of galaxies (Dubois et al. in prep). In order to avoid artificial cooling and maximise the impact of AGN feedback, we store the thermal energy and kinetic energy until it either reaches K or the energy corresponding to 10% of the BH mass. Therefore, the efficiency of the two modes should be regarded as a rough estimate, not a true efficiency.
We have performed two cosmological simulations with the same initial conditions generated by mpgrafic (Prunet et al., 2008), a parallel version of the grafic package (Bertschinger, 2001). The simulations contain 2563 dark matter particles with in a 50 Mpc comoving periodic box. We fix the maximum spatial resolution to in physical units. The minimum mass of the star particles is . The virial mass of the most massive halo in our simulated volume is at . Note that the mass of dark matter halos used to compare with the observation in §4 is in the range , and hence our sample represents massive galaxies ( at ) forming in group/field environments. This allows for a fair comparison with the ERS sample, which is known to have few cluster galaxies (Windhorst et al., 2011). It is also worth mentioning that 36% of the simulated massive galaxies are bulge-dominated at , which seems compatible with the observed morphological fraction in the GOODS fields (Bundy et al., 2005).
Predicted colours of simulated galaxies are generated by folding the stellar spectra of individual star particles with the stellar population models of Bruzual & Charlot (2003). The optical depth is calculated following the empirical calibration of Guiderdoni & Rocca-Volmerange (1987), and dust attenuation is calculated using the Cardelli et al. (1989) extinction curve (Devriendt et al., 2010, Eq. 1). We emphasise that the attenuated spectra of the simulated galaxies are redshifted to either or before convolving them with the throughput of WFC3/ACS filters to directly compare with ERS galaxies.
4 Results
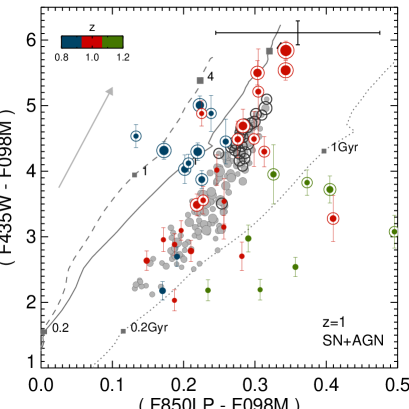
In Fig. 1 we present the rest-frame UV and optical colours of ERS galaxies around . We use the ACS F435W, F850LP, and WFC3 F098M filters to trace the rest-frame (2300Å), , and bands, respectively. In order to test the influence of AGN feedback, we restrict our sample to galaxies more massive than because SN feedback is ineffective in such large potential wells, leaving AGN feedback as the most plausible mechanism for modulating star formation. Three reference lines are included in the figure to help distinguish the age and redshift sequence. Each line corresponds to a simple stellar population (SSP) with various ages (marked next to the line). Differences between the lines indicate the change in the colours when a spectrum is redshifted to different values before it is convolved with the filter throughputs ( 0.8, 1.0, and 1.2 [left panel] or 1.7, 2.0, and 2.3 [right panel]). Observed galaxies show a large scatter in and colours, partly because no k-correction is applied. When the redshift interval of the sample is constrained around , a colour sequence is apparent (red points), with massive galaxies being redder in both UV and optical colours.
To make a detailed comparison, we study the SSFRs derived from SED fitting (see Section 2), marking ‘quiescent’ (SSFR ) galaxies in our sample with a concentric circle in Fig. 1. We find that almost all massive galaxies with mag are quiescent. It is worth emphasising here that this provides a stringent test for any cosmological galaxy formation model, since such low SSFRs are comparable to those of nearby ‘red and dead’ galaxies (e.g. Kimm et al., 2009). Thus, any process that shapes the star formation history of massive galaxies must be powerful enough to quench star formation at this early epoch.
We find that the simulated galaxies with AGN feedback agree reasonably well with the observed sequence at . The left-hand panel of Fig. 1 indicates that a majority of model galaxies with mag are indeed quiescent (double circles), but not due to dust reddening, indicating that AGN feedback is a plausible explanation for the emergence of quiescent galaxies at . However, in the absence of AGN feedback almost all model galaxies are predicted to be actively star forming (Fig. 2), suggesting that gravitational heating by substructure alone (e.g. Khochfar & Ostriker, 2008) is not able to account for the build-up of quiescent galaxies in group/field environments at this epoch (see also Johansson et al., 2012). Note that such interactions between infall of substructure and the interstellar/intracluster medium is automatically accounted for in our hydrodynamic calculations. We also see that the model with AGN feedback reproduces the observed trend of blue galaxies ( mag) being less massive. However, there is an indication that massive galaxies with intermediate colours ( 3.5 mag) are more frequent than observed in the data (see the left panel in Fig. 1).
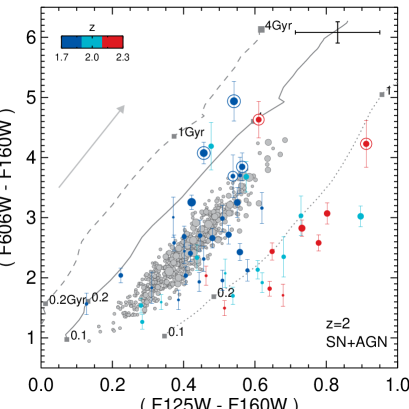
In Fig. 1 (right panel), we show the corresponding colour comparisons at . We only show galaxies with masses greater than , which form more than 90% of the progenitors of our model galaxy sample at . Since the redshift of the galaxy sample has changed, we now use the ACS F606W and the WFC3 F125W and F160W filters to trace the rest-frame , , and bands respectively. We find that our simulated galaxies at compare better with WFC3 galaxies at rather than . We suspect that this is due, in part, to a systematic underestimation of the photometric redshifts at these epochs (see also Williams et al., 2009). Note that the observed galaxies at are comparable to the model galaxies at , given the typical uncertainty of EAZY redshifts at these epochs (). At we find that there exists a non-negligible number of massive galaxies with a very low level of star formation activity, which are absent in the run with AGN feedback. The massive galaxies () in the model are actively star forming (SSFR), leading to colours () that are inconsistent with the observations.
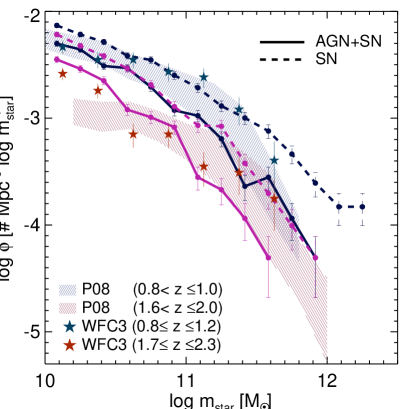
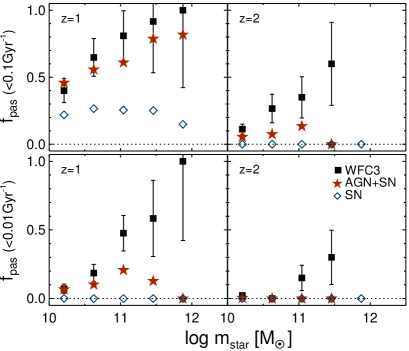
Fig. 2 shows the fraction of passive galaxies, which confirms that the modelled recent star formation needs to be further suppressed in massive galaxies at . While our simulation predicts that 20 % of massive galaxies have SSFR at , the observations suggest that 30–60% of the massive galaxy population is passive (top right). At , a majority (60–80%) of the massive galaxies in the model have become passive (top left), but when a more conservative definition for a passive galaxy is used (SSFR), we find that the passive fraction in the model drops to approximately 0–20% (bottom left). This is inconsistent with the observations, which suggest that 50–100% of massive galaxies are quiescent at this epoch.
Nevertheless, the impact of AGN feedback becomes clearly visible in the stellar mass functions (see Fig. 3). The number of massive galaxies in the AGN run (; solid lines) are systematically smaller than the run without AGN (dashed lines) by a factor of 3. Comparing twin halos that share position and mass in the feedback/no feedback runs, we find that the stellar masses of the galaxies they host are reduced by a factor of 2–5, meaning that the mass functions are shifted horizontally (to the left) due to AGN feedback. The mass functions are in reasonable agreement with the stellar mass function estimated by Pérez-González et al. (2008) (red and blue shadings), and also compatible with the simple number counts from the WFC3 galaxies at (orange stars) or (blue stars).
One may wonder whether our AGN feedback recipe is too strong, given the apparent deficit of the most massive galaxies. However, this can be partly attributed to the absence of density fluctuations on scales comparable to the size of the simulation (Sirko, 2005; Gnedin et al., 2011). Moreover, the fact that we need further quenching of residual star formation in massive galaxies does not appear to favour moderating the impact of AGN feedback. We discuss this issue further in the next section.
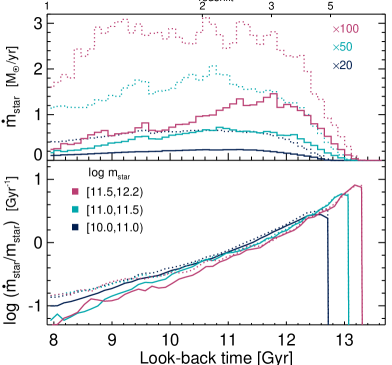
Finally, in agreement with the downsizing picture (Cowie et al., 1996), we find that in the run with AGN feedback, the star formation histories of more massive galaxies are peaked at higher redshift (solid lines in the upper panel of Fig. 4). This can also be seen in the bottom panel, where we plot the median SSFR of 1127, 117, and 29 galaxies in three mass bins, , , and , as a function of look-back time. If we compare the galaxy SFHs in the runs with (solid lines in the top panel) and without AGN feedback (dotted lines), we see that star formation is preferentially suppressed at at which the bulk of the star formation takes place (Madau et al., 1998).
Interestingly, we see that the most massive galaxies have an extended SFH, which may, at first sight, seem inconsistent with the high observed [/Fe] ratios in local systems (e.g. Thomas et al., 2005). However, we note that it is the star formation timescale in the subunits that finally merge to form the larger galaxy that determines its average [/Fe]. In other words it is not possible to directly infer the [/Fe] from a ‘composite’ SFH of the various subunits (such as the one shown in Fig. 4), because much of the broadness of the SFH is driven by the fact that star formation peaks at different epochs in different subunits. Hence, the degree of the discrepancy may not be substantial as it appears, and will be tested with more detailed chemo-hydrodynamic simulations in a forthcoming paper.
5 Discussion and Conclusions
We have presented the first direct comparison of the rest-frame UV-optical colours of massive galaxies at to the predictions of hydrodynamic simulations that include AGN feedback. We have shown that massive galaxies in the simulations are actively star forming at this redshift in the absence of a strong source of energetic feedback. In an attempt to estimate the stellar assembly of massive galaxies, we have incorporated a simple, jet/quasar-mode AGN feedback (Dubois et al., 2012), and found that it reproduces a reasonable fraction of moderately quiescent galaxies in both rest-frame UV and optical colours at . However, the model slightly overpredicts the level of recent star formation activity in massive galaxies at and 2, compared with the observations. Despite this, the stellar mass functions in the model with AGN feedback agree reasonably well with the WFC3 ERS data (within the statistical uncertainties), due to the efficient quenching of star formation during the epoch of peak star formation.
The lack of massive, quiescent galaxies in the model seems to require further suppression of residual star formation without significantly altering the stellar mass function. This suggests that the peak epoch of the stellar assembly in massive galaxies should commence earlier than we have predicted, while the residual star formation must decline more sharply over time. Although further star formation quenching is attainable by introducing more enhanced feedback or other processes that we have ignored (e.g. photoionisation of gas coolants due to soft X-ray and extreme UV photons from stars, Cantalupo 2010), changing the peak epoch of stellar assembly, while keeping the stellar mass function fixed may require well-balanced interplay between feedback and star formation.
Regarding the extended nature of the predicted SFHs, a different approach, involving a higher level of star formation activity in the very early universe (e.g. Stark et al., 2009) is also appealing. The advantages of this idea are 1) it does not violate the stellar mass functions at , 2) it alleviates the discrepancy in [/Fe] ratio in massive galaxies to some degree (e.g. Pipino et al., 2009), although other routes, such as the use of a top-heavy IMF may offer more promising solutions (Arrigoni et al., 2010)), and 3) star formation can be efficiently suppressed with the same amount of energy released from the black holes by consuming gas earlier on. Even though the physical origin of such high specific star formation rates is unclear, we note that proper modelling of gas fragmentation in galaxy mergers can easily elevate star formation by an order of magnitude (Teyssier et al., 2010), and may even be able to match the observed high SSFRs in the early universe (e.g. Khochfar & Silk, 2011).
We also note that the mass and spatial resolution of a simulation plays a role in determining the star formation history of the model galaxies. Adopting a better resolution allows us to resolve smaller halos in the early universe (), leading to earlier star formation, with an order of magnitude enhancement in the star formation activity at this epoch (Rasera & Teyssier, 2006). This will naturally increase the mean age of the massive galaxies (e.g. Johansson et al., 2012). However, the question is how many stars form during this epoch, compared to the total stellar mass at or 2. Inspection of the top panel of Fig. 4 shows that an order of magnitude increase in the SFR at will not significantly affect the overall SFHs.
Given the simplicity of our modelling of AGN feedback, the agreement between observations and models is encouraging. An important challenge will be to match chemical abundance ratios in massive galaxies, while producing the correct number of red and dead galaxies at high redshift. In a forthcoming paper we will investigate these issues in detail, focussing on more realistic modelling of the starburst phases and the interplay between feedback and star formation at high redshift.
Acknowledgements
The simulations were carried out on the DiRAC facility, funded by STFC, the Large Facilities Capital Fund of BIS and the University of Oxford. TK acknowledges support from a Clarendon DPhil studentship. JD and AS’s research is supported by Adrian Beecroft, the Oxford Martin School and the STFC. This paper is based on Early Release Science observations made by the WFC3 Scientific Oversight Committee. We are grateful to the Director of the Space Telescope Science Institute, Dr. Matt Mountain, for generously awarding Director’s Discretionary time for this program.
References
- Arrigoni et al. (2010) Arrigoni M., Trager S. C., Somerville R. S., Gibson B. K., 2010, MNRAS, 402, 173
- Bertschinger (2001) Bertschinger E., 2001, ApJS, 137, 1
- Binney (2004) Binney J., 2004, MNRAS, 347, 1093
- Booth & Schaye (2009) Booth C. M., Schaye J., 2009, MNRAS, 398, 53
- Brammer et al. (2008) Brammer G. B., van Dokkum P. G., Coppi P., 2008, ApJ, 686, 1503
- Bruzual & Charlot (2003) Bruzual G., Charlot S., 2003, MNRAS, 344, 1000
- Bundy et al. (2005) Bundy K., Ellis R. S., Conselice C. J., 2005, ApJ, 625, 621
- Cantalupo (2010) Cantalupo S., 2010, MNRAS, 403, L16
- Cardelli et al. (1989) Cardelli J. A., Clayton G. C., Mathis J. S., 1989, ApJ, 345, 245
- Ciotti & Ostriker (1997) Ciotti L., Ostriker J. P., 1997, ApJL, 487, L105+
- Cole et al. (2001) Cole S. et al., 2001, MNRAS, 326, 255
- Cowie et al. (1996) Cowie L. L., Songaila A., Hu E. M., Cohen J. G., 1996, AJ, 112, 839
- Devriendt et al. (2010) Devriendt J. et al., 2010, MNRAS, 403, L84
- Dubois et al. (2012) Dubois Y., Devriendt J., Slyz A., Teyssier R., 2012, MNRAS, 420, 2662
- Dubois & Teyssier (2008) Dubois Y., Teyssier R., 2008, A&A, 477, 79
- Fabian et al. (2006) Fabian A. C., Sanders J. S., Taylor G. B., Allen S. W., Crawford C. S., Johnstone R. M., Iwasawa K., 2006, MNRAS, 366, 417
- Fontanot et al. (2009) Fontanot F., De Lucia G., Monaco P., Somerville R. S., Santini P., 2009, MNRAS, 397, 1776
- Ganguly & Brotherton (2008) Ganguly R., Brotherton M. S., 2008, ApJ, 672, 102
- Giavalisco et al. (2004) Giavalisco M., , et al., 2004, ApJL, 600, L93
- Gnedin et al. (2011) Gnedin N. Y., Kravtsov A. V., Rudd D. H., 2011, ApJS, 194, 46
- Guiderdoni & Rocca-Volmerange (1987) Guiderdoni B., Rocca-Volmerange B., 1987, A&A, 186, 1
- Haardt & Madau (1996) Haardt F., Madau P., 1996, ApJ, 461, 20
- Häring & Rix (2004) Häring N., Rix H.-W., 2004, ApJL, 604, L89
- Hinshaw et al. (2009) Hinshaw G. et al., 2009, ApJS, 180, 225
- Jenkins et al. (2001) Jenkins A., Frenk C. S., White S. D. M., Colberg J. M., Cole S., Evrard A. E., Couchman H. M. P., Yoshida N., 2001, MNRAS, 321, 372
- Johansson et al. (2012) Johansson P. H., Naab T., Ostriker J. P., 2012, astro-ph/1202.3441J
- Kaviraj et al. (2011a) Kaviraj S., Schawinski K., Silk J., Shabala S. S., 2011a, MNRAS, 415, 3798
- Kaviraj et al. (2011b) Kaviraj S., Tan K.-M., Ellis R. S., Silk J., 2011b, MNRAS, 411, 2148
- Khochfar & Ostriker (2008) Khochfar S., Ostriker J. P., 2008, ApJ, 680, 54
- Khochfar & Silk (2011) Khochfar S., Silk J., 2011, MNRAS, 410, L42
- Kimm et al. (2009) Kimm T. et al., 2009, MNRAS, 394, 1131
- Madau et al. (1998) Madau P., Pozzetti L., Dickinson M., 1998, ApJ, 498, 106
- McNamara & Nulsen (2007) McNamara B. R., Nulsen P. E. J., 2007, ARA&A, 45, 117
- Pérez-González et al. (2008) Pérez-González P. G. et al., 2008, ApJ, 675, 234
- Pipino et al. (2009) Pipino A., Devriendt J. E. G., Thomas D., Silk J., Kaviraj S., 2009, A&A, 505, 1075
- Pounds et al. (2003) Pounds K. A., Reeves J. N., King A. R., Page K. L., O’Brien P. T., Turner M. J. L., 2003, MNRAS, 345, 705
- Prunet et al. (2008) Prunet S., Pichon C., Aubert D., Pogosyan D., Teyssier R., Gottloeber S., 2008, ApJS, 178, 179
- Rasera & Teyssier (2006) Rasera Y., Teyssier R., 2006, A&A, 445, 1
- Rutkowski et al. (2012) Rutkowski M. J. et al., 2012, ApJS, 199, 4
- Sirko (2005) Sirko E., 2005, ApJ, 634, 728
- Stark et al. (2009) Stark D. P., Ellis R. S., Bunker A., Bundy K., Targett T., Benson A., Lacy M., 2009, ApJ, 697, 1493
- Sutherland & Dopita (1993) Sutherland R. S., Dopita M. A., 1993, ApJS, 88, 253
- Teyssier (2002) Teyssier R., 2002, A&A, 385, 337
- Teyssier et al. (2010) Teyssier R., Chapon D., Bournaud F., 2010, ApJL, 720, L149
- Thomas et al. (2005) Thomas D., Maraston C., Bender R., Mendes de Oliveira C., 2005, ApJ, 621, 673
- Williams et al. (2009) Williams R. J., Quadri R. F., Franx M., van Dokkum P., Labbé I., 2009, ApJ, 691, 1879
- Windhorst et al. (2011) Windhorst R. A. et al., 2011, ApJS, 193, 27