Physics of Polymorphic Transitions in CeRuSn
Abstract
We report a detailed study of the polymorphic transitions in ternary stannide CeRuSn on high quality single crystals through a combination of X–ray diffraction experiments conducted at 300, 275 and 120 K, and measurements of the thermal expansion, magnetization, and resistivity, along main crystallographic axes. In addition, the transition was followed as a function of pressure up to 0.8 GPa. The present X–ray diffraction data show that the room temperature polymorph consists of the lattice doubled along the axis with respect to the CeCoAl-type structure consistent with previous reports. Upon cooling, the compound undergoes two successive transitions, first to a quintuple ( K) and than to a triple CeCoAl superstructure at K. The transitions are accompanied by a tremendous volume change due to a strong shrinking of the lattice along the axis, which is clearly observed in thermal expansion. We advance arguments that the volume collapse originates from an increasing number of crystallographically inequivalent Ce sites and the change of ratio between the short and long Ce–Ru bonds. The observed properties of the polymorphic transition in CeRuSn are reminiscent of the transition in elementary Cerium, suggesting that similar physics, i.e. , a Kondo influenced transition and strong lattice vibrations might be the driving forces.
pacs:
71.27.+a,61.50.Ks,81.30.Hd,62.50.-pI Introduction
The 4f electron in Cerium is energetically weakly bound
despite the fact that it resides deep within the core of the atom.
This is due to the relatively extended nature of the 4f
wave function. Strong correlations between the Ce 4f
electron and hybridization between the 4f state with
those of the ligand states arise in Ce compounds and hence the
local environment of the Ce-atom dictates whether this electron
will remain bound within the core (Ce3+ state), join the
spatially extended valence electrons (Ce4+ state), or reside
with certain probability in each. In the last case, the atom is
said to be in an “intermediate valent” state with fluctuating
charge occupancy of the 4f shell
state.Sereni1982 ; Johansson1987 ; Malterre1989 The fragile
character of the 4f electron due to its sensitivity on
interatomic distances, as this determines the hybridization
strength, is capitalized on for example investigating quantum
critical phenomena, where by either applying hydrostatic pressure
or chemical substitution the unit-cell volume shrinks or expands
with the result that ground state of the material under
investigation changes.Loehn2007
Knowledge about the electronic structure and understanding its
relation to the physical properties observed in intermetallics, and
in particular rare earth based compounds is an ambitious
undertaking in condensed matter research. Investigation by varying
the properties utilizing pressure or chemical substitution is one
way. In addition, some compounds exist in more than one
crystallographic structure.Ghad1988 By means of pressure
and/or temperature it is possible to convey one into the other
reversibly. Such polymorphic transitions allow for comparative
study.Mihalik2010 The chemical composition is retained but
bonds of the individual atoms and therefore, the overall
electronic structure and related physical properties can differ
significantly. An example is LaIr2Si2. Polymorphism of LaIr2Si2 between
a high-temperature phase of the primitive tetragonal
CaBe2Ge2-type structure and a low-temperature phase of the
body-centered tetragonal ThCr2Si2-type structure has been
demonstrated by Braun et al..Braun1983 Notably, the
high-temperature modification displays superconductivity below
1.6 K, while the low-temperature phase is
normal down to 1 K.
The polymorphic isostructural (fcc)
(fcc) transition in elementary Cerium Bridgman1948 is
illustrative for the difficulty in understanding the complexity
between “chemical bonds”, “physical properties” and “structural
transition” especially in materials with electrons near the
boundary between itinerant and localized
behavior.Koskenmake1978 The transition involves a large
volume collapse of % at room temperature and pressure
GPa. A general consensus exists to attribute the
transition to an instability of the Ce 4f electron.
However, Johansson Johansson1974 explained the transition as sort of Mott transition in which
the localized 4f electrons in the -phase become
itinerant and participate in bonding in the lower volume -phase.
This model continues to compete with the
Kondo-volume-collapse scenario,Allen1982 ; Allen1992 which
assumes that the 4f electron is localized in both the
- and -phases. The loss of magnetic moment in the
-phase results from screening of the moments by the
surrounding conduction electrons. To complicate, latest neutron
and X–ray diffraction studies acknowledge the importance
of lattice vibrations as well.Jeong2004 ; Lipp2008
In many aspects the recently observed polymorphic transition in
the equiatomic stannide CeRuSn seems to have much in common with
the
transition in Cerium.
CeRuSn at room temperature crystallizes in a superstructure
modification of the monoclinic CeCoAl-type crystal structure (new
monoclinic type, space group C2/) with lattice parameters Å , Å , Å , and
.Riecken2007 As a consequence of
this doubling of the original CeCoAl unit cell along the axis,
the compound possesses two crystallographic independent cerium
sites labelled Ce1 and Ce2. Although topology of both Cerium sites
is identical, five rhodium, six tin, and six cerium atoms in the
coordination shell, the tiny changes in interatomic distances,
most notably the Ce–Ru bonds (Ce1–Ru: ranging from 2.33 to
2.46Å ; Ce2–Ru: ranging from 2.88 to 2.91 Å ) result in Ce1
being in intermediate valent state while Ce2 shows strong
localization of the f electron as suggested by magnetic
susceptibility experiments.Riecken2007 ; Mydosh2011 This
presumption is borne out by electronic structure
calculations Matar2007 and proven by X–ray absorption
near-edge structures (XANES) data.Feyerherm2012
Latest yields average valencies of 3.18 for Ce1 and Ce2.
The polymorphic transition in CeRuSn sets in just below room
temperature at K and is completed at around K upon cooling. The reverse transformation occurs on heating
with K and K as the onset and end
temperatures, respectively. Initial measurements of the magnetic
susceptibility, specific heat, thermopower, and resistivity were
performed on polycrystalline samples.Mydosh2011 The
transformation was smeared out and manifested as broad hysteresis
with a cusp-like structure in resistivity, a step-like decrease of
the susceptibility, a broad hump in the specific heat and a strong
increase in thermopower. A detailed analysis of the transition by
means of synchotron X–ray diffraction experiments on a single
crystal revealed that the room temperature phase is replaced by a
set of close to commensurate modulations along the axis,
namely quintupling ( K) and (dominant) quadrupling
(below 210 K) before finalizing ( K) in an ill-defined
modulated ground state, which is close to a tripling of the basic
monoclinic CeCoAl-type structure.Feyerherm2012
The present work gives a detailed examination of the physical properties of the polymorphic transition of CeRuSnḞor this purpose, measurements were performed on high quality single crystals. The lower amount of crystal lattice defects, absence of grain boundaries and the ability to perform experiments along specific crystallographic orientations allows us to resolve details related to the transition and to attribute those signatures in the experiments to the respective modulation in the structure.
II Experimental Details
Sample preparation
Single crystals of CeRuSn were prepared in two stages. First a
polycrystalline button of the nominal 1:1:1 stoichiometry was
synthesized using elements of purity 3N Ce (Ce from Alpha Aesar
which was additionally purified by solid state electrotransport
techniqueCarlson1977 ), 4N Ru and 5N Sn as starting
materials. The reaction of the stoichiometric mixture of the
elements was performed on a water-cooled copper crucible in a
mono-arc furnace under 6N Argon atmosphere. The mass difference
before and after the reactions was negligible ( %). The
crystal was than grown utilizing a modified Czochralski technique;
the button was remelted in a tri–arc furnace under 6N Argon
protection atmosphere and a tungsten rod was used as a seed.
The quality of the single crystal was checked by X–ray Laue
back–scattering, which was also used for orienting the crystals
later on. The chemical composition was verified employing a Tescan
Mira I LMH scanning electron microscope (SEM). The instrument is
equipped with a Bruker AXS energy dispersive X–ray detector
(EDX). Within the accuracy of the device, no impurity phases were
resolved and the measurement confirmed the correct
1:1:1 stoichiometry.
Afterwards, the crystal was cut for further analysis. One piece
was pulverized and examined at room temperature by means of powder
X–ray diffraction (Bruker D8 Advance diffractometer with
Cu-Kα radiation with Å ). The
obtained diffraction patterns were refined by Rietveld analysis
using FULLPROF.Fullprof The analysis confirmed the CeCoAl
superstructure and the corresponding lattice parameters agreed
well with those values reported in
literature.Riecken2007
The other piece of the crystal was annealed at 700 ∘C for
one week in vacuum ( mbar) in order to
improve homogeneity. In the following, the whole characterization
procedure was repeated unveiling no significant differences.
Experimental setup
From the annealed single crystal a small piece was cut for
investigating the crystal structure by X–rays at defined
temperatures. Therefore, the approximately mm3 piece was placed inside a Lindemann capillary. The
capillary itself was mounted into a Bruker Apex II diffractometer
with Mo–Kα radiation ( Å ). In
order to reach lower temperatures, the capillary was inserted into
a flow of cold nitrogen gas. The crystal structure was resolved by
direct methods Sheldrick2007 and adjacent refinement was
done by
full–matrix least–squares based on .
Bulk properties were retrieved employing standard equipment. The
magnetization was measured in a MPMS7 (Quantum Design). Data were
collected in the temperature range from 1.8 to 350 K and in fields
up to 7 T. Resistivity, Hall resistivity, thermopower, thermal
conductivity were measured in a PPMS14 (Quantum Design) using the
respective optional accessories of the device. The temperature was
varied between 1.8 and 350 K and magnetic fields up to 14 T were
applied. The resistivity was measured using standard 4–point
technique. In order to reduce contact resistance, the 25 m
diameter Au–wires were spot welded onto the sample. Measurements
of the resistivity were performed at ambient and hydrostatic
pressure. For the later, the PPMS device was used only to control
temperature. The sample was loaded into a double cylinder
CuBe/NiCrAl pressure cell. Daphne 7373 oil was used as pressure
medium and the applied pressure was determined at
room temperature utilizing a manganin manometer.
The thermal expansion was measured in a temperature interval of
180–340 K. The sample was built into a miniature capacitance
cell.Rotter1998 The capacity was read out by an Andeen
Hagerling 2500A capacitance bridge. The cell was inserted into the
PPMS whose controlling was used to set temperature.
Most of the experiments were conducted on both, the as cast and the annealed single crystals. The quality of the crystals improved considerably by annealing. The resistivity behavior of the as cast crystals to some extent resembled the results of the polycrystalline sample presented in earlier workMydosh2011 that is a single broad hysteresis, which differs in detail depending on the current direction with respect to the crystallographic axis. On the contrary the annealed crystals exhibit two sharp transitions evident for two distinct transitions as will be discussed below. In addition, differences in the hysteresis of each of the transitions could be resolved. Results presented in this report were obtained on the annealed crystals. The bulk properties were measured with respect to the three principle crystallographic axes. Data shown have been collected on two batches. The resistivity and susceptibility experiments were performed on batch I, while for thermal expansion a piece from batch II was used. Hence, slight differences in the respective transition temperatures are observed, which we attribute to sample dependencies.
III Results
III.1 Measurement of bulk properties
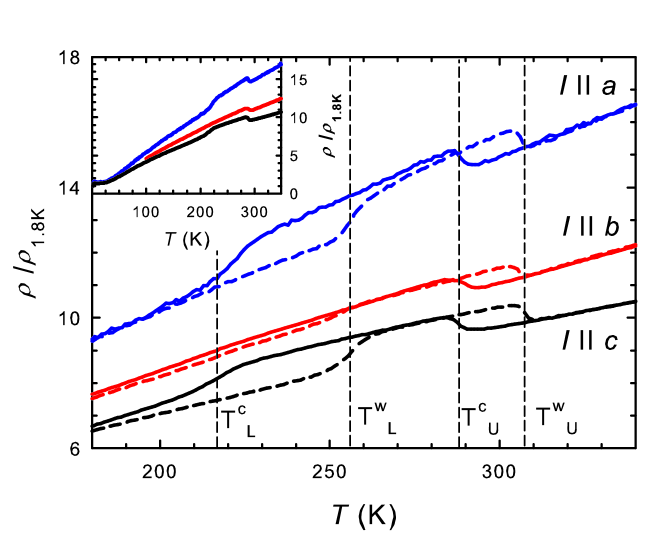
Figure 1 depicts the temperature dependence of the scaled
electrical resistivity for current
applied along the , and axis, respectively. The inset
shows the full temperature range. The different corresponding
values for document anisotropy of the electronic
transport in CeRuSn . Yielding
(for ) comparing to only for a polycrystalline sample proofs the high quality of our single
crystals. More remarkably, the observed behavior in resistivity
differs significantly from previously published work on a
polycrystalline sample.Mydosh2011 Cooling down the sample
(solid lines in Fig. 1) from above room temperature, the
resistivity undergoes a sharp step-like increase by about 7 %
just below 290 K. The anomaly, indicated by in the main
panel, is clearly seen in all applied current directions while
absent in the polycrystalline sample. Below 225 K a second
transition emerges marked by , and the resistivity seems to
fall back onto the original curve from before the first transition
( and ). The transition is weakly pronounced for
while decrease of the resistivity is only a
fraction of the increase at . Interestingly, this transition, although slightly shifted towards lower temperatures,
is observed in the polycrystal as well. However, contrary to our
data, resistivity increases. Below 3 K, resistivity reveals a
third anomaly, which can be attributed to the onset of
antiferromagnetic ordering reported earlier.Mydosh2011 In
the following, discussion on the antiferromagntic order is omitted
and focus is entirely on the
relevant temperature range of and .
Upon warming up (dashed lines in Fig. 1), both the lower,
K, and upper, K, transitions of
preserve shape and size of the step. However, they are
observed at much higher temperatures than their corresponding
anomalies when cooling down, i. e. , exhibiting large
temperature hysteresis. In comparison, hysteresis of the
lower-temperature transition yields K
almost double the hysteresis of the upper-temperature transition
K. These remarkable features in CeRuSn remain intact even in magnetic fields up to 14 T.
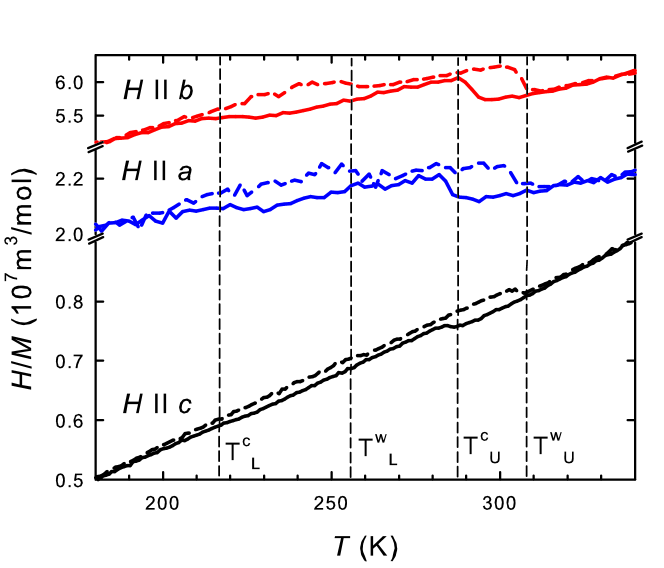
Figure 2 plots the temperature dependence (solid lines
refer to cooling down, dashed lines for warming up sequence,
respectively) of the inverse dc magnetic susceptibility,
, in fields applied along the principle crystallographic
axes. The magnetic susceptibility is strongly anisotropic
apparently due to the influence of the very low–symmetry crystal
electric field (CEF) on the orbitals of the Ce–ion. The
transitions at and when cooling down, and and
when warming up CeRuSn are clearly witnessed by a small
negative step in the magnetization, i. e., a positive jump in
. Note that the polycrystalline sample shows only a
single step upon cooling at K.Riecken2007 ; Mydosh2011 The lower transitions, and are much weaker than the upper ones.
Short temperature intervals that are above and between and prevent a meaningful qualitative analysis of the
temperature dependence of each of the separate paramagnetic
phases. Quantitatively, assuming the effective moment remains
conserved across the transitions, a reasonable assumption
recalling that XANES unveil no chance in Ce
valency,Riecken2007 the change in implies a
shift of the paramagnetic Curie temperatures towards larger
negative values for each field direction objecting statements on
the polycrystalline sample.Riecken2007
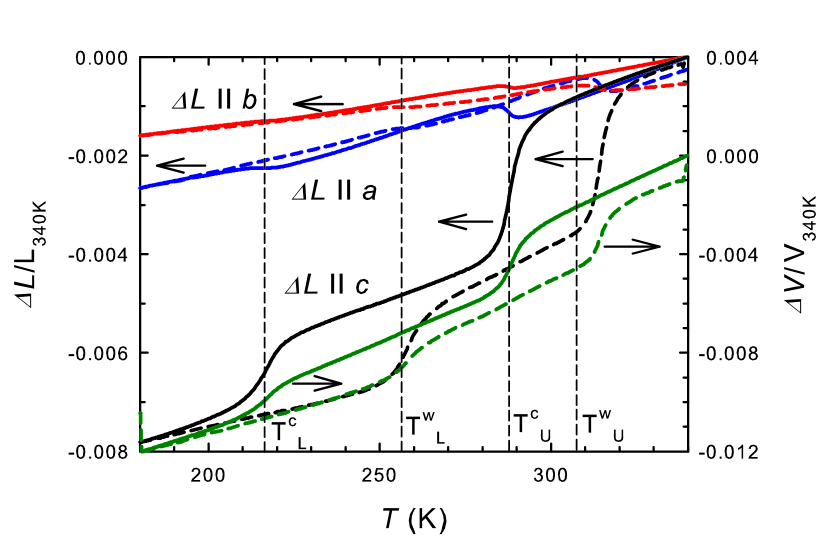
Detailed dilatometric measurements performed on a well-defined single crystal provide important information on the evolution of the lattice parameters. The thermal expansion was measured along each of the three principle crystallographic directions. As presented in Fig. 3, two steps are observed along each of the axes at similar temperatures to the anomalies recorded in and , respectively. When cooling (solid lines in Fig. 3) from room temperature, the crystal contracts considerably along the axis by almost 0.8 % between 340 and 180 K. Contrary, the tiny positive jumps disclosed for and directions represent very small expansion of and nearly negligible increase of the lattice parameter , respectively. Consequently, the volume changes at and express mainly the axis behavior, i. e. , the crystal shrinks in two steps with decreasing temperature. The corresponding reverse transitions appear at and corroborating the hysteretic behavior of the phases as inferred by resistivity and magnetization experiments already.
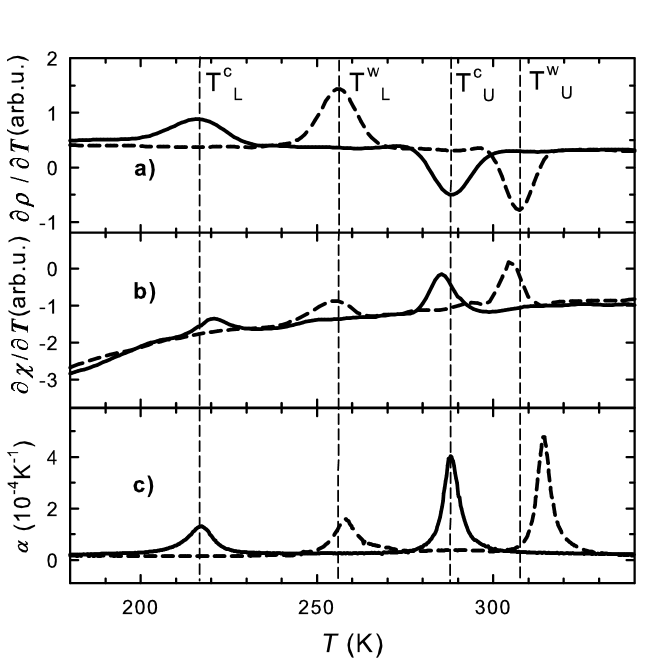
In figure 4, a comparison of the temperatures of the anomalies disclosed in aforementioned bulk experiments is made. To visualize the location of the transition more clearly, the temperature derivative of the resistivity (), dc magnetic susceptibility () and thermal expansion coefficient () are displayed. The maxima in () and () well coincide except for the transition. This difference likely arose because a sample from batch II had been used, as mentioned in section II.
III.2 X–ray single crystal study of polymorphs
| (K) | (Å) | (Å) | (Å) | () | (Å3) | (%) | ||||||
|---|---|---|---|---|---|---|---|---|---|---|---|---|
| 297 | 11.565(1) | 4.7529(5) | 10.2299(9) | 103.028(2) | 547.85(9) | – | ||||||
| 290 | 11.560(3) | 4.751(1) | 10.227(3) | 103.081(7) | 547.1(2) | 0.028(1) | ||||||
| 275 | 11.576(2) | 4.7556(7) | 25.454(3) | 102.959(4) | 1365.6(3) | 0.47(1) | ||||||
| 120 | 11.566(2) | 4.7477(6) | 15.229(2) | 103.554(4) | 813.0(2) | 0.70(2) | ||||||
| 200 | 11.569(2) | 4.7505(6) | 15.237(2) | 103.496(4) | 814.3(2) | 0.76(2) |
| K | K | K | |||||||||||||||||
|---|---|---|---|---|---|---|---|---|---|---|---|---|---|---|---|---|---|---|---|
| Ce1 | 2.3277(9) | Ru1 | Ce1 | 2.8882(19) | Ru5 | Ce1 | 2.4325(18) | Ru2 | |||||||||||
| 2.4661(11) | Ru2 | () | 2.9247(19) | Ru2 | () | 2.4345(18) | Ru3 | () | |||||||||||
| Ce2 | 2.8783(10) | Ru1 | Ce2 | 2.4331(18) | Ru1 | Ce2 | 2.9153(17) | Ru1 | |||||||||||
| 2.9081(10) | Ru2 | () | 2.4380(19) | Ru3 | () | 2.9257(18) | Ru2 | () | |||||||||||
| Ce3 | 2.271(2) | Ru2 | Ce3 | 2.2676(17) | Ru1 | ||||||||||||||
| 2.7575(19) | Ru3 | () | 2.7482(17) | Ru3 | () | ||||||||||||||
| Ce4 | 2.3219(19) | Ru4 | |||||||||||||||||
| 2.4779(18) | Ru5 | () | |||||||||||||||||
| Ce5 | 2.8800(18) | Ru4 | |||||||||||||||||
| 2.9453(19) | Ru1 | () | |||||||||||||||||
| K | K | ||||||||||||||
|---|---|---|---|---|---|---|---|---|---|---|---|---|---|---|---|
| Ce1 | 0.1396 | 0 | 0.4146 | Ce1 | 0.6306 | 0 | 0.1075 | ||||||||
| Ce2 | 0.1225 | 0 | 0.9063 | Ce2 | 0.3567 | 0 | 0.2216 | ||||||||
| Ce3 | 0.6226 | 0 | 0.4375 | ||||||||||||
| Sn1 | 0.4265 | 0 | 0.3469 | Sn1 | 0.0858 | 0 | 0.9376 | ||||||||
| Sn2 | 0.4043 | 0 | 0.8486 | Sn2 | 0.0906 | 0 | 0.6008 | ||||||||
| Sn3 | 0.0659 | 0 | 0.2688 | ||||||||||||
| Ru1 | 0.1827 | 0 | 0.6481 | Ru1 | 0.6784 | 0 | 0.2605 | ||||||||
| Ru2 | 0.1983 | 0 | 0.1973 | Ru2 | 0.2992 | 0 | 0.3654 | ||||||||
| Ru3 | 0.3102 | 0 | 0.0572 | ||||||||||||
The presented results on resistivity, magnetization and thermal
expansion conflict in many ways with earlier
studies.Riecken2007 ; Mydosh2011 Moreover, it was mentioned
in the introduction that in CeRuSn several polymorphic transitions
gradually emerged on cooling, which gave rise to additional
reflections in the diffraction patterns obtained by synchotron
experiment.Feyerherm2012 Those superstructure reflections
can be described by nearly inverse–integer folded propagation
vectors having non-zero components only. The first transition
takes place just below room temperature, changing from a
1/2– to a 1/5–like modulation. Upon
cooling, these become partially suppressed and replaced by
1/4–like ones, which are dominant at 210 K. Finally,
a 1/3–kind modulation develops having the most
intensive reflections below 180 K. This one coexists with the
aforementioned modulations down to at least
100 K.Feyerherm2012 While can be attributed to the
first polymorphic transition (1/2
1/5) no evidence is found in the data for the
structural change 1/5 1/4,
which at least is accepted to manifest in thermal expansion being
an extremely sensitive experiment on lattice changes. To
anticipate speculations about the structure, a detailed X–ray
single crystal diffraction study over the majority of the
reciprocal lattice and at defined temperatures was conducted. The
following temperature sequence was applied: 300 K, 290 K, 275 K,
120 K and 200 K matching the regions for determining the structure
above between and below and below
respectively.
In all cases, the space group for the unit cell has been
observed. However, the size of the unit cell varies significantly
because of formation of superstructures as displayed in
table 1. In comparison, the simultaneous changes of the
and cell parameters are rather negligible and the crystal
unit cell size change is related to integer multiplications of the
original CeCoAl-type unit along the axis in agreement with
Ref. Feyerherm2012, . Within this process, the number of
inequivalent Ce lattice sites in the intermediate (275 K) and low
temperature (120, 200 K) phase, respectively, is larger than in
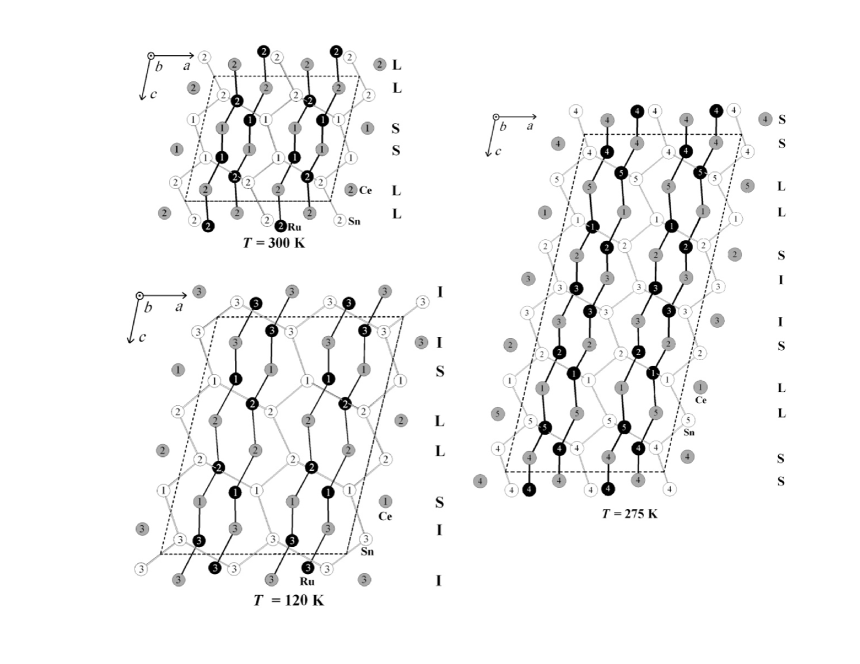
the room temperature polymorph (300, 290 K). The structure at
300 K (Fig. 5) is practically identical to that one at
290 K and in accordance to previous
reports.Riecken2007 ; Feyerherm2012 Upon cooling below the
first transition to K, a tremendous prolongation of the
axis is observed. The resulting superstructure can be
described as a quintuple of the CeCoAl subcell with five
crystallographically independent cerium sites (see
Fig. 5). With further cooling down to 120 K, CeRuSn passes
through the second polymorphic transition at . The final,
and only existing structure can be viewed as a tripling of the
CeCoAl unit–cell exhibiting three different cerium sites
(Fig. 5). The nearest Ce–Ru distances
for all phases are summarized in table 2. With closer
inspection of the crystallographic parameters, one can see that
all the inter–atomic distances were more or less modified. But
the crucial aspect seems to be the increased number of Ce
positions with short Ce–Ru pairs (cf. table 2). This
explains the axis contraction, since Ce–Ru bonds are oriented
almost entirely along this direction and scales the distances
along the axis. Calculating the relative change of the average
CeCoAl subcell from the obtained lattice parameters yields a
shrinking of about 0.47 % (between room temperature and 275 K)
and 0.70 % (between room temperature
and 120 K) along the axis, which is in line with the thermal expansion results.
IV Discussion
Signatures of the polymorphic transitions were presented for
resistivity, magnetization and thermal expansion. We did not show the
data on the thermoelectric power, temperature evolution of the
Hall effect and thermal conductivity in which also a step-like
structure was observed at the at , , and .
All these findings strongly indicate that the polymorphic
transition involves a Fermi surface reconstruction accompanied by
a change of the electronic structure. A strong electron–lattice
coupling is to be expected. Moreover, as pointed out in the
introduction, because of mutual interplay between electronic
structure and interatomic forces, various lattice vibration
properties can be expected according to whether the 4f
moment is localized in an intermediate state. It was discussed by
Mydosh et. al. Mydosh2011 that the step–like
reduction of the magnetization signals a decrease of the density
of states, i. e. , change of the electronic structure. However,
one might interpret the observed reduction in (see
Fig. 2) as manifestation of a sudden (partial) Kondo
screening of the localized Ce2 moments in CeRuSnṪhe slightly
higher than expected resistivity values for below
therefore would be a result of a reduction of conduction
electrons involved in screening. Such scenario applies to Cerium
where lattice vibrations are suggested to play an important role
in the Ce transition together with
spin and charge degrees of freedom.Jeong2004
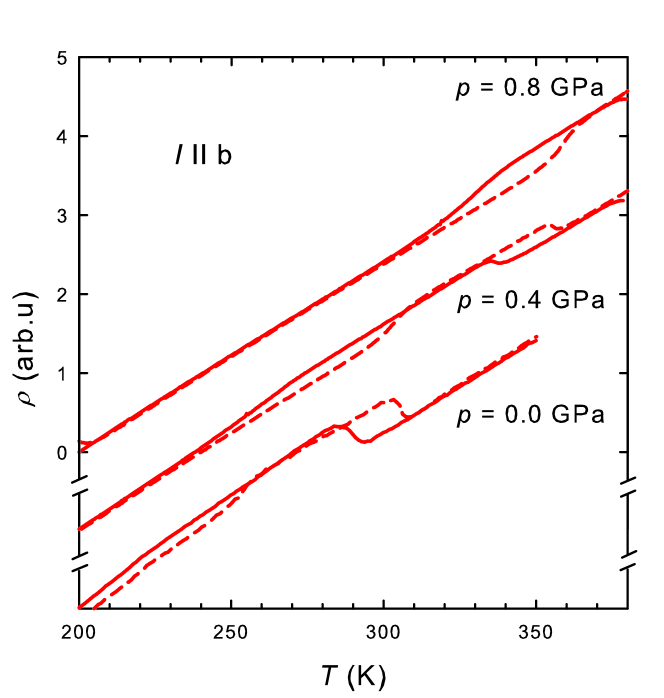
Speculation about an analogy with elementary Cerium are further
inspired by hydrostatic pressure experiments on CeRuSnṪhe upper
accessible temperature (380 K) is limited by the properties of the
StyCast epoxy used for sealing of the wires in the plug of the
pressure cell. In Fig. 6, the resistivity data in
arbitrary units are depicted against temperature at ambient and at
pressures of and GPa. The character of the
transitions remains qualitatively the same even at highest applied
pressure when they are still observable within the temperature
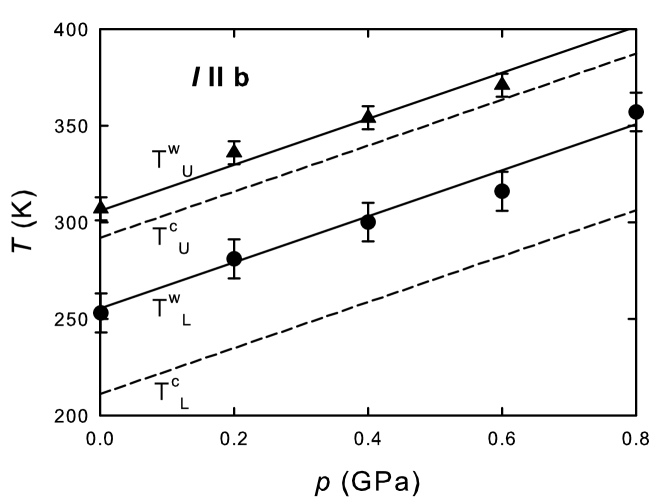
range of the experiment. Interestingly, within the applied
pressure range and the resolution of the experiment ,
, and increase roughly linear with an identical
rate. The slopes of the respective polymorphic transition shift
amounts to approximately 125 K/GPa. This linear increase of the
transition temperature is reminiscent to the linear shifting of
the phase line of
Cerium.Gschneider1962 Here the slope is roughly
250 K/GPa Koskenmake1978 twice the ones in CeRuSn .
The results of the structural investigation can be understood as a
subsequent annealing and consecutive evolution of polymorph
phases. In the determined phases, the cerium position (see
table 2) can be divided into three groups – those
exhibiting two short Ce–Ru distances (close Ru nearest
neighbors), those with two long Ce–Ru distances (far
nearest neighbors) and those with one close and one far Ru
nearest neighbor (within each group, there is a variation of the
Ce–Ru distance across the polymorphs but in comparison to the
short-long distance the change is minimal). With this in mind (see
Fig. 5), the low temperature structure can be described
as base building block (two CeCoAl subcells, same sequence
as at room temperature) alternating with the cerium sequence
(leading to the tripling of the CeCoAl subcell observed at low
temperatures) along the axis. With increasing temperature,
a rearrangement by displacive transformation leads to the extinction
of half of the spacers leaving the structure with quintuple
CeCoAl subcell (two base blocks, one spacer). Further heating up
removes rest of the spacers and resulting in the appearance
of the base building block at high temperatures. Within this
context, the existence of the spacer can be understood as a
deformation of the CeCoAl–sized cell driven by cohesion forces in
order to stabilize the whole structure. The results of the XANES
experiment Feyerherm2012 seem to be in contradiction with
the above presented structural data (with decreasing temperature
the number of sites with short Ce–Ru distance is increased).
However, it is necessary to keep in mind, that the dependence of
the valence on the Ce–Ru distance is not simple and that there
are several different short Ce–Ru distances at lower
temperatures. This nonlinearity together with an increased number
of crystallographically inequivalent of Ce sites and presumable Kondo
screening leads to shrinking of the axis concurrently and to
an unchanged overall Ce valence, which is different from the
statement Feyerherm2012 that the valence of the Ce ions
through the transition remains conserved. Further experiments
resolving this issue are desired.
To find the true nature, i. e. , the driving mechanism behind the polymorphic transitions is a challenging task for future work. The transitions in CeRuSn show to some extend similarities to the cerium case, which might serve as reference point. In order to enlighten the role of lattice vibrations, inelastic neutron scattering experiments are envisaged.
V Summary
Investigation of the polymorphic transitions by means of
resistivity, magnetization, thermal expansion and X–ray
diffraction on single crystals of CeRuSn was carried out.
Measurements were conducted along all principle axes. In all
physical properties, upon cooling, two subsequent anomalies at
K and K were detected. These
signatures can be attributed to polymorphic transitions, i. e. ,
from the room temperature double CeCoAl-type superstructure to a
quintuple at and from the quintuple to a triple CeCoAl
unit-cell superstructure at the lower transition temperature. The
refined superstructures are characterized by an increased number
of crystallographically inequivalent Ce sites. Simultaneously, the
ratio between the number of short and long Ce–Ru bonds, which are
essentially aligned along direction, is increased. As
consequence, the lattice gradually contracts mainly along the
axis as observed in thermal expansion eliciting an overall
shrinking of the sample volume. The transitions exhibit
large hysteric behavior.
The strong response of the polymorphic transitions in transport
and magnetic properties infers a close connection to variations in
the electronic structure of CeRuSnṠlight jumps in the
magnetization as well as unexpected behavior in resistivity
suggest influence of Kondo interaction to play a role in the
structural change. Together with lattice vibrations, it might be
the driving mechanism behind the polymorphic transitions similar to the one in
elementary Cerium. This scenario is partially rooted in
resistivity data on CeRuSn under hydrostatic pressure revealing an
almost linear increase of the transition temperatures upon
pressure as had been observed for the
transition in Ce as well.
VI Acknowledgments
This work was supported by the Czech Science Foundation (Project # 202/09/1027) and Charles University grants GAUK440811 and UNCE 11.
corresponding author: fikacekjan@seznam.cz
References
- (1) J.G. Sereni J. Less–Common. Met. 86, 287 (1982).
- (2) B. Johansson and N. Mårtensson, in Handbook on the Physics and Chemistry of Rare Earths edited by K. A. Gschneider, Jr., L. Eyring, and S. Hütner (Elsevier Science Publishers B.V. 1987), Chap. 69, p. 361.
- (3) D. Malterre Solid State Commun. 69, 475 (1989).
- (4) P. Fulde, Electron Correlations in Molecules and Solids (Springer, Heidelberg, 1995).
- (5) H. v. Löhneysen, A. Rosch, M. Vojta, and P. Wölfle, Rev. Mod. Phys. 79, 1015 (2007).
- (6) see for example: E. H. El Ghadraoui, J. Y. Pivan, R. Guérin, O. Pena, J. Padiou, and M. Sergent, Mater. Res. Bull. 23, 1345 (1988).
- (7) M. Mihalik, M. Diviš , V. Sechovský, N. Kozlova, J. Freudenberger, N. Stüßer, and A. Hoser, Phys. Rev. B 81, 174431 (2010).
- (8) H. F. Braun, N. Engel, and E. Parthé, Phys. Rev. B 28, 1389 (1983).
- (9) P. W. Bridgman, Proc. Am. Acad. Arts Sci. 76, 71 (1948).
- (10) D. C. Koskenmaki and K. A. Gschneidner, Jr., in Handbook on the Physics and Chemistry of Rare Earths, edited by K. A. Gschneidner, Jr. and L. Eyring (Elsevier Science Publishers B.V., 1978), Chap. 4, p. 337.
- (11) B. Johansson, Philos. Mag.30, 469 (1974).
- (12) J. W. Allen, and R. M. Martin, Phys. Rev. Lett. 49, 1106 (1982).
- (13) J. W. Allen, and L. Z. Liu, Phys. Rev. B 46, 5047 (1992).
- (14) I.-K. Jeong, T. W. Darling, M. J. Graf, Th. Proffen, R. H. Heffner, Yongjae Lee, T. Vogt, and J. D. Jorgensen, Phys. Rev. Lett. 92, 105702 (2004).
- (15) M. J. Lipp, D. Jackson, H. Cynn, C. Aracne, W. J. Evans, and A.K. McMahan, Phys. Rev. Lett. 101, 165703 (2008).
- (16) J. F. Riecken, W. Hermes, B. Chevalier, R.-D. Hoffmann, F. M. Schappacher, and R. Pöttgen, Z. Anorg. Allg. Chem. 633, 1094 (2007).
- (17) J. A. Mydosh, A. M. Strydom, M. Baenitz, B. Chevalier, W. Hermes, and R. Pöttgen, Phys. Rev. B 83, 054411 (2011).
- (18) S. F. Matar, J. F. Riecken, B. Chevalier, R. Pöttgen, A. F. Al Alam, and V. Eyert, Phys. Rev. B 76, 174434 (2007).
- (19) R. Feyerherm, E. Dudzik, S. Valencia, J. A. Mydosh, Y.-K. Huang, W. Hermes, and R. Pöttgen, Phys. Rev. B 85, 085120 (2012).
- (20) O. N. Carlson, and F. A. Schmidt, J. Less–Common. Met. 53, 73 (1977).
- (21) J. Rodriguez-Carvajal, Physcia B 192 55 (1993).
- (22) G. M. Sheldrick, Acta Cryst. A 64, 112 (2007).
- (23) M. Rotter, H. Müller, E. Gratz, M. Doerr, and M. Loewenhaupt, Rev. Sci. Instr. 69, 2742 (1998).
- (24) K. A. Gschneider, R. O. Elliott, and R. R. McDonald, J. Phys. Chem. Solids 23, 555 (1962).