The main transition in the Pink membrane model: finite-size scaling and
the influence of surface roughness
Abstract
We consider the main transition in single-component membranes using computer simulations of the Pink model [D. Pink et al., Biochemistry 19, 349 (1980)]. We first show that the accepted parameters of the Pink model yield a main transition temperature that is systematically below experimental values. This resolves an issue that was first pointed out by Corvera and co-workers [Phys. Rev. E 47, 696 (1993)]. In order to yield the correct transition temperature, the strength of the van der Waals coupling in the Pink model must be increased; by using finite-size scaling, a set of optimal values is proposed. We also provide finite-size scaling evidence that the Pink model belongs to the universality class of the two-dimensional Ising model. This finding holds irrespective of the number of conformational states. Finally, we address the main transition in the presence of quenched disorder, which may arise in situations where the membrane is deposited on a rough support. In this case, we observe a stable multi-domain structure of gel and fluid domains, and the absence of a sharp transition in the thermodynamic limit.
pacs:
87.16.D-, 87.14.Cc, 64.70.-p, 82.20.WtI Introduction
Lipid membrane bilayers are abundant in nature and to understand their properties is of paramount importance citeulike:1022291 ; citeulike:3042594 ; citeulike:416456 . One aspect that has received much attention are collective phenomena (phase transitions) taking place in these systems. Among the different phase transitions that can occur citeulike:10527301 ; citeulike:6218761 ; citeulike:6593910 ; citeulike:3850753 , the main phase transition is presumably the most important and well studied one citeulike:7028415 ; citeulike:10527551 . This transition, typically driven by the temperature , is between a “gel” and a “fluid” phase. At low , the bilayer is in the gel phase (characterized by nematic chain order of the lipid tails), while at high the bilayer assumes the fluid phase (characterized by the absence of nematic chain order).
Computer simulations have become a well established tool to model the main transition. The challenge in simulations is to strike a balance between the level of detail to include, and the time and length scale one wishes to address citeulike:1007006 . Since collective phenomena involve many molecules and entail large length scales it is clear that, in order to describe the main transition, a significantly coarse-grained particle model is crucial. Strictly speaking, one needs to address the thermodynamic limit (infinite particle number) since only there phase transition properties become properly defined. Indeed, the need for coarse grained modeling of lipid bilayers is well recognized citeulike:8529576 ; citeulike:7152547 ; citeulike:270315 .
An early and highly successful coarse grained approach to study the main transition has been the particle model introduced by David Pink and co-workers Pink1980 ; springerlink:10.1007/BF01295077 ; doi:10.1139/p80-083 . In this model, the so-called Pink model, only the orientational degrees of freedom of the hydrophobic lipid tails are included, while the positional degrees of freedom of the hydrophilic heads are disregarded. This model, due to its simplicity, allows for the investigation of very large systems, and the nature of the main transition can be probed in great detail. Indeed, key features of the main transition in the Pink model compare well to experiments citeulike:9172835 .
However, despite the great success the Pink model has enjoyed, there remain some open questions. In Ref. Laradji, , it was noted that the Pink model at the experimentally determined transition temperature does not undergo any transition. While in systems of finite size there were indications of a transition, these vanished in larger systems. This raises the question as to why no transition could be detected. The aim of this paper is to resolve this issue. As it turns out, to properly model the main transition, a finite-size scaling study is essential. Computer simulations inevitably deal with only a finite number of particles, and their output will depend on the number of particles used, especially near phase transitions. Finite-size scaling provides the framework to systematically extrapolate simulation data to the thermodynamic limit. To date, finite-size scaling studies of the Pink model are scarce, with Ref. Laradji, being a notable exception. The present paper aims to fill this gap. Our main finding is that, in order to observe the main transition in the Pink model at experimentally relevant temperatures, one of the model parameters needs to be adjusted. This follows quite naturally when one realizes that the universality class of the Pink model is just the one of the two-dimensional (2D) Ising model springerlink:10.1007/BF01295077 . As we will show for three lipid species, the “standard” Pink model parameters yield a critical temperature distinctly below the experimental main transition temperature. Consequently, a “re-tuning” of the standard Pink parameters is urgently needed.
As an application, we also address the fate of the main transition in the presence of quenched (immobilized) impurities using the Pink model. The experimental motivation to do so is that this situation may resemble that of a membrane supported on a rough substrate. In binary lipid mixtures, the effect of such impurities on lateral phase separation has recently attracted much attention citeulike:6599228 ; citeulike:7115548 ; citeulike:8864903 ; citeulike:9134200 ; citeulike:8610600 ; citeulike:10648601 . In this paper, we present simulation results for the corresponding scenario in a single component bilayer undergoing the main transition. Within the framework of the Pink model, we find that quenched impurities prevent the main transition from taking place, already at low impurity concentrations. Instead of the formation of macroscopic gel and fluid domains, we now obtain a stable multi-domain structure, which strikingly resembles experimental results. The theoretical justification is that the impurities induce a change in universality toward the 2D random-field Ising class. As is well known, the latter does not support an order-disorder phase transition in the thermodynamic limit imry.ma:1975 ; imbrie:1984 ; bricmont.kupiainen:1987 ; aizenman.wehr:1989 .
II The Pink model
In the Pink model, the lipid bilayer is assumed to consist of two independent monolayers. Each monolayer is represented by a triangular 2D lattice consisting of sites, and each lattice site contains a single lipid chain. Each lipid molecule is comprised of two independent hydrophobic acyl chains and a hydrophilic polar head. The polar heads are translationally frozen to the lattice, and no particular structure for the polar head groups is assumed. The only degrees of freedom included in the Pink model are the acyl chain conformations. These are not simulated directly (i.e. one does not explicitly model the carbon atoms) but are captured in a coarse-grained fashion whereby the chain conformations are grouped into discrete states. The original Pink model uses , but we will consider different values also. These states include the ground state , eight low-energy excitations , while all remaining conformations are grouped into a single disordered state . Each state is characterized by three coarse-graining parameters, namely an internal energy , a cross-sectional area , and a degeneracy counting the number of chain conformations with energy and area .
II.1 coarse graining parameters
To determine the coarse graining parameters, we assume that a single acyl chain consists of carbon atoms, thereby containing carbon-carbon bonds, and that bonds are either in a trans or gauche configuration. The trans configuration yields the lowest energy, while the gauche configuration has a slightly higher energy. The energy difference between the trans and gauche configuration is denoted (Table 1). To understand the difference in geometry between trans and gauche bonds consider a chain segment of four consecutive carbon atoms. The positions of the first three atoms define a two-dimensional plane. In the trans configuration, the fourth atom remains in the plane, while in the gauche configuration, it leaves the plane, and it can do so inward or outward. Thus, each gauche bond is two-fold degenerate. In the Pink model, it is assumed that each -th gauche bond takes the chain back to the original plane, and so the gauche degeneracy is given by
| (1) |
where denotes the total number of gauche bonds in the chain, and where the function means “rounding-up” to the nearest integer.
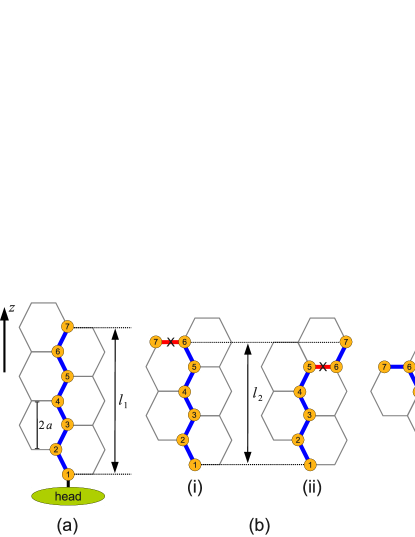
It is convenient to mathematically represent the chain conformations on a hexagonal lattice with next-nearest neighbor distance . We emphasize that this lattice is merely an aid to identify the low energy chain conformations which are needed to set the coarse-graining parameters: it should not be confused with the triangular simulation lattice on which the Pink Hamiltonian will eventually be defined. The carbon atoms are placed on the nodes of the hexagonal lattice following certain rules, and nearest-neighbor connections between atoms represent carbon-carbon bonds. The ground state corresponds to the chain conformation that is maximally stretched [Fig. 1(a)]. Note that, in the ground state, the atoms are alternatingly placed on the left and right lattice node, yielding a characteristic “zig-zag” pattern. The ground state by definition contains only trans bonds, its internal energy is set to zero as a reference , and it is obviously non-degenerate . The cross-sectional area of the ground state has experimentally been determined as Å2 Pink1980 . We also introduce the projected length of the conformation, defined as the difference in -coordinate between the carbon atom closest to the head group and the one furthest away , with the -direction as indicated in the figure. For the ground state, it follows that .
The eight low-energy excitations () are obtained by systematically incorporating gauche bonds. The effect of such a bond is to disrupt the “zig-zag” pattern of the ground state. That is, one no longer places the atoms alternatingly on left and right nodes, but also allows for “excursions” whereby for two consecutive atoms the same direction is chosen. Each such excursion corresponds to a gauche bond, and has energy cost . The gauche bonds are introduced according to the following rules: (1) The two bonds in the chain closest to the head group must always be in the trans configuration. In Fig. 1, these correspond to the bonds between atoms and . (2) At most three gauche bonds are allowed, and each time such a bond is included there is an energy cost . (3) The projected chain length must obey . (4) The acyl chain cannot fold back onto itself. In the coordinate system of Fig. 1, this means that the -coordinates of the atoms must obey .
Following these rules, we show in Fig. 1(b) the chain conformations (i) and (ii) that form the first excited state . In (i), a single gauche bond is placed at the very chain end, while in (ii) it is placed at the second-last position. One immediately sees that both conformations have the same energy , and the same projected length . To compute the cross-sectional area, one assumes volume conservation for the lipid chains: . Hence, from the (known) ground state values, the cross-sectional area of the excited state follows. Note that, by placing the gauche bond at the third-last position [Fig. 1(c)], a shorter projected length is obtained, and so conformation (c) does not belong to the first excited state (even though it has the same energy). The total degeneracy of the first exited state , which is the total number of conformations, multiplied by the gauche degeneracy of Eq. (1). The coarse-graining parameters of the remaining excited states can be found analogously, and are listed for completeness in Table 1. Finally, for the completely disordered state , one assumes erg, Å2, and degeneracy , which have their origins in experimental considerations doi:10.1139/p80-083 .
| state () | |||||||||||||||
|---|---|---|---|---|---|---|---|---|---|---|---|---|---|---|---|
| ground state | |||||||||||||||
| kink | |||||||||||||||
| disordered | |||||||||||||||
II.2 Pink model Hamiltonian
Having specified the coarse-graining parameters, the Hamiltonian of the Pink model can be written as Mouritsenbook
| (2) |
The first term is the total internal energy of the acyl chains , with the sum over all sites of the triangular lattice, and the conformational state at the -th lattice site. The second term represents the anisotropic van der Waals interaction between adjacent acyl chains , with the van der Waals coupling constant, and a sum over all nearest-neighboring sites on the triangular lattice. The precise value of depends on the chain length, and explicit expressions are provided elsewhere Pink1980 ; springerlink:10.1007/BF01295077 ; Ipsen1990 . However, it has been noted that these parameters do not always yield a main transition at the expected temperature Laradji , and so we will also propose our own values later on. The (dimensionless) variables measure nematic chain order, and can be expressed in terms of the cross-sectional areas doi:10.1139/p80-083 ; Laradji
| (3) |
where for the disordered state , and otherwise.
The last term in the Hamiltonian accounts for the interaction between the hydrophilic polar head groups and between them and water and also steric interactions from both head groups and the lipid chains. Although it is possible to consider a more realistic pairwise interaction between the headgroups Mouritsenbook , this interaction can be approximated with a simple pressure term , where is an effective lateral pressure acting on the lipid chains in the bilayer membrane, and the total cross-sectional area occupied by the lipids chains
| (4) |
III Monte Carlo methods
To study the phase behavior of the Pink model, we use the Monte Carlo (MC) simulation method. We mostly use triangular lattices of size with periodic boundary conditions. The principal MC move consists of randomly picking one of the lattice sites, read-out the conformational state of that site, and propose a new state drawn randomly from the set of possible states. The new configuration is accepted with the Metropolis criterion
| (5) |
where denotes the state degeneracy, the energy difference between initial and final configuration as given by Eq. (2), the Boltzmann constant, and the temperature. The degeneracy compensates for the fact that some of the states have a much larger entropy, and should therefore appear more often in the ensemble average.
By virtue of the MC move, the total projected area given by Eq. (4) fluctuates during the course of the simulation. In fact, plays the role of order parameter since it changes abruptly at the main phase transition. Hence, it is instructive to measure the distribution , defined as the probability to observe a configuration with projected area . The distribution depends on the imposed temperature and pressure, as well as on the linear extension of the triangular simulation lattice. At the main transition, assumes a characteristic bimodal shape, from which a number of important phase properties are obtained (explicit examples are provided in the next section). We note that even with very long simulation runs, distributions of high statistical quality are difficult to obtain, especially in the vicinity of the main transition. The reason is related to free energy barriers that arise from the formation of interfaces citeulike:7134501 ; citeulike:4503186 ; binder:1982 . To overcome this problem, we combine our MC simulations with a biased sampling scheme called successive umbrella sampling MarcusMullerSUS ; the latter ensures that is sampled accurately over the entire (specified) range in of interest. A final ingredient to economize simulation time is the use of histogram reweighting HistoRew . A single simulation run yields at a given temperature and effective pressure ; histogram reweighting enables us to extrapolate the measured distribution to different values . For example, extrapolations in the pressure are performed using . Extrapolations in the temperature can be performed analogously, but also require storage of the energy histograms; for implementation details see Ref. citeulike:7554917, .
IV Results
IV.1 the “standard” Pink model revisited
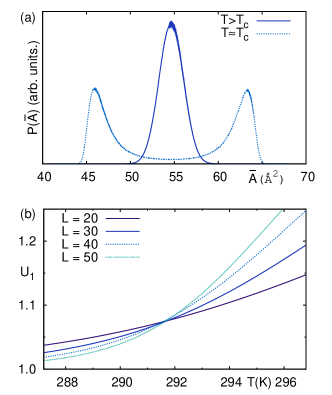
We first consider the main transition in a membrane consisting of DPPC lipids to settle a controversy when this system is being simulated using the Pink model. The acyl chains in DPPC consist of carbon atoms, and the experimentally obtained main transition temperature K Ipsen1990 . However, simulations based on the Pink model could not detect a transition at this temperature Laradji . The latter simulations used the “standard” Pink parameters as listed in Table 1, van der Waals coupling constant erg, and pressure dyn/cm. Hence the question arises as to why no transition could be detected. To answer this question we perform additional DPPC simulations using the Pink model, with the same parameters as in Ref. Laradji, , but over a wider range in temperature and pressure. The picture that emerges is the following: At high temperature the distribution is always single-peaked (corresponding to one phase) for all value of the lateral pressure . At low temperature, is doubled-peaked for a special value of the lateral pressure, , corresponding to two-phase coexistence [Fig. 2(a)]. Here, the left peak reflects the -phase, the right peak the -phase. The numerical criterion to locate is to vary until the fluctuation reaches a maximum orkoulas.fisher.ea:2001 , with the thermal averages computed as .
| DMPC | 14 | 0.618 | 270.3 | 4.3 | 296.9 | 0.690 | 15.6 | |||||||||
| DPPC | 16 | 0.710 | 291.7 | 4.6 | 314.0 | 0.772 | 18.1 | |||||||||
| DSPC | 18 | 0.815 | 321.5 | 21.6 | 327.9 | 0.833 | 26.7 |
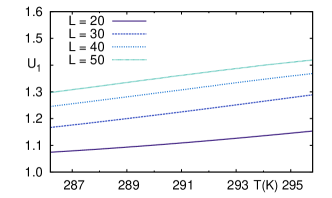
At the temperature where the transition from a single to doubled-peaked distribution occurs, the system becomes critical. To locate the critical temperature a finite-size scaling analysis is performed, whereby we plot the Binder cumulant , , versus temperature for different system sizes . In the thermodynamic limit
| (6) |
while in systems of finite size, curves for different intersect at binder:1981 ; binder:1981*c . In Fig. 2(b), we show the result for DPPC obtained using the “standard” Pink model parameters: the data scale as expected, and from the intersection the critical temperature can be accurately “read-off”.
The corresponding estimates of as well as the coexistence pressures for three lipid species are collected in Table 2. For all lipid species considered, the computed critical temperature is distinctly below the experimental melting temperature . In other words: if one simulates the Pink model at the experimental melting temperature , one is always inside the one-phase region, where is single-peaked! This, apparently, is the reason why no phase transition could be seen in previous studies Laradji . One possibility to get the proper value for the transition temperature, i.e. such that coincides with , is to re-tune the value of . This has been done for the three lipid species by systematically changing the coupling constant using histogram reweighting and finite-size scaling. Our proposed values and corresponding pressures for the three lipid species are summarized in Table 2.
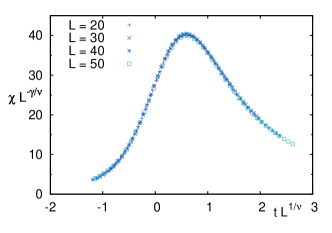
For completeness, we still confirm the universality class of the critical point, which for the Pink model is expected to be the one of the 2D Ising model springerlink:10.1007/BF01295077 . To this end, we consider the susceptibility orkoulas.panagiotopoulos.ea:2000 , which diverges at the critical point , , with critical exponent . In systems of finite size, the divergence is rounded, but can still be obtained using the standard finite-size scaling procedure of plotting versus newman.barkema:1999 , where is the correlation length critical exponent. Provided suitable values are used, data for different collapse. The result for DPPC is shown in Fig. 3, where the “standard” parameters of the Pink model were used. Indeed, by using the 2D Ising values , and K of Table 2, an excellent data collapse is observed (similar good collapses are obtained for DMPC and DSPC also). The order parameter critical exponent has also been measured, and the 2D Ising value was confirmed (scaling plot not shown). Therefore, even though the Pink model is a 10-state model, its critical behavior remains in the universality class of the 2D Ising model. This further motivates the idea of reducing the states in the Pink model to an effectively two-state description as is frequently done citeulike:6587773 ; citeulike:9172835 ; citeulike:9100609 ; springerlink:10.1007/BF01295077 ; citeulike:9234255 .
IV.2 modified Pink model with fewer states
We now consider the effect of lowering the number of states in the Pink model. For this purpose, an appropriate number of intermediate states was removed, based on the maximum number of gauche bonds. In the “standard” 10-state Pink model at most three gauche bonds are allowed. We now consider the case where at most two gauche bonds are permitted, by removing states from Table 1, yielding an 8-state model (to keep the total number of states constant the degeneracy of the removed states was added to the disordered state, but we emphasize that this correction is small). We apply our previous finite-size scaling analysis to the resulting 8-state model for DPPC, using the “standard” value erg. As expected, the critical point remains in the universality class of the 2D Ising model, but it is “shifted” to K and dyn/cm. Similarly, by allowing at most one gauche bond, a 5-state model is obtained. In this case, the DPPC critical point is located at K and dyn/cm.
Therefore, lowering the number of states in the Pink model while leaving the other parameters untouched, one finds that both the critical temperature and pressure increase. This trend is consistent with the Pink model simulations of Ref. Mouritsen2s, for DPPC performed at the experimental melting temperature but with a lower number of states. In these simulations, hysteresis loops indicating a first-order transition are clearly visible around for . Indeed, as our scaling analysis shows, by lowering the number of states , eventually exceeds , resulting in a genuine phase transition at .
To conclude: lowering the number of states does not affect the universality class of the Pink model, which remains 2D Ising (provided , of course). Hence, the topology of the phase diagram remains the same, merely the critical point gets shifted. Depending on the parameters used, the main transition in the Pink model is either first-order (), or it is 2D Ising critical (). We do not claim that the main transition as observed in experiments necessarily conforms to this scenario (we return to this point in Section V).
IV.3 Pink model with quenched disorder
As a final illustration, we consider the main transition in a solid-supported membrane, which has received considerable attention in experiments citeulike:10633341 ; citeulike:6591101 ; citeulike:9154736 ; citeulike:6090359 ; citeulike:6593910 ; citeulike:6590840 . A striking feature observed in one of these studies is the formation of coexisting gel and fluid domains that do not coalesce with time, but instead form a multi-domain structure that is stable over hours citeulike:6090359 . To understand the stability of this structure is not trivial, due to the large amount of line interface it contains. Here we attempt to reproduce such a multi-domain structure within the framework of the Pink model. Our hypothesis is that the solid support onto which the membrane is deposited has a certain roughness. Since surface roughness is random and time independent, it constitutes a form of quenched disorder. We assume that this gives rises to regions on the surface where certain lipid tail conformations are preferred over others. We capture this effect in the Pink model by randomly labeling a fraction of the lattice sites as “pinning sites”. At the pinning sites, the corresponding lipid chain is fixed into the ground state conformation. This extension is trivially incorporated into our MC simulations: we simply do not apply the MC move to pinning sites. We specialize to DSPC, using the “standard” Pink parameters of Tables 1 and 2.
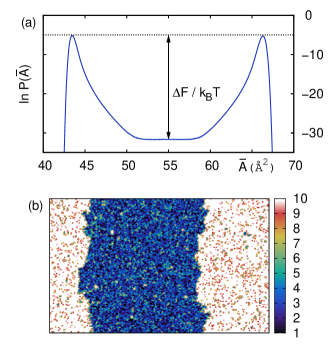
In Fig. 4(a), we show at K and dyn/cm in the absence of quenched disorder . At this temperature, which is well below , the main transition is strongly first-order. Consequently, there is a significant line tension between gel and fluid domains; the latter is related to the free energy barrier binder:1982 ; billoire.neuhaus.ea:1994
| (7) |
indicated by the vertical double-arrow in Fig. 4(a). Here, is the value of at the minimum “between the peaks”, while denotes the average peak value. The physical motivation for Eq. (7) is that, for cross-sectional areas “between the peaks”, the bilayer reveals a coexistence between two slab domains where the total interface length equals [Fig. 4(b)]. For DSPC, and assuming the lattice constant to be 1 nm, we obtain pN, which is compatible with experimental values citeulike:10636141 .

Next, we consider a DSPC bilayer with a fraction of the lattice sites marked as “pinning sites”. In Fig. 5(a), we show distributions for K obtained for 4 different random positions (samples) of pinning sites. Even though the temperature is the same as in Fig. 4(a), a unique double-peaked distribution can no longer be identified. In contrast, is strongly sample dependent, and a multitude of rather exotic shapes is revealed. This behavior is characteristic of systems that belong to the universality class of the 2D random-field Ising model (2D-RFIM) citeulike:8864903 . Hence, by introducing the pinning sites, we have changed the universality class of the Pink model from ordinary 2D Ising toward 2D-RFIM (the pinning sites essentially correspond to a field of infinite strength acting at random locations).
There are two features of the 2D-RFIM universality class that are remarkably consistent with experimental results for the main transition in supported membranes. First of all, 2D-RFIM universality implies the absence of macroscopic coexistence between gel and fluid domains imry.ma:1975 ; imbrie:1984 ; bricmont.kupiainen:1987 ; aizenman.wehr:1989 . Indeed, inspection of simulation snapshots [Fig. 5(b)] reveals an equilibrium multi-domain structure, that is highly anisotropic, strongly resembling experimental AFM images citeulike:6090359 . A second (related) feature is that the 2D-RFIM has no true phase transition in the thermodynamic limit. In finite systems, there may be signs of a transition (or even several transitions; note that some of the distributions in Fig. 5(a) are triple-peaked), but they will be “smeared” over a wide temperature range, and do not persist in the thermodynamic limit. Precisely this behavior has also been reported in experiments citeulike:6090359 ; citeulike:6591101 . Simulation evidence that the pinning sites prevent a sharp transition in the thermodynamic limit follows from the (disorder-averaged) Binder cumulant , where denotes an average over different samples of pinning sites. As shown in Fig. 6, as increases, consistent with only a single phase.
V Conclusion
In this paper, the main phase transition in single-component phospholipid membranes was investigated using the Pink model. Our simulations of the pure membrane (i.e. without quenched disorder) confirm the formation of macroscopic gel and fluid domains below a critical temperature , and at the coexistence pressure . We also demonstrated that, using the accepted values of the Pink model parameters, falls below experimentally measured transition temperatures. This explains why no phase transition was detected at the experimental transition temperature in the simulations of Ref. Laradji, . To resolve this issue, we propose that the strength of the van der Waals coupling in the Pink model be increased. By using the values proposed in this work, of the Pink model in the thermodynamic limit coincides with the experimental main transition temperature. In addition, finite-size scaling was applied to confirm the universality class of the critical point in the Pink model, which was shown to be 2D Ising. This result holds irrespective of the number of conformational states (as long as , of course). Hence, to capture the generic features of membrane phase behavior, a highly-detailed model is not always needed (which is consistent with the findings of Ref. citeulike:10648601, ).
We have also used the Pink model to describe the main transition in the presence of quenched disorder, which may arise in case the membrane is deposited on a rough support. Assuming that this induces regions in the membrane where certain tail conformations become preferred, the universality class changes toward that of the 2D random-field Ising model. In the presence of quenched disorder, the Pink model reveals a stable multi-domain structure, and the absence of a sharp transition; these findings are indeed consistent with some of the experimental observations.
Although the Pink model (both the pure version and the one containing quenched disorder) seems well suited to describe the main transition, we wish to end with a warning. By using the Pink model, one inevitably casts the main transition into the Ising universality class. This may not be entirely appropriate, as the main transition is essentially a melting transition leading to the formation of nematic chain order. A liquid-crystal model may therefore be more suitable, such as the Maier-Saupe approach followed in Ref. citeulike:9100874, . If, indeed, the main transition occurs close to a critical point citeulike:6587773 ; citeulike:10561379 it may well be necessary to replace the discrete set of states of the Pink model by a continuous one citeulike:4074809 . In that case, one enters the regime of Heisenberg-type models (which, provided certain conditions are met, do support 2D phase transitions physrevlett.89.285702 ; physrevlett.88.047203 ; citeulike:5202797 ). The investigation of the main transition in terms of such a continuous model could be an interesting topic for future work.
Acknowledgements.
This work was supported by the Deutsche Forschungsgemeinschaft (Emmy Noether VI 483 and the SFB-937).References
- (1) Jacobson K, Mouritsen OG, and Anderson RGW, Lipid rafts: at a crossroad between cell biology and physics, Nat. Cell Biol. 9, 7 (2007)
- (2) Simons K and Ikonen E, Functional rafts in cell membranes, Nature 387, 569 (1997)
- (3) Engelman DM, Membranes are more mosaic than fluid, Nature 438, 578 (2005)
- (4) Mouritsen OG, Physics of biological membranes, in: D Baeriswyl, M Droz, A Malaspinas, and P Martinoli (Eds.), Physics in Living Matter, vol. 284 of Lecture Notes in Physics, chap. 8, 76–109 (Springer, Berlin/Heidelberg, 1987)
- (5) Risbo J, Sperotto MM, and Mouritsen OG, Theory of phase equilibria and critical mixing points in binary lipid bilayers, J. Chem. Phys. 103, 3643 (1995)
- (6) Keller D, Larsen NB, Møller IM, and Mouritsen OG, Decoupled Phase Transitions and Grain-Boundary Melting in Supported Phospholipid Bilayers, Phys. Rev. Lett. 94, 025701 (2005)
- (7) Kranenburg M and Smit B, Phase Behavior of Model Lipid Bilayers, J. Phys. Chem. B 109, 6553 (2005)
- (8) Nagle JF, Theory of the Main Lipid Bilayer Phase Transition, Annu. Rev. Phys. Chem. 31, 157 (1980)
- (9) Mouritsen OG, Theoretical models of phospholipid phase transitions, Chem. Phys. Lipids 57, 179 (1991)
- (10) Müller M, Katsov K, and Schick M, Biological and synthetic membranes: What can be learned from a coarse-grained description?, Phys. Rep. 434, 113 (2006)
- (11) Orsi M, Michel J, and Essex JW, Coarse-grain modelling of DMPC and DOPC lipid bilayers, J. Phys.: Condens. Matter 22, 155106 (2010)
- (12) Hömberg M and Müller M, Main phase transition in lipid bilayers: Phase coexistence and line tension in a soft, solvent-free, coarse-grained model, J. Chem. Phys. 132, 155104 (2010)
- (13) Marrink SJ, Risselada J, and Mark AE, Simulation of gel phase formation and melting in lipid bilayers using a coarse grained model, Chem. Phys. Lipids 135, 223 (2005)
- (14) Pink DA, Green TJ, and Chapman D, Raman scattering in bilayers of saturated phosphatidylcholines. Experiment and theory, Biochemistry 19, 349 (1980)
- (15) Pink DA, Georgallas A, and Zuckermann MJ, Phase transitions and critical indices of a phospholipid bilayer model, Z. Phys. B 40, 103 (1980)
- (16) Caillé A, Pink D, Verteuil FD, and Zuckermann MJ, Theoretical models for quasi-two-dimensional mesomorphic monolayers and membrane bilayers, Can. J. Phys. 58, 581 (1980)
- (17) Mouritsen OG, Boothroyd A, Harris R, Jan N, Lookman T, MacDonald L, Pink DA, and Zuckermann MJ, Computer simulation of the main gel–fluid phase transition of lipid bilayers, J. Chem. Phys. 79, 2027 (1983)
- (18) Corvera E, Laradji M, and Zuckermann MJ, Application of finite-size scaling to the Pink model for lipid bilayers, Phys. Rev. E 47, 696 (1993)
- (19) Yethiraj A and Weisshaar JC, Why Are Lipid Rafts Not Observed In Vivo?, Biophys. J. 93, 3113 (2007)
- (20) Gómez J, Sagués F, and Reigada R, Effect of integral proteins in the phase stability of a lipid bilayer: Application to raft formation in cell membranes, J. Chem. Phys. 132, 135104 (2010)
- (21) Fischer T and Vink RLC, Domain formation in membranes with quenched protein obstacles: Lateral heterogeneity and the connection to universality classes, J. Chem. Phys. 134, 055106 (2011)
- (22) Machta BB, Papanikolaou S, Sethna JP, and Veatch SL, Minimal Model of Plasma Membrane Heterogeneity Requires Coupling Cortical Actin to Criticality, Biophys. J. 100, 1668 (2011)
- (23) Ehrig J, Petrov EP, and Schwille P, Near-critical fluctuations and cytoskeleton-assisted phase separation lead to subdiffusion in cell membranes., Biophys. J. 100, 80 (2011)
- (24) Fischer T, Risselada HJ, and Vink RLC, Membrane lateral structure: The influence of immobilized particles on domain size, arXiv:1205.1001 (2012)
- (25) Imry Y and Ma SK, Random-Field Instability of the Ordered State of Continuous Symmetry, Phys. Rev. Lett. 35, 1399 (1975)
- (26) Imbrie JZ, Lower Critical Dimension of the Random-Field Ising Model, Phys. Rev. Lett. 53, 1747 (1984)
- (27) Bricmont J and Kupiainen A, Lower critical dimension for the random-field Ising model, Phys. Rev. Lett. 59, 1829 (1987)
- (28) Aizenman M and Wehr J, Rounding of first-order phase transitions in systems with quenched disorder, Phys. Rev. Lett. 62, 2503 (1989)
- (29) Mouritsen OG, Boothroyd A, Harris R, Jan N, Lookman T, MacDonald L, Pink DA, and Zuckermann MJ, Computer simulation of the main gel–fluid phase transition of lipid bilayers, J. Chem. Phys. 79, 2027 (1983)
- (30) Mouritsen OG, Computer Studies of Phase Transitions and Critical Phenomena (Springer-Verlag, Berlin, 1984)
- (31) Ipsen JH, Jørgensen K, and Mouritsen OG, Density fluctuations in saturated phospholipid bilayers increase as the acyl-chain length decreases, Biophys. J. 58, 1099 (1990)
- (32) Fischer T and Vink RLC, The Widom-Rowlinson mixture on a sphere: elimination of exponential slowing down at first-order phase transitions, J. Phys.: Condens. Matter 22, 104123 (2010)
- (33) Neuhaus T and Hager JS, 2D Crystal Shapes, Droplet Condensation, and Exponential Slowing Down in Simulations of First-Order Phase Transitions, J. Stat. Phys. 113, 47 (2003)
- (34) Binder K, Monte Carlo calculation of the surface tension for two- and three-dimensional lattice-gas models, Phys. Rev. A 25, 1699 (1982)
- (35) Virnau P and Muller M, Calculation of free energy through successive umbrella sampling, J. Chem. Phys. 120, 10925 (2004)
- (36) Ferrenberg AM and Swendsen RH, Optimized Monte Carlo data analysis, Phys. Rev. Lett. 63, 1195 (1989)
- (37) Fischer T and Vink RLC, Restricted orientation ”liquid crystal” in two dimensions: Isotropic-nematic transition or liquid-gas one(?), EPL 56003 (2009)
- (38) Orkoulas G, Fisher ME, and Panagiotopoulos AZ, Precise simulation of criticality in asymmetric fluids, Phys. Rev. E 63, 051507 (2001)
- (39) Binder K, Finite size scaling analysis of ising model block distribution functions, Z. Phys. B 43, 119 (1981)
- (40) Binder K, Critical Properties from Monte Carlo Coarse Graining and Renormalization, Phys. Rev. Lett. 47, 693 (1981)
- (41) Orkoulas G, Panagiotopoulos AZ, and Fisher ME, Criticality and crossover in accessible regimes, Phys. Rev. E 61, 5930 (2000)
- (42) Newman MEJ and Barkema GT, Monte Carlo Methods in Statistical Physics (Clarendon Press, Oxford, 1999)
- (43) Doniach S, Thermodynamic fluctuations in phospholipid bilayers, J. Chem. Phys. 68, 4912 (1978)
- (44) Michonova-Alexova EI and Sugár IP, Component and state separation in DMPC/DSPC lipid bilayers: a Monte Carlo simulation study., Biophys. J. 83, 1820 (2002)
- (45) Ehrig J, Petrov EP, and Schwille P, Phase separation and near-critical fluctuations in two-component lipid membranes: Monte Carlo simulations on experimentally relevant scales, New J. Phys. 13, 045019 (2011)
- (46) Mouritsen OG, Studies on the lack of cooperativity in the melting of lipid bilayers, BBA – Biomembranes 731, 217 (1983)
- (47) Xie AF, Yamada R, Gewirth AA, and Granick S, Materials Science of the Gel to Fluid Phase Transition in a Supported Phospholipid Bilayer, Phys. Rev. Lett. 89, 246103 (2002)
- (48) Tokumasu F, Jin AJ, Feigenson GW, and Dvorak JA, Atomic force microscopy of nanometric liposome adsorption and nanoscopic membrane domain formation, Ultramicroscopy 97, 217 (2003)
- (49) Seeger HM, Cerbo AD, Alessandrini A, and Facci P, Supported Lipid Bilayers on Mica and Silicon Oxide: Comparison of the Main Phase Transition Behavior, J. Phys. Chem. B 114, 8926 (2010)
- (50) Charrier A and Thibaudau F, Main Phase Transitions in Supported Lipid Single-Bilayer, Biophys. J. 89, 1094 (2005)
- (51) Yang J and Appleyard J, The Main Phase Transition of Mica-Supported Phosphatidylcholine Membranes, J. Phys. Chem. B 104, 8097 (2000)
- (52) Billoire A, Neuhaus T, and Berg BA, A determination of interface free energies, Nucl. Phys. B 413, 795 (1994)
- (53) Karatekin E, Sandre O, Guitouni H, Borghi N, Puech PH, and Brochard-Wyart F, Cascades of Transient Pores in Giant Vesicles: Line Tension and Transport, Biophys. J. 84, 1734 (2003)
- (54) Marcelja S, Molecular Model for Phase Transition in Biological Membranes, Nature 241, 451 (1973)
- (55) Marčelja S, Chain ordering in liquid crystals, BBA - Biomembranes 367, 165 (1974)
- (56) Scoville-Simonds M and Schick M, Theory of the effect of unsaturation on the main-chain transition, Phys. Rev. E 67, 011911 (2003)
- (57) van Enter ACD and Shlosman SB, First-Order Transitions for n-Vector Models in Two and More Dimensions: Rigorous Proof, Phys. Rev. Lett. 89, 285702 (2002)
- (58) Blöte HWJ, Guo W, and Hilhorst HJ, Phase Transition in a Two-Dimensional Heisenberg Model, Phys. Rev. Lett. 88, 047203 (2002)
- (59) Fish JM and Vink RLC, Finite-size effects at first-order isotropic-to-nematic transitions, Phys. Rev. B 80, 014107 (2009)