X–Ray view of Misaligned AGNs
Abstract
The Fermi–LAT satellite has recently discovered a small group of radio galaxies and steep spectrum radio sources: the misaligned AGNs (MAGNs) sample. We present the X–ray analysis of all the sources of this sample (7 FRIs and 3 FRIIs) with a firm GeV association. This study supports the idea that FRIIs host more efficient accretion mechanisms (0.1) than FRIs (0.003). Furthermore, in objects with high accretion rates the Broad Line Regions appear to be very active zones where, in addition to optical lines, the fluorescence iron K feature at 6.4 keV is also produced. It seems that the FRII jets propagate in an environment very rich in photons, explaining, at least at zeroth order, why the External Compton is the preferred mechanism to produce –rays. In FRIs, where also the iron line is difficult to be detected, the paucity of photons in the circumnuclear ambient seems to favor the Synchrotron Self Compton process.
I INTRODUCTION
With the term misaligned AGNs (MAGNs) we define radio–loud (RL) sources whose jet is pointed away from the observer, i.e., without strong Doppler boosting, with steep radio spectra (0.5) and resolved and possibly symmetrical radio structures. Given the large inclination angle of the jet, MAGNs were not considered favorite GeV targets, but the Fermi Large Area Telescope (LAT; atwood ) detection of 11 MAGNs in 15 months of survey magn has changed this view and confirmed them as a new interesting class of –ray emitters.
MAGNs are mainly FRI and FRII sources (and in minor part Steep Spectrum Radio Sources, SSRS, and Compact Steep Sources, CSS).
FRIs and FRIIs have been historically classified by Fanaroff & Riley fr on the base of their extended radio morphology that changes over, or under, a critical radio power at 178 MHz (P1025 W Hz-1 sr-1).
At zeroth order, the Unified Models of AGNs urry identify FRIs and FRIIs with the parent population of BL Lacs and Flat Spectrum Radio Quasars (FSRQs), i.e., their misaligned counterpart.
In the optical band, radio sources are divided into Broad Line Radio Galaxies (BLRGs) and Narrow Line Radio Galaxies (NLRGs) depending on their bright (weak) optical continuum and broad (narrow) emission lines. BLRGs at high redshift with steep radio spectra (0.5) are usually defined as Steep Spectrum Radio Sources (SSRS). Compact Steep Sources (CSS) have also steep radio spectra, but are very small, with sizes smaller than their host galaxies.
NLRGs are further divided into High Excitation Galaxies (HEG) and Low Excitation Galaxies (LEG) jackson 111A source is classified as LEG if EW10 Å and/or O[II]/O[III]1.. BLRGs and NLRG/HEGs have exclusively FRII morphology, while NLRG/LEGs can assume both FRI and FRII morphologies.
Despite the large amount of information on the properties of these objects, the cause of the FRI/FRII dichotomy is still unclear. Several scenarios have been proposed. For example, the dichotomy could be due to the different ambient medium in which the jet interacts bicknell . In this framework FRI jets start highly relativistic and decelerate between the sub–pc and kpc scales. According to reynolds the dichotomy could be ascribed to differences in the jet content. Finally, ghisellini proposed that the accretion process itself might play a key role in driving the dichotomic behavior of these sources.
There are several studies in the optical and infrared bands pointing out a possible difference in FRIs and FRIIs accretion modes. chiaberge demonstrated that the optical flux of FRI radio galaxies is strongly correlated with that of the radio core over four decades, suggesting a non–thermal synchrotron origin from the base of the jet for both emissions (their Figure 2). On the contrary, the excess in the optical luminosity of FRIIs can be related to the accretion disk. HST images of FRIs have shown that there is no nuclear absorption, meaning that the observed weakness of the optical lines can not be ascribed to obscuration, for example, by a dusty torus.
IR observations support this scenario. Recently, baldi found that the near infrared (NIR) luminosity is also correlated with the radio one (their Figures 5 and 6). FRIIs, instead, show a large NIR excess probably of thermal origin and related to hot circumnuclear dust (the torus) heated by an unbeamed and strong nuclear continuum.
The accretion rate bimodality leading the dichotomy was also suggested by marchesini . In particular, they found that FRIs are characterized by low accretion rates, while high accretion rates characterize FRIIs and quasars nuclei.
Here we present the X–ray analysis of ten MAGNs detected in 15 months of LAT survey magn .
X–rays are a powerful tool to address the FRI/FRII dichotomy, since they offer the unique possibility of directly observing the central engine and studying its impact on the circumnuclear environment.
II THE SAMPLE
We present the X–ray nuclear analysis of all MAGNs (7 FRIs and 3 FRIIs) with a firm LAT detection. Only PKS 0943-76, although present in the original sample, is not considered here since its –ray association is not secure. The studied MAGNs belong to the Cambridge (3CR bennett –spinrad and 3CRR laing ) and Molonglo (MS4) ms4a –ms4b radio catalogs. Table 1 lists the sources of the sample together with their redshifts, their radio and optical classifications and the X–ray satellites (Chandra, XMM–Newton, Swift, Suzaku) used to perform the analysis.
| Objects | z | Class | Sat.a | |
|---|---|---|---|---|
| Radio | Optical | |||
| 3C 78/NGC 1218 | 0.029 | FRI | G | C |
| 3C 84/NGC 1275 | 0.018 | FRI | G | X |
| M87/3C 274 | 0.004 | FRI | G | C |
| NGC 6251 | 0.0247 | FRI | G | X, Sw |
| PKS 0625-354 | 0.055 | FRI | G | X |
| Cen A | 0.0009 | FRI | G | X |
| 3C 120 | 0.033 | FRI | BLRG | X |
| 3C 111 | 0.0491 | FRII | BLRG | Sz, X |
| 3C 207 | 0.681 | FRII/SSRQ | - | X |
| 3C 380 | 0.692 | FRII/CSS | - | C |
| (a) C=Chandra; X=XMM–Newton; Sw=Swift; Sz=Suzaku | ||||
III X–RAY ANALYSIS
We reduced the archival data of the sources following standard procedures.
In this section we show, as an example, the analysis of three sources: a typical FRI (NGC 6251), a typical FRII (3C 111) and a peculiar radio galaxy (3C 120) with FRI morphology but characterized by an efficient accretion disk.
A typical FRI: NGC 6251
NGC 6251 is a luminous FRI, the fifth –ray brightest object among the MAGNs (see Table 2), located at z=0.0247.
This radio galaxy, already associated with the EGRET source 3EG J1621+8203 mukerjee , was detected by the Fermi–LAT in the first year of survey magn , 1FGL , 1LAC .
All available archival data, from XMM–Newton (2002 March) and Swift (2007 April – 2009 June) satellites were re–analyzed.
222The Chandra observation of 2003 November was affected by pile–up therefore is not taken into account.
The XMM–Newton best–fit spectrum (0.3–10 keV) is typical of FRI radio sources balmaverde . It is modeled by a power law (=1.890.04) absorbed by Galactic column density (NH,Gal=5.41020 cm-2, lab ) and intrinsic column density (a few 1020 cm-2), plus a thermal component (kT0.6 keV). There is no significant evidence for a Fe K emission line, in agreement with evans .
The Swift/X–Ray Telescope (XRT) observed NGC 6251 three times from 2007 to 2009.
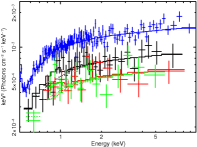
All spectral fits were performed in the 0.5–10 keV band. The best–fit model is an absorbed power law with column density slightly in excess of the Galactic value, in agreement with XMM–Newton data that require additional intrinsic absorption. The spectral slopes are steeper (2) than in XMM–Newton (but consistent within the errors). This is probably due to a low signal–to–noise ratio, that can not allow the detection of the soft thermal component. During the XMM–Newton pointing the source has a flux 40 higher than in the Swift observation. A further change in flux of about 15 was observed by Swift from 2007 to 2009 (see Figure 1). These 2 years represent the shortest period during which X–ray flux variability has been detected. This offers observational constraints on the nuclear origin of the high energy photons, probably produced in a region not larger than 1 pc. For more details about the X–ray analysis and the SED modeling refer to 6251 .
A typical FRII: 3C 111
3C 111 (z=0.0491) is a nearby FRII radio galaxy located at low Galactic latitude. Together with Centaurus A and NGC 6251, they are the only radio galaxies considered as EGRET candidate sources sguera –hartman . The Fermi–LAT instrument detected a –ray flare from this source in the period 2008 October–November magn –paola111 , immediately after an X–ray flux minimum (see Figure 2).
Here we present the analysis of two X–ray observations performed by Suzaku (t122 ks) and XMM–Newton (t124 ks) on 2008 August 22 and 2009 February 15, respectively.
We analyzed the data of both the front–illuminated (FI) and back–illuminated (BI) X–ray Imaging Spectrometers (XIS) xis onboard Suzaku.
The FI and BI spectra were grouped to have at least a minimum of 200 and 100 counts per bin, respectively.
Events within the 0.6–10 keV band were considered, and the region around the Si K edge (1.7–1.9 keV) discarded because of uncertainties in the calibration ballo .
The X–ray continuum was fitted with a power law (1.6) absorbed by Galactic column density. We left this parameter free to vary in order to take into account the contribution of a dense molecular cloud along the source line–of–sight.
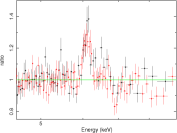
An inspection of the residuals around the iron K complex region (5–7.5 keV) reveals the presence of features in emission and absorption (Figure 3).
The emission line was fitted with a narrow (=0.070.03 keV) Gaussian profile of EW=7513 eV centered at E=6.40.02 keV.
Residuals of both FI and BI data show a trough at 7.2 keV (rest frame). The presence of such feature has been already claimed by previous authors ballo , tombesi . They interpreted the line as the resonant Fe XXVI Ly transition at 6.97 keV, outflowing at high velocity (v104 km s-1) from the accretion disk.
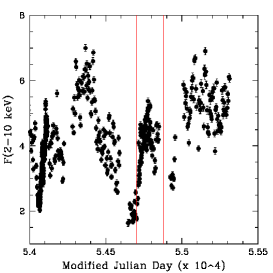
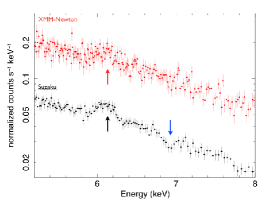
During the XMM–Newton observation the flux of 3C 111 was higher by a factor 2.5 (see Figures 2–4).
The spectrum is again well fitted by a power law (1.6) absorbed by Galactic NH similar to that measured in the previous observation. Residuals to the power law model reveal the presence of the iron K line at E=6.40.04 keV, characterized by =0.10.06 keV and EW=67 eV 333In both Suzaku and XMM–Newton spectra the addition of a narrow Fe K component around 7 keV further improves the fit..
There is a hint that the iron line is more prominent in the XMM–Newton observation than in the Suzaku one. The line seems to follow the continuum change but, given the large uncertainties on the line flux (and EW), no firm conclusion can be drawn.
However, a study of the iron line, based on six years of monitoring with the RXTE satellite chatterjee , indicates a strong correlation between the continuum and the iron line flux.
It is worth noting the lack in the XMM–Newton spectrum of the absorption feature around 7 keV (Figure 4). If these high velocity outflows really exist they should be transient phenomena. As argued by paola111 the presence of these winds in the X–ray spectrum could be related to a change in the disk–jet system.
Using the better constrained intrinsic width of the iron line detected by Suzaku (=0.070.03 keV), we can derive the velocity width of the K feature assuming Keplerian rotation around the black hole.
The obtained velocity width (FWHM) is 8000 km s-1, that is in the typical velocity range of Broad Line Regions (BLR) clouds.
3C 120: a FRI with a powerful accretion disk
3C 120 (z=0.033; burbidge ) is the softest –ray source of the MAGN sample (2.7). Its –ray emission was detected by Fermi–LAT in the 0.1–100 GeV energy band with a significance of 5.6 magn .
It is classified as FRI with a prominent radio jet lying at an angle of 20∘ to our line–of–sight jorstad and showing strong flux and structure variability gomez , walker .
Its optical spectrum is typical of Seyfert 1 galaxies with strong and broad emission lines, quite unusual for FRI radio sources. At UV wavelengths it shows a strong blue bump and strong emission lines signatures of a standard optically–thick geometrically–thin accretion disk maraschi .
After 3 years of X–ray and radio monitoring of 3C 120, marscher claimed the existence of a direct link between disk and jet, similar to that observed in black hole X–ray binaries. They found that X–ray dips are followed by the emission of bright superluminal radio knots. chatterjee2 support this claim using a longer monitoring. In addition, they found an anti–correlation between X–ray and 37 GHz fluxes, with X–rays leading the radio by 120 days. A strong correlation between X–ray and optical variations is also observed implying that optical and X–ray photons are produced in the same emitting region, probably the accretion disk–corona system.
In order to study the nuclear X–ray behavior of the source we re–analyzed an XMM–Newton archival observation of 130 ks (for further details see also ballantyne , ogle ).
Only pn and MOS2 data (taken in Small Window mode) were considered.
Spectra were binned to have at least 20 counts in each spectral channel in order to apply the statistic.
The spectrum of 3C 120 is complex. In particular, modeling the soft X–ray continuum (0.4–3 keV) is not trivial. For this reason here we concentrate on the hard X–ray band (3–10 keV) and refer to ogle and torresi for a discussion on the spectra at lower energies.
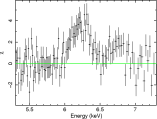
A power law is a good parametrization of the hard X–ray continuum (see Table 2). An inspection of the residuals shows two prominent emission features around 6.4 keV (Fe K) and 6.9 keV (probably a blend of Fe XXVI Ly and Fe K ogle ), respectively (Figure 5). From the width of the fluorescence iron line (=0.12 keV) we confirm the BLR as the zone where the line is emitted, in agreement with ogle .
IV Sample properties
The X–ray properties of the entire sample, reported in Table 2, suggest the following considerations:
| Name | Class | NHa | Fxb | Iron line | Fγc | ||
|---|---|---|---|---|---|---|---|
| 3C 78/NGC 1218 | FRI | 0.110.07 | 0.0440.01 | 2.03 | no | 4.71.8 | 1.950.14 |
| 3C 84/NGC 1275 | FRI | - | 0.760.01 | 1.780.02 | ? | 2228 | 2.130.02 |
| M87/3C 274 | FRI | 0.040.03 | 0.030.003 | 2.120.13 | no | 246 | 2.210.14 |
| NGC 6251 XMM–Newton | FRI | 0.0540.014 | 0.36 | 1.890.04 | no | 368 | 2.520.12 |
| PKS 0625-354 | FRI | 0.1 | 0.250.01 | 2.53 | no | 4.81.1 | 2.060.16 |
| Cen A | FRI | 8.10.1 | 191 | 1.440.03 | yes | 21412 | 2.750.04 |
| 3C 120 | FRI ? | - | 4.5 | 1.76 | yes | 2917 | 2.710.35 |
| 3C 111 Suzaku | FRII | 0.790.01 | 2.10.04 | 1.580.01 | yes | 408 | 2.540.19 |
| 3C 111 XMM–Newton | - | 0.780.01 | 4.70.09 | 1.630.01 | yes | - | - |
| 3C 207 | FRII/SSRQ | 0.13 | 0.15 | 1.65 | hint | 244 | 2.420.10 |
| 3C 380 | FRII/CSS | - | 0.150.01 | 1.480.09 | hint | 3118 | 2.510.30 |
| (a) Intrinsic NH is in units of 1022 cm-2, in addition to the Galactic column density. | |||||||
| (b) Fx (2–10 keV) is in units of 10-11 erg cm-2 s-1. Fluxes are unabsorbed. | |||||||
| (c) Fγ (100 MeV) is in units of 10-9 phot cm-2 s-1. | |||||||
-
•
FRIIs have, on average, X–ray photon indices harder than FRIs (2 and 1.6) supporting the idea that different electron populations (non–thermal in FRIs and thermal in FRIIs) are involved in the production of the X–ray continuum (see also balmaverde );
-
•
the iron line was not detected in four out of six genuine FRIs, supporting the inefficient accretion flow scenario. In 3C 84, located within the Perseus cluster, there is a claim of an iron line churazov whose origin is still uncertain. In Cen A the nature of the observed line has been debated. The low accretion rate of this source (10-3) 444On the basis of the SED of quasars we convert L2-10kev to Lbol using a convertor factor 30 elvis . We define =Lbol/LEdd, where the radiative efficiency is assumed equal to unity (see marchesini ). rejects the hypothesis of an efficient disk, making difficult to explain the presence of a fluorescence line at 6.4 keV. A possible solution is that the line arises from the interaction between external jet X–ray photons (having the jet a wide opening angle) and surrounding material paola2003 . Incidentally we note that a structured jet, consisting of an inner fast spine and an external slow layer has been proposed to explain the GeV emission in misaligned FRI AGNs ghis05 ;
-
•
when the accretion disk is efficient and the line well constrained it is possible to estimate the velocity width and localize the emitting gas. This seems to be located in the BLR, confirming rich in photons circumnuclear environment in sources with high accretion rates;
-
•
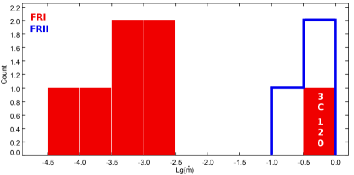
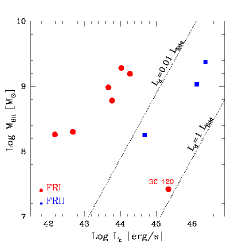
the X–ray luminosity can be utilized to estimate for each source of the sample. In Figure 6 the histogram of the MAGN accretion rates in Eddington units is shown. The bimodal behavior is evident, being FRIs and FRIIs clearly separated. This is even more clear in Figure 7 where black hole masses are plotted against disk luminosities (assuming disk luminosity bolometric luminosity). We note that in both figures 3C 120 falls well within the region occupied by FRIIs objects, as expected;
-
•
the environment of FRIs is generally believed to be poor in cold/dusty matter chiaberge , baldi . Unfortunately, our limited sample does not allow to support this picture. Indeed, all the MAGN sources, both FRIs and FRIIs, show negligible absorption in excess to the Galactic one. The only exceptions are Cen A (FRI) and 3C 111 (FRII). Cen A is known to be bisected by a prominent dust lane that can explain the high column density value. 3C 111 is occulted by a Galactic dark cloud in front of it.
V Conclusions
The X–ray analysis of MAGNs confirms the presence of different engines in FRI and FRII radio sources, as previously suggested by optical and infrared studies. In particular, FRI sources of the sample have Eddington ratios systematically lower (0.003) than FRIIs (0.1). This is in agreement with the general absence of the iron line in FRIs’ X–ray spectra. The peculiar source 3C 120, despite its radio classification, is very similar to 3C 111, the only genuine FRII radio galaxy of the sample (the other two FRIIs, 3C 207 and 3C 380 are quasars). The iron line clearly detected in 3C 120 and 3C 111 is probably produced in the BLR (rich in photons and matter). The jets of MAGNs having efficient accretion disks seem to propagate in an ambient plenty of photons. This would explain, at least at zeroth order, why External Compton is the dominant process responsible for the high energy photons emission in FRIIs’ jet. Instead in FRIs, inefficient accretion and paucity of environment photons make the Synchrotron Self Compton the most important process for the production of –rays.
Acknowledgements.
ET greatly thanks Paola Grandi for intense and inspiring discussions. The Fermi–LAT collaboration is gratefully acknowledged. ET kindly thanks the conference organizers and in particular Roopesh Ojha. This work was supported by the Italian Space Agency (contract ASI/GLAST I/017/07/0).References
- (1) W.B. Atwood, et al. 2009, ApJ, 697, 1071
- (2) A.A. Abdo et al. 2010, ApJ, 720, 912
- (3) B.L. Fanaroff, & J.M. Riley, 1974, MNRAS, 167, 31
- (4) C.M. Urry, & P. Padovani, 1995, PASPJ, 107, 803
- (5) N. Jackson, S. Rawlings, 1997, MNRAS, 286, 241
- (6) G.V. Bicknell, 1995, ApJS, 101, 29
- (7) C.S. Reynolds, A.C. Fabian, A. Celotti, M.J. Rees, 1996, MNRAS, 283, 873
- (8) G. Ghisellini & A. Celotti, 2001, A&A, 379, L1
- (9) M. Chiaberge, A. Capetti, A. Celotti, 2002, A&A, 394, 791
- (10) R.D. Baldi, M. Chiaberge, A. Capetti, et al. 2010, ApJ, 725, 2426
- (11) D. Marchesini, A. Celotti, L. Ferrarese, 2004, MNRAS, 351, 733
- (12) A.S. Bennett, 1962, MNRAS, 125, 75
- (13) H. Spinrad, J. Marr, L. Aguilar, S. Djorgovski, 1985, PASP, 97, 932
- (14) R.A. Laing, J.M. Riley, & M.S. Longair, 1983, MNRAS, 204, 151
- (15) A.M. Burgess, & R.W. Hunstead, 2006a, AJ, 131, 100
- (16) A.M. Burgess, & R.W. Hunstead, 2006b, AJ, 131, 114
- (17) R. Mukherjee, J. Halpern, N. Mirabal & E.V. Gotthelf, 2002, ApJ, 574, 693
- (18) A.A. Abdo et al. 2010, ApJS, 188, 405
- (19) A.A. Abdo et al. 2010, ApJ, 715, 429
- (20) B. Balmaverde, A. Capetti, P. Grandi, 2006, A&A, 451, 35
- (21) P.M.W. Kalberla et al. A&A, 440, 775
- (22) D.A. Evans, M.J. Hardcastle, J.H. Croston, et al. 2005, MNRAS, 359, 363
- (23) G. Migliori, P. Grandi, E. Torresi, et al. 2011, A&A, 533, A72
- (24) V. Sguera, L. Bassani, A. Malizia, et al. 2005, A&A, 430, 107
- (25) R.C. Hartman, M. Kadler, J. Tueller, 2008, ApJ, 688, 852
- (26) P. Grandi, E. Torresi, C. Stanghellini, 2012, ApJL, 751, L3
- (27) K. Koyama, et al. 2007, PASJ, 59, 23
- (28) L. Ballo, V. Braito, J.N. Reeves, et al. 2011, MNRAS, 418, 2367
- (29) F. Tombesi, J.N. Reeves, V. Braito, et al. 2010, ApJ, 719, 700
- (30) R. Chatterjee, A.P. Marscher, S.G. Jorstad, et al. 2011, ApJ, 734, 43
- (31) E.M. Burbidge, 1967, ApJ, 149, L51
- (32) S.G. Jorstad, et al. 2005, AJ, 130, 1418
- (33) J.L. Gomez, A.P. Marscher, A. Alberdi, et al. 2001, ApJ, 561, L161
- (34) R.C. Walker, J.M. Benson, S.C. Unwin, et al. 2001, ApJ, 556, 756
- (35) L. Maraschi, L. Chiappetti, R. Falomo, et al. 1991, ApJ, 368, 138
- (36) A.P. Marscher, et al. 2002, Nature, 417, 625
- (37) R. Chatterjee, A.P. Marscher, S. G. Jorstad, et al. 2011, ApJ, 704, 1689
- (38) D.R. Ballantyne, A.C. Fabian, K. Iwasawa, 2004, MNRAS, 354, 839
- (39) P.M. Ogle, S.W. Davis, R.R.J. Antonucci, et al. 2005, ApJ, 618, 139
- (40) E. Torresi, P. Grandi, E. Costantini, G.G.C. Palumbo, 2012, MNRAS, 419, 321
- (41) E. Churazov, W. Forman, C. JOnes, H. Bhringer, 2003, ApJ, 590, 225
- (42) M. Elvis, B.J. Wilkes, J.C. McDowell, et al. 1994, ApJS, 95, 1
- (43) P. Grandi, M. Fiocchi, C.G. Perola, et al. 2003, ApJ, 593, 160
- (44) G. Ghisellini, F. Tavecchio, M. Chiaberge, 2005, A&A, 432, 401
- (45) R. Narayan, & I. Yi, 1995, ApJ, 452, 710
- (46) N.I. Shakura, & R.A. Sunyaev, 1973, A&A, 24, 337