Analyses of Baby Name Popularity Distribution in
U.S. for the Last 131 Years
We examine the complete dataset of baby name popularity collected by U.S. Social Security Administration for the last 131 years (1880-2010). The ranked baby name popularity can be fitted empirically by a piecewise function consisting of Beta function for the high-ranking names and power-law function for low-ranking names, but not power-law (Zipf’s law) or Beta function by itself.
1 Introduction
Zipf’s law describes a class of ranked distributions, in which the ranked quantity falls off with rank by (). This “law” was originally observed in the word usage in human languages (Zipf, 1935) where is the number of times (number of “token”) the rank- word (a “type”) appears in a language text. But Zipf’s law also fit many other datasets, such as city population (Brakman et al., 2009), company size (Saichev et al., 2009), internet traffic (Rowlands, 2000), and many others (Li, 2002).
When a ranked quantity deviates from a perfect Zipf’s law, it is often dismissed as a “finite size effect”, i.e., fluctuation in the ranked quantity for low-ranking entities caused by small sample size. The assumption is that the fluctuation will be reduced in a larger sample size, and the Zipf’s law would be preserved. Unsatisfied with this explanation, Cocho and his colleagues proposed a new class of rank function similar in form to the Beta probability distribution that curves in a log(rank)-log(quantity) plot (Mansilla et al., 2007; Naumis and Cocho, 2008; Martínez-Mekler et al., 2009). This class of Beta rank functions has been proven to be an excellent fitting function of many datasets ranging from number of collaborators in a social network, number of citations per article and per journal (Mansilla et al., 2007; Campanario, 2010), to musical score and alphabet frequencies (Li, et al., 2010; Alvarez-Martinez et a;., 2011; Li and Miramontes, 2011; Petersen et al., 2011; Li, 2012a).
The success of the Beta rank function may lead to a belief that we may have a function universal enough to fit all ranked datasets. Indeed, there have been works to prove a universal mechanism behind the Beta rank function (Beltrán et al., 2011), or to relate the Beta rank function to a probability distribution (Sarabia et al., 2012). It was also an expectation that it may fit the baby name popularity data in U.S., to be analyzed in this paper, which is well documented by the U.S. Social Security Administration since 1880. If the number of babies with the same first name (born in the same year and with the given gender) are ranked by popularity ( for rank ), will the relationship be a power-law function (thus as another example of the Zipf’s law)? Or will it be a Beta ranked function?
2 The temporal trend of baby name popularity data
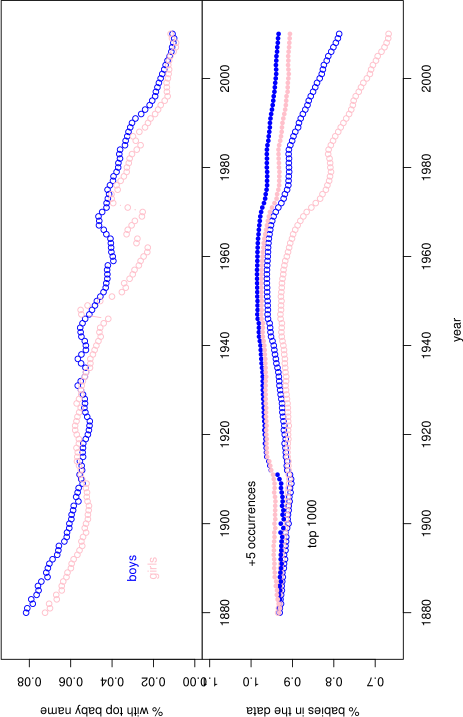
The baby name popularity data in U.S. since 1880 is available from the U.S. Social Security Administration (SSA) site: http://www.ssa.gov/oact/babynames/. The boy and girl’s names are listed separately. Two versions of the data can be downloaded from the website: the web form version for top 1000 (gender-specific) names, and the flatfile for all names with 5 or more occurrences. Baby names with less than 5 occurrences are not given to the public to “safeguard privacy”. Since both data are not 100% complete, we check how much of all births are included in the data by using the information of the top-1 baby name. The most popular baby name as a percentage of all births is plotted in Fig.1 (top). The number of all births (not directly provided by the SSA site) can be derived: . Fig.1 (bottom) shows the percentage of births included in the two datasets (top 1000 and +5 occurrences): ,
The top baby name was more dominant in early years than in recent years (the top boy names were John (1880-1923), Robert (1924-1939, 1953), James (1940-1952), Michael (1954-1959, 1961-1998), David (1960), Jacob (1999-2010), and the top girl names were Mary (1880-1946, 1953-1961), Linda (1947-1952), Lisa (1962-1969), Jennifer (1970-1984), Jessica (1985-1990, 1993-1995), Ashley (1991-1992), Emily (1996-2007), Emma (2008), Isabella (2009-2010)). However, to characterize the uneven naming of babies, using the statistics from the top name alone is not enough.
In economics, how the riches dominate over the poors in the wealth distribution can be measured by the Gini index: if the riches have all the wealth, the Gini index is 1; if there is no economic inequality, the Gini index is 0 (see, e.g., (Cowell, 2000)). A formula for Gini index from the ranked data is where is the maximum rank (number of entities) (implemented in, e.g., R package reldist (Handcock and Morris, 1999)).
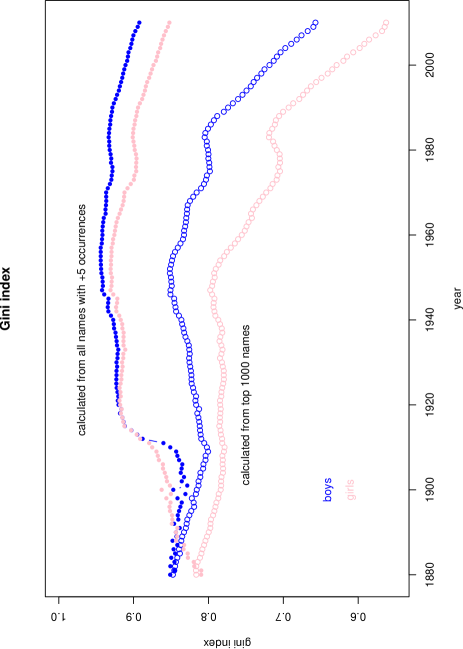
Fig.2 shows the Gini index calculated from both the top 1000 data and +5 occurrence data for the last 131 years. There are following observations: First of all, using only the top 1000 names will underestimate the Gini index, and the degree of underestimation is more severe with larger sample sizes. It is because the baby names not included in the data contribute more to the inequality of name popularity. With more babies born in recent years, top 1000 names cover less (Fig.1 bottom) of all births.
Secondly, there are more diversities (inequalities), generally speaking, in girl names than in boy names. A similar conclusion was reached in (Barry and Harper, 1995) by a regional data – the state of Pennsylvania – from comparing baby names in only two years, 1960 and 1990. This can partially be seen from Fig.1 as for most years, the top girl names tend to take a smaller percentage of all girl births than the corresponding top boy names.
Thirdly, there is a weak trend of lower Gini index in recent (e.g. 30) years, or more diverse name givings. A similar conclusion was also reached in (Twenge et al., 2010). This can be caused by many factors, such as more diverse immigrant groups in recent years. It is not clear how the increase of total number of names may contribute to this trend.
3 Fitting ranked baby name popularity
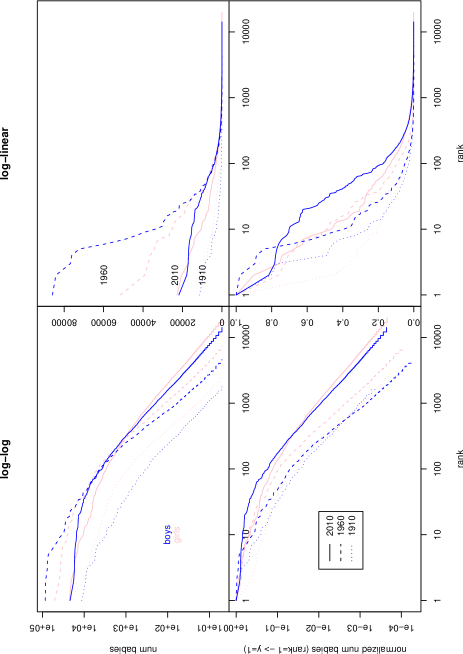
To find a better representation of the ranked distribution of baby name popularity, we show 4 different versions of the ranked distribution for the (+5 occurrence) data in years 1910, 1960, and 2010 in Fig.3. In principle, there are 16= 4 4 versions of plotting, first 4 for linear()-linear(), linear-log, log-linear, log-log, and the other 4 for original()-original(), normalized-original, original-normalized, and normalized-normalized. By normalizing, we mean divided by the maximum value. We discard the linear-linear and linear-log (because high-ranking names are not highlighted enough in these versions), we also discard the original-normalized and normalized-normalized (because the total number of baby names information is not available). For the remaining 4 versions in Fig.3, the log-log version seems to be the better representation as rank distributions from different years are closer to each other. The ranked normalized baby name popularities in log-log scale for every year from 1880 to 2010 are shown in Fig.4 (lines are shifted downward to improve visibility).
Each year’s ranked normalized baby name popularity data in Fig.4 is fitted by three functions, power-law function, Beta rank function, and a two-piece function:
| (3) |
The first is the power-law function (Zipf’s law), the second is the Beta function (Martínez-Mekler et al., 2009), where is the maximum rank in the +5 occurrence data (the total number of all baby names, including those with less than 5 occurrences, is unavailable), and the last function is a two-piece function with Beta function for high-ranking and power-law function for low-ranking regimes.
The two-piece function is motivated by inspecting the ranked plots in Fig.4: the high-ranking points seem to follow a straight line, whereas the low-ranking points are curved in the log-log plot. This choice is also motivated by the fact that the fitting of Beta function in the linear-linear scale by the non-linear least-square regression (Bates and Watts, 1988; Li and Miramontes, 2011; Li, 2012a) does not converge for these datasets (results not shown), indicating that Beta function does not fit the data well in the full rank range.
The segmentation point is not known beforehand. We determine its value by minimizing the overall sum-of-squared-error (SSE):
| (4) |
To save computing time, we limit the range of choice of between and .
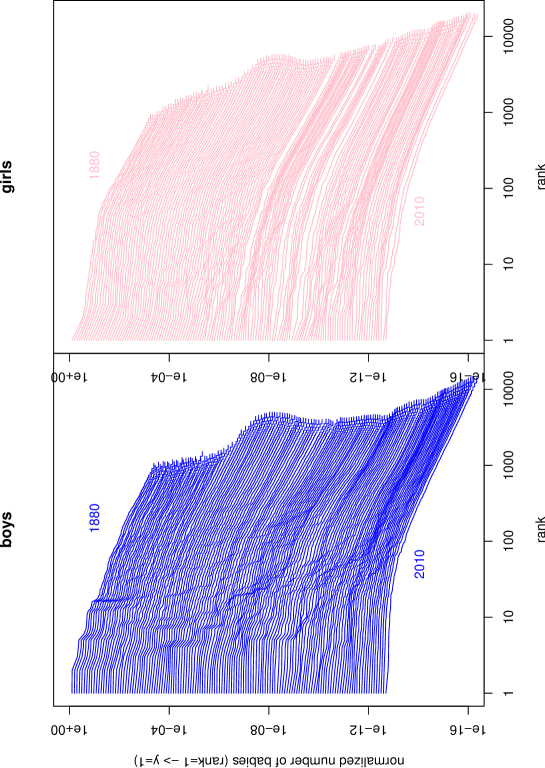
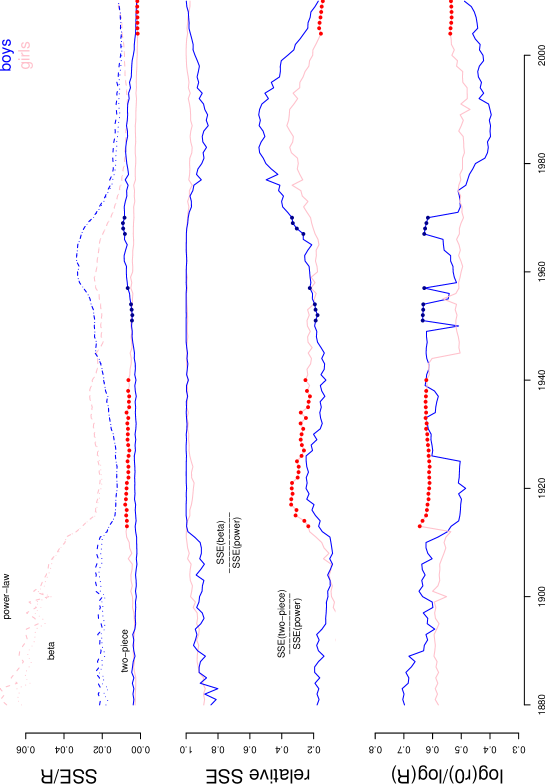
Fig.5 and Fig.6 show all fitting results by these three functions for the baby popularity data of the last 131 years. The top plot is the SSE per point (i.e., SSE in Eq.(3) divided by the maximin rank) for the power-law function, Beta function, and two-piece function. The data for boys is in blue color, that for girls in pink. The Beta function reduces the SSE as compared to the power-law function, but the reduction is not large. On the other hand, the two-piece function fits the data much better. For the two-piece function, if the is chosen at the boundary of our selected range (e.g. ), it indicates that SSE may be reduced even further if we remove the constraint. These datasets are marked by red/darkblue dots in Fig.5.
The second plot in Fig.5 is the relative SSE: SSE for Beta function, and SSE for the two-piece function, over that for the power-law function. The ratio is only slighly less than 1 for the Beta function, but is as low as 0.2-0.3 for two-piece functions.
The third plot in Fig.5 is the relative position of the segmentation point in the logarithmic scale: . If this value is 0.5, then Beta and power-law function covers half of the log-rank range in the two-piece function.
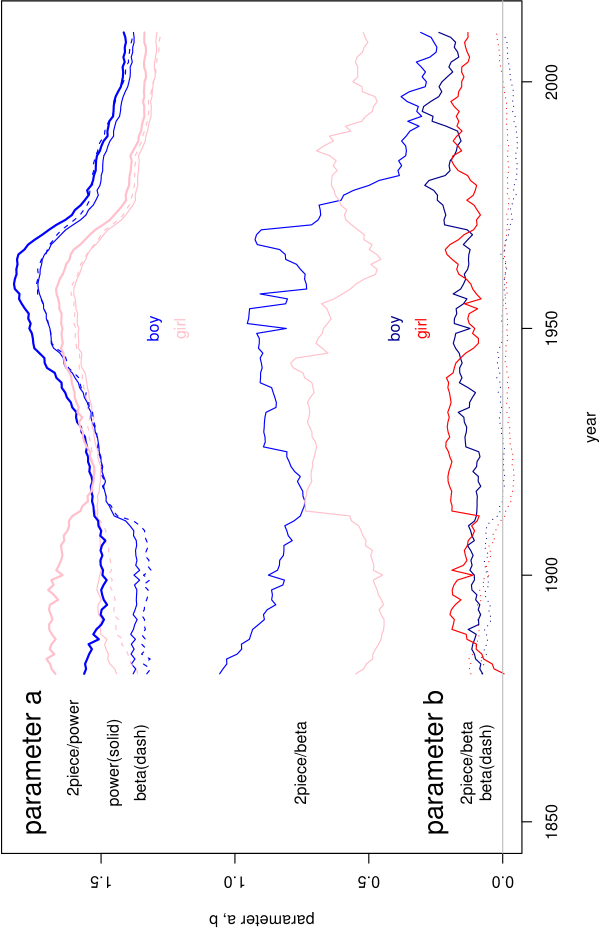
Fig.6 shows the fitted parameter values for in the power-law function, in Beta-function, in both parts in the two-piece function. The value of is mostly between 1 and 2, but for the Beta function in the two-piece situation, is mostly less than 1. The value in Beta function fluctuates around 0, but for the Beta function in the two-piece situation becomes much larger (median value is 0.14-0.16).
All these results point to the conclusion that our two-piece function, with Beta function for the low-ranking data and power-law function for the high-ranking data, fits the data much better than both power-law function and Beta function by themselves. Graphically speaking, it is another way to state that in log-log plot, the ranked baby name popularity in a typical year curves down, then followed by a straight line.
4 Discussion
The universality of power-law distribution in nature as well as human-related data is heatedly debated (Clauset et al., 2009). To require a power-law to be true for all ranges is clearly a very strong constraint, and not many datasets can pass the test. The introduction of Beta rank function (Martínez-Mekler et al., 2009) is to relax the strong requirement and increase the number of datasets to be well fitted. The main contribution of this paper is that even Beta rank function may fail to fit some dataset well, such as the baby name popularity data.
Our choice of using Beta function for high-ranking names and power-law function for low-ranking names is empirically based on examining the raw data in log-log plot, but it has interesting parallels in other fields. It has been observed in linguistic data that Beta rank function tends to fit the data very well when the maximum rank is limited, for example, for the ranked letter frequency distribution (Li and Miramontes, 2011). On the other hand, it may not be the case when there is no limit on the maximum rank, such as the word frequency distribution, where the mechanism for data generation is described by the “large number of rare events” model (Baayen, 2001).
We can imagine a situation in which quantitative law governing the popular names (fewer and limited) distribution being distinct from that for rare names (numerous and unlimited). A similar idea in separating high-ranking and low-ranking events in another application (polymorphous Chinese syllables versus regular syllables) was discussed in (Li, 2012b).
As in the case of any empirical fitting of data, other empirical alternatives are possible. If particular, with only 100 or less (median of the first regime in the two-piece function) points to fit, many other functions other than Beta rank function may also be used. If the heterogeneity between high- and low-ranking names does indeed exist, then it is a challenge to find a single functional form which could fit the ranked baby popularity data in its whole rank range.
Acknowledgements
I would like to thank Pedro Miramontes and Jan Freudenberg for comments and the Robert S Boas Center for Genomics and Human Genetics for support.
References
- Alvarez-Martinez et a;., (2011) R Alvarez-Martinez, G Martínez-Mekler, G Cocho (2011), “Order-disorder transition in conflicting dynamics leading to rank-frequency generalized beta distribution”, Physica A, 390:120-130.
- Baayen, (2001) RH Baayen (2001) Word Frequency Distributions (Kluwer Academic Publishers).
- Barry and Harper, (1995) H Barry III, AS Harper (1995), “Increased choice of female phonetic attributes in first names”, Sex Roles, 32:809-819.
- Bates and Watts, (1988) DM Bates, DG Watts (1988), Nonlinear Regression Analysis and Its Applications (Wiley).
- Beltrán et al., (2011) M Beltrán del Río, G Martínez-Mekler, R Mansilla (2011), “General model of subtraction of stochastic variables. Attractor and stability analysis”, Physica A, 390:154-160.
- Brakman et al., (2009) S Brakman, H Garretsen, C van Marresijk (2009) The New Introduction to Geographical Economics (Cambridge Univ. Press).
- Campanario, (2010) JM Campanario (2010), “Distribution of ranks of articles and citations in journals”, Journal of American Society for Information Science and Technology, 61:419-423.
- Clauset et al., (2009) A Clauset, CR Shalizi, MEJ Newman (2009), “Power-law distributions in empirical data”, SIAM Review, 51:661-703.
- Cowell, (2000) F Cowell (2000), “Measurement of inequality”, in Handbook of Income Distribution, eds. AB Atkinson, F Bourguignon (North Holland).
- Handcock and Morris, (1999) MS Handcock, M Morris (1999), Relative Distribution Methods in the Social Sciences (Springer).
- Li, (2002) W Li (2002), “Zipf’s law everywhere”, Glottometrics, 5:14-21.
- Li, (2012a) W Li (2012a), “Fitting Chinese syllable-to-character mapping spectrum by the beta rank function”, Physica A, 391:1515-1518.
- Li, (2012b) W Li (2012b), “Characterizing ranked Chinese syllable-to-character mapping spectrum: a bridge between spoken and written Chinese language”, Journal of Quantitative Linguistics, submitted.
- Li and Miramontes, (2011) W Li, P Miramontes (2011), “Fitting ranked English and Spanish letter frequency distribution in U.S. and Mexican presidential speeches”, Journal of Quantitative Linguistics, 18:337-358.
- Li, et al., (2010) W Li, P Miramontes, G Cocho (2010), “Fitting ranked linguistic data with two-parameter functions”, Entropy, 12:1743-1764.
- Mansilla et al., (2007) R Mansilla, E Köppen, G Cocho, P Miramontes (2007), “On the behavior of journal impact factor rank-order distribution”, Journal of Informetrics, 1:155-160.
- Martínez-Mekler et al., (2009) G Martínez-Mekler, RA Martínez, M Beltrán del Río, R Mansilla, P Miramontes, G Cocho (2009), “Universality of rank-ordering distributions in the arts and sciences”, PLoS ONE, 4:e4791.
- Naumis and Cocho, (2008) GG Naumis, G Cocho (2008), “Tail universalities in rank distributions as an algebraic problem: The beta-like function”, Physica A, 387:84-96.
- Petersen et al., (2011) AM Petersen, HE Stanley, S Succi (2011), “Statistical regularities in the rank-citation profile of scientists”, Scientific Reports, 1:181
- Rowlands, (2000) I Rowlands (2000), “Who can count the dust of Jacob? From bibliometrics to cybermetrics”, in The Internet: Its Impact and Evaluation, eds. D Nicholas, I Rowlands (Aslib/IMI).
- Saichev et al., (2009) A Saichev, Y Malevergne, D Sornette (2009), Theory of Zipf’s Law and Beyond (Springer).
- Sarabia et al., (2012) JM Sarabia, F Prieto, C Trueba (2012), “Modeling the probabilistic distribution of the impact factor”, Journal of Informetrics, 6:66-79.
- Twenge et al., (2010) JM Twenge, EM Abebe, WK Campbell (2010), “Fitting in or standing out: trends in American parents’ choices for children’s names, 1880-2007”, Social Psychological & Personality Science, 1:19-25.
- Zipf, (1935) GK Zipf (1935), The Psycho-Biology of Languages (Houghton-Mifflin: Boston, MA, USA).