K. Negishi
Tohoku University, Sendai
Y. Horii
Kobayashi-Maskawa Institute, Nagoya University, Nagoya
Y. Onuki
Department of Physics, University of Tokyo, Tokyo
T. Sanuki
Tohoku University, Sendai
H. Yamamoto
Tohoku University, Sendai
I. Adachi
High Energy Accelerator Research Organization (KEK), Tsukuba
H. Aihara
Department of Physics, University of Tokyo, Tokyo
D. M. Asner
Pacific Northwest National Laboratory, Richland, Washington 99352
T. Aushev
Institute for Theoretical and Experimental Physics, Moscow
A. M. Bakich
School of Physics, University of Sydney, NSW 2006
Y. Ban
Peking University, Beijing
K. Belous
Institute of High Energy Physics, Protvino
B. Bhuyan
Indian Institute of Technology Guwahati, Guwahati
A. Bondar
Budker Institute of Nuclear Physics SB RAS and Novosibirsk State University, Novosibirsk 630090
T. E. Browder
University of Hawaii, Honolulu, Hawaii 96822
M.-C. Chang
Department of Physics, Fu Jen Catholic University, Taipei
A. Chen
National Central University, Chung-li
P. Chen
Department of Physics, National Taiwan University, Taipei
B. G. Cheon
Hanyang University, Seoul
K. Chilikin
Institute for Theoretical and Experimental Physics, Moscow
R. Chistov
Institute for Theoretical and Experimental Physics, Moscow
I.-S. Cho
Yonsei University, Seoul
K. Cho
Korea Institute of Science and Technology Information, Daejeon
Y. Choi
Sungkyunkwan University, Suwon
J. Dalseno
Max-Planck-Institut für Physik, München
Excellence Cluster Universe, Technische Universität München, Garching
Z. Doležal
Faculty of Mathematics and Physics, Charles University, Prague
Z. Drásal
Faculty of Mathematics and Physics, Charles University, Prague
A. Drutskoy
Institute for Theoretical and Experimental Physics, Moscow
S. Eidelman
Budker Institute of Nuclear Physics SB RAS and Novosibirsk State University, Novosibirsk 630090
J. E. Fast
Pacific Northwest National Laboratory, Richland, Washington 99352
V. Gaur
Tata Institute of Fundamental Research, Mumbai
N. Gabyshev
Budker Institute of Nuclear Physics SB RAS and Novosibirsk State University, Novosibirsk 630090
Y. M. Goh
Hanyang University, Seoul
J. Haba
High Energy Accelerator Research Organization (KEK), Tsukuba
H. Hayashii
Nara Women’s University, Nara
Y. Hoshi
Tohoku Gakuin University, Tagajo
W.-S. Hou
Department of Physics, National Taiwan University, Taipei
H. J. Hyun
Kyungpook National University, Taegu
T. Iijima
Kobayashi-Maskawa Institute, Nagoya University, Nagoya
Graduate School of Science, Nagoya University, Nagoya
K. Inami
Graduate School of Science, Nagoya University, Nagoya
A. Ishikawa
Tohoku University, Sendai
R. Itoh
High Energy Accelerator Research Organization (KEK), Tsukuba
M. Iwabuchi
Yonsei University, Seoul
Y. Iwasaki
High Energy Accelerator Research Organization (KEK), Tsukuba
T. Iwashita
Nara Women’s University, Nara
T. Julius
University of Melbourne, School of Physics, Victoria 3010
J. H. Kang
Yonsei University, Seoul
T. Kawasaki
Niigata University, Niigata
C. Kiesling
Max-Planck-Institut für Physik, München
H. J. Kim
Kyungpook National University, Taegu
J. B. Kim
Korea University, Seoul
J. H. Kim
Korea Institute of Science and Technology Information, Daejeon
K. T. Kim
Korea University, Seoul
M. J. Kim
Kyungpook National University, Taegu
Y. J. Kim
Korea Institute of Science and Technology Information, Daejeon
B. R. Ko
Korea University, Seoul
P. Kodyš
Faculty of Mathematics and Physics, Charles University, Prague
S. Korpar
University of Maribor, Maribor
J. Stefan Institute, Ljubljana
R. T. Kouzes
Pacific Northwest National Laboratory, Richland, Washington 99352
P. Krokovny
Budker Institute of Nuclear Physics SB RAS and Novosibirsk State University, Novosibirsk 630090
T. Kuhr
Institut für Experimentelle Kernphysik, Karlsruher Institut für Technologie, Karlsruhe
Y.-J. Kwon
Yonsei University, Seoul
S.-H. Lee
Korea University, Seoul
J. Libby
Indian Institute of Technology Madras, Madras
C. Liu
University of Science and Technology of China, Hefei
Y. Liu
University of Cincinnati, Cincinnati, Ohio 45221
Z. Q. Liu
Institute of High Energy Physics, Chinese Academy of Sciences, Beijing
R. Louvot
École Polytechnique Fédérale de Lausanne (EPFL), Lausanne
D. Matvienko
Budker Institute of Nuclear Physics SB RAS and Novosibirsk State University, Novosibirsk 630090
S. McOnie
School of Physics, University of Sydney, NSW 2006
K. Miyabayashi
Nara Women’s University, Nara
H. Miyata
Niigata University, Niigata
Y. Miyazaki
Graduate School of Science, Nagoya University, Nagoya
D. Mohapatra
Pacific Northwest National Laboratory, Richland, Washington 99352
A. Moll
Max-Planck-Institut für Physik, München
Excellence Cluster Universe, Technische Universität München, Garching
N. Muramatsu
Research Center for Electron Photon Science, Tohoku University, Sendai
E. Nakano
Osaka City University, Osaka
M. Nakao
High Energy Accelerator Research Organization (KEK), Tsukuba
S. Nishida
High Energy Accelerator Research Organization (KEK), Tsukuba
K. Nishimura
University of Hawaii, Honolulu, Hawaii 96822
O. Nitoh
Tokyo University of Agriculture and Technology, Tokyo
S. Ogawa
Toho University, Funabashi
T. Ohshima
Graduate School of Science, Nagoya University, Nagoya
S. Okuno
Kanagawa University, Yokohama
G. Pakhlova
Institute for Theoretical and Experimental Physics, Moscow
H. K. Park
Kyungpook National University, Taegu
T. K. Pedlar
Luther College, Decorah, Iowa 52101
R. Pestotnik
J. Stefan Institute, Ljubljana
M. Petrič
J. Stefan Institute, Ljubljana
L. E. Piilonen
CNP, Virginia Polytechnic Institute and State University, Blacksburg, Virginia 24061
M. Röhrken
Institut für Experimentelle Kernphysik, Karlsruher Institut für Technologie, Karlsruhe
S. Ryu
Seoul National University, Seoul
K. Sakai
High Energy Accelerator Research Organization (KEK), Tsukuba
Y. Sakai
High Energy Accelerator Research Organization (KEK), Tsukuba
O. Schneider
École Polytechnique Fédérale de Lausanne (EPFL), Lausanne
C. Schwanda
Institute of High Energy Physics, Vienna
A. J. Schwartz
University of Cincinnati, Cincinnati, Ohio 45221
K. Senyo
Yamagata University, Yamagata
M. E. Sevior
University of Melbourne, School of Physics, Victoria 3010
M. Shapkin
Institute of High Energy Physics, Protvino
V. Shebalin
Budker Institute of Nuclear Physics SB RAS and Novosibirsk State University, Novosibirsk 630090
T.-A. Shibata
Tokyo Institute of Technology, Tokyo
J.-G. Shiu
Department of Physics, National Taiwan University, Taipei
B. Shwartz
Budker Institute of Nuclear Physics SB RAS and Novosibirsk State University, Novosibirsk 630090
A. Sibidanov
School of Physics, University of Sydney, NSW 2006
F. Simon
Max-Planck-Institut für Physik, München
Excellence Cluster Universe, Technische Universität München, Garching
P. Smerkol
J. Stefan Institute, Ljubljana
Y.-S. Sohn
Yonsei University, Seoul
E. Solovieva
Institute for Theoretical and Experimental Physics, Moscow
S. Stanič
University of Nova Gorica, Nova Gorica
M. Starič
J. Stefan Institute, Ljubljana
M. Sumihama
Gifu University, Gifu
T. Sumiyoshi
Tokyo Metropolitan University, Tokyo
S. Suzuki
Saga University, Saga
G. Tatishvili
Pacific Northwest National Laboratory, Richland, Washington 99352
Y. Teramoto
Osaka City University, Osaka
K. Trabelsi
High Energy Accelerator Research Organization (KEK), Tsukuba
M. Uchida
Tokyo Institute of Technology, Tokyo
T. Uglov
Institute for Theoretical and Experimental Physics, Moscow
Y. Unno
Hanyang University, Seoul
S. Uno
High Energy Accelerator Research Organization (KEK), Tsukuba
P. Urquijo
University of Bonn, Bonn
G. Varner
University of Hawaii, Honolulu, Hawaii 96822
K. E. Varvell
School of Physics, University of Sydney, NSW 2006
V. Vorobyev
Budker Institute of Nuclear Physics SB RAS and Novosibirsk State University, Novosibirsk 630090
C. H. Wang
National United University, Miao Li
M.-Z. Wang
Department of Physics, National Taiwan University, Taipei
P. Wang
Institute of High Energy Physics, Chinese Academy of Sciences, Beijing
M. Watanabe
Niigata University, Niigata
Y. Watanabe
Kanagawa University, Yokohama
E. Won
Korea University, Seoul
B. D. Yabsley
School of Physics, University of Sydney, NSW 2006
Y. Yamashita
Nippon Dental University, Niigata
C. C. Zhang
Institute of High Energy Physics, Chinese Academy of Sciences, Beijing
Z. P. Zhang
University of Science and Technology of China, Hefei
V. Zhilich
Budker Institute of Nuclear Physics SB RAS and Novosibirsk State University, Novosibirsk 630090
V. Zhulanov
Budker Institute of Nuclear Physics SB RAS and Novosibirsk State University, Novosibirsk 630090
A. Zupanc
Institut für Experimentelle Kernphysik, Karlsruher Institut für Technologie, Karlsruhe
Abstract
We report a study of the decay followed by ,
where indicates or .
We reconstruct the state in a phase space corresponding to .
The -violating angle affects its decay rate via the interference between and transitions.
The result is obtained from a 711 data sample that contains 772 pairs collected at the resonance with the Belle detector at the KEKB asymmetric-energy collider.
We measure the ratio to be ,
and set an upper limit of at the 95% confidence level.
pacs:
13.25.Hw, 11.30.Er, 12.15.Hh, 14.40.Nd
Determination of the parameters of the standard model is important as a consistency check
and as a way to search for new physics.
In the standard model, the Cabibbo-Kobayashi-Maskawa (CKM) matrix CKM consists of four independent weak interaction parameters for the quark sector;
the three -violating phases , and are defined as the angles of one particular CKM unitarity triangle
with the latter defined as .
This phase is less accurately determined than the other two phi12 .
In the usual quark-phase convention where large complex phases appear only in and Wolfenstein ,
the measurement of is equivalent to the extraction of the phase of relative to the phases of other CKM matrix elements.
To date, the measurement has been advanced mainly by exploiting charged meson decays into final states
GLW_Belle_result ; Dalitz_Belle_result ; GLW_CDF_result ; GLW_BaBar_result ; ADS_BaBar_result ; Dalitz_BaBar_result ; ADS_CDF_result ; ADS_Belle_result ; LHCb_result
wherein the sensitivity is due to the interference between the two amplitudes of and decays into a common final state.
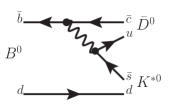
In this paper, we consider the neutral meson decay as an alternative process for measuring the angle .
As shown by the Feynman diagrams in Fig. 1,
a weak decay of the meson is tagged by the decaying into charge .
Figure 1: Diagrams for the and decays.
The dependence in the transition
is extracted from the interference of the two decay paths,
which occurs when the and mesons decay to the same final state.
where is the ratio for decay amplitudes
and is the strong phase difference of the two decays appearing in this ratio.
Both and have been obtained experimentally HFAG .
The parameters , and are defined as
(2)
(3)
where and are the magnitudes of the amplitudes for the and transitions, respectively,
and is the relative strong phase.
The variable indicates the position in the Dalitz plot.
In this analysis, we calculate the integrals over a phase space of the state .
In the case of a two-body decay,
becomes the ratio of the amplitudes for and and becomes 1.
The value of is expected to be around 0.4, which is obtained from and depends on strong interaction effects.
According to a simulation study using a Dalitz model based on recent measurements BaBar_k ,
the value of is around 0.95 in the phase space of interest here.
One observable is not enough to extract the four unknowns , , , and .
However, the measurements for other decays such as and provide additional information needed to extract ,
where the observable should be defined in the same phase space of the decay between different decays so that the same parameters , , and can be used.
The decay in the numerator of Eq. (1) is the signal mode, referred to as the “suppressed mode,”
while the decay in the denominator is the calibration mode referred to as the “favored mode.”
This result is based on a data sample that contains 772 pairs,
collected with the Belle detector at the KEKB asymmetric-energy (3.5 on 8 GeV) collider KEKB operating at the resonance.
The Belle detector is a large-solid-angle magnetic spectrometer that consists of a silicon vertex detector,
a 50-layer central drift chamber (CDC),
an array of aerogel threshold Cherenkov counters (ACC),
a barrel-like arrangement of time-of-flight scintillation counters (TOF),
and an electromagnetic calorimeter comprised of CsI(Tl) crystals located inside a superconducting solenoid coil that provides a 1.5 T magnetic field.
An iron flux-return located outside of the coil is instrumented to detect mesons and to identify muons.
The detector is described in detail elsewhere Belle .
Charged kaon and pion candidates are identified using ionization loss in the CDC and information from the ACC and the TOF.
The efficiency is 85–95% and the probability of misidentification is 10–20%.
We reconstruct mesons from pairs of oppositely-charged kaon and pion candidates.
We require that the invariant mass is within 15 () of the nominal mass.
candidates are reconstructed from pairs.
We require that the invariant mass is within 50 of the nominal mass.
We combine and candidates to form mesons.
Candidate events are identified by the energy difference
and the beam-constrained mass ,
where is the beam energy and and are the momenta and energies, respectively,
of the meson decay products in the center-of-mass (CM) frame.
We select events with and .
In the rare case where there are multiple candidates in an event,
the candidate with closest to its nominal value is chosen.
Among other decays, the most serious background for the suppressed mode comes from .
This decay produces the same final state as the signal,
and the product branching fraction is about 10 times higher than that expected for the signal.
To suppress this background, we exclude candidates for which the invariant mass of the system is within 18 () of the nominal mass.
The relative loss in the signal efficiency is 0.5%.
Large combinatorial background of true and random and combinations from the process and other decays
is reduced if the is a decay product of
by using the mass difference between the and systems,
where a candidate is added to the latter to form the former.
If for any additional candidate not used in the candidate reconstruction, the event is retained.
This requirement removes 24% of background and 14% of background according to Monte Carlo (MC) simulation.
The relative loss in signal efficiency is 5.0%.
To discriminate the large combinatorial background dominated by the two-jet-like continuum process,
where indicates , , or , a multivariate analysis is performed using the following nine variables.
1) A variable obtained from the Fisher discriminants based on modified Fox-Wolfram moments SFW
where the coefficients of the Fisher discriminants are optimized using the signal and MC samples.
This variable exploits the event topology,
which is spherical and jet-like for and events, respectively.
2) The angle in the CM frame between the thrust axes of the decay and the detected remainders.
For the latter, we assign the pion mass to all the charged particles
and use photons with energy above 0.1 .
3) The signed difference of the vertices between the candidate and the remaining charged tracks.
For the signal event, the absolute value tends to be larger because of the longer lifetime of the meson.
4) The angle between the candidate from the decay and the candidate in the rest frame of the candidate.
Its distribution is flat for signal events but peaked near the extreme values for background.
5) The expected flavor dilution factor described in Ref. TaggingNIM .
It ranges from zero for no flavor information to unity for unambiguous flavor assignment.
candidates tend to have a larger flavor dilution factor than background.
6) The angle between the meson momentum direction and the beam axis in the CM frame.
The decays follow a distribution, while the background is nearly flat in .
7) The distance of closest approach between the trajectories of the and candidates.
The value is close to zero for the signal but tends to be larger for the background.
8) The difference between the sum of the particle charges in the hemisphere and the sum in the opposite hemisphere,
excluding those used in the reconstruction of the meson.
The average charge difference is 0 for the signal events but for the events, depending on the flavor of the candidate.
9) The angle between the and directions in the rest frame of the candidate.
The cosine distribution is about flat for signal events but peaks toward for events.
To effectively combine these nine variables,
we employ the NeuroBayes neural network package NB .
The NeuroBayes output is denoted as with a range of [1, 1].
For example, events at are signal-like and events at are -like.
The training for the neural network optimization is performed by using the signal and the MC samples,
each of which contains 100,000 events after the event-selection requirements.
For the latter sample, we loosen the requirement on to to obtain a larger number of events,
since all the input parameters have little correlation with .
The distribution peaks at and is therefore difficult to represent with a simple analytic function.
However, the transformed variable
(4)
where and ,
has a distribution that can be modelled by a Gaussian.
The events with are rejected.
The background rejection rate is 70.5%, while the signal loss is 3.9%.
The number of signal events is obtained by a two-dimensional unbinned extended maximum likelihood fit to and .
The fits are applied separately for favored and suppressed modes.
For both modes, we categorize five common contributions.
These are the signal,
the background,
the combinatorial background,
the background,
and the backgrounds that have peaks in the signal region of and (“peaking background”).
In the favored mode, we include two more components: and .
The decay satisfies the selection criteria when a pion from the decay is misidentified as a kaon.
This component also includes other decays that satisfy the selection criteria when a pion in the final state is misidentified as a kaon.
The peaking background for the suppressed mode consists of and
while the peaking background for the favored mode consists of .
For the and backgrounds,
a pion candidate is added to reconstruct ,
where the latter satisfies the selection when the is misidentified as .
We prepare two-dimensional probability density functions (PDFs) for each component as a product of one-dimensional PDFs on and ,
since the correlation between and is found to be small.
The PDFs for a favored mode are parameterized by a double Gaussian for signal, a double Gaussian for ,
an exponential function for background,
a linear function for background,
a Crystal Ball function for ,
and a double bifurcated Gaussian for .
The means and widths of the double-Gaussian PDFs for the signal and components are fixed from MC samples.
The mean of the distribution for is higher than that for the signal by about 70 due to misidentification of a pion as a kaon.
The parameters of the exponential and linear PDFs are allowed to float.
The PDF for the peaking background is defined to be that of the signal,
and the yield is fixed by the world-average value of the branching fraction PDG .
The mean values of for and are higher than those for the signal due to one additional pion and a misidentification for the latter mode.
The shape parameters of the PDFs for these components are determined from MC
and their yields are fixed by the world-average value of the branching fraction.
The PDF is a sum of two Gaussians for each component.
The shapes for the signal and background are fixed from the MC samples of each decay model.
The PDF for is defined by the same function as that of background.
The PDF for the peaking background is described as a weighted sum of MC-based PDFs for all the constituents.
The shape for the background is fixed from the sideband data sample in data defined by .
The validity of this use of the sideband sample,
which is reasonable since all inputs for have little correlation with ,
is checked using MC samples.
The PDF for and is the same as that of the background.
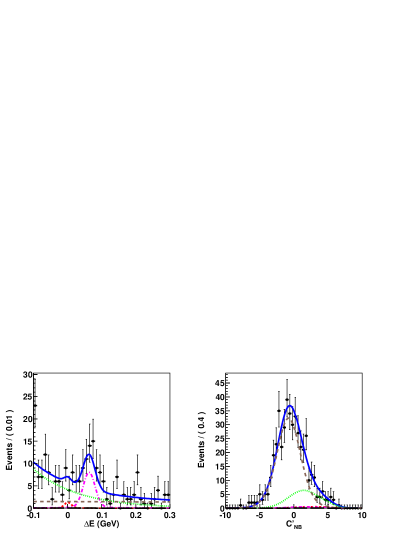
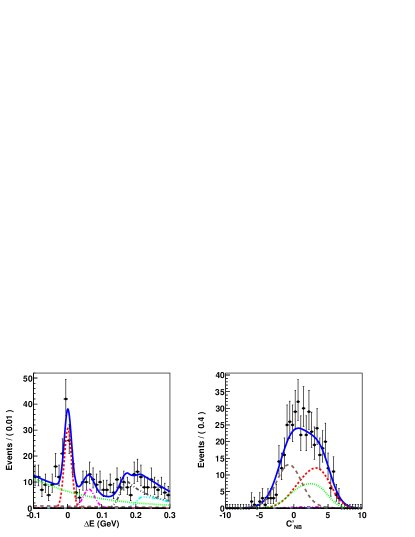
The results of the fits for suppressed and favored modes are shown in Fig. 2 and presented in Table 1.
Figure 2: The projections of the fits to data for the suppressed mode (upper) and the favored mode (lower):
the projection for (left) and the projection for (right).
The fitted data samples are shown by the dots with error bars and the total PDFs are shown by the solid blue curve.
Individual components are shown by
the dashed red ( signal),
the dash-dotted magenta (),
the short dashed green (combinatorial background),
the long dashed brown ( background),
the very long dashed black (peaking backgrounds),
the dash-dot-dotted gray (),
and the dash-dot-dot-dotted aqua ().
We obtain the ratio to be
where is the signal yield for the suppressed (favored) mode, is the detection efficiency obtained from a MC study for the suppressed (favored) mode.
We list the sources of systematic uncertainties in Table 2.
The uncertainties of the PDF shape parameters are estimated by varying the determined parameters of the PDFs by .
The uncertainties due to the PDFs for , combinatorial , , and are estimated by replacing their PDFs with the signal PDF.
The uncertainty due to the PDF shape for is the largest systematic uncertainty.
The uncertainty due to the yields of the peaking background is conservatively estimated by applying 0 and 2 times the nominal expected yields.
The systematic uncertainty associated with the peaking background is small because of its small expected yield.
The uncertainty due to the yields of and is estimated by taking into account the uncertainty of the efficiencies and the branching fractions.
We check the fit bias by generating 10,000 pseudo-experiments for each of the suppressed and favored modes.
We obtain an almost standard Gaussian distribution for the pull,
and take the product of the mean of the pull and the error of the nominal fit.
MC statistics and the uncertainties in the efficiencies of particle identification dominate the systematic uncertainty in detection efficiency.
The uncertainties in the efficiencies of particle identifications are determined from the decay
followed by .
The uncertainty due to the charmless decay is obtained from the upper limit of its branching ratio PDG
and the efficiency estimated by assuming a non-resonant distribution in phase space.
The uncertainties due to the favored mode are estimated in a similar manner as for the suppressed mode and are found to be small.
The distribution of the likelihood is obtained by convolving the likelihood in the () two-dimensional fit and an asymmetric Gaussian whose widths are the negative and positive systematic errors.
We set a 95% confidence level (C.L.) upper limit for to be .
We obtain an upper limit of , corresponding to 95% C.L. limit of ,
by conservatively assuming that is much larger than so that .
The uncertainties due to the signal yield of the favored mode are found to be negligible.
Table 1: Summary of the results.
The errors for and are statistical only.
Mode
(%)
()
Table 2: Summary of the systematic uncertainties for .
Source
Uncertainty []
Signal PDFs
PDFs
Combinatorial PDFs
Peaking background PDFs
PDFs
PDFs
PDFs
Fit bias
Efficiency
Charmless decay
Total
In summary, we report a result of the measurement of the ratio , using a 711 data sample collected by the Belle detector.
We obtain , which can be used to extract by combining with other observables related to the same dynamical parameters , and .
Since the value of is not significant,
we set an upper limit of (95% C.L.); this is the most stringent limit to date.
Possible reasons for the small are destructive interference between the two decays,
destructive interference between and other states,
or a small ratio of magnitudes of amplitudes for over .
We thank the KEKB group for excellent operation of the
accelerator; the KEK cryogenics group for efficient solenoid
operations; and the KEK computer group, the NII, and
PNNL/EMSL for valuable computing and SINET4 network support.
We acknowledge support from MEXT, JSPS and Nagoya’s TLPRC (Japan);
ARC and DIISR (Australia); NSFC (China); MSMT (Czechia);
DST (India); INFN (Italy); MEST, NRF, GSDC of KISTI, and WCU (Korea);
MNiSW (Poland); MES and RFAAE (Russia); ARRS (Slovenia);
SNSF (Switzerland); NSC and MOE (Taiwan); and DOE and NSF (USA).
References
(1)N. Cabibbo, Phys. Rev. Lett. 10, 531 (1963);
M. Kobayashi and T. Maskawa, Prog. Theor. Phys. 49, 652 (1973).
(2)The other unitarity-triangle angles
are defined as and .
(3)L. Wolfenstein, Phys. Rev. Lett. 51, 1945 (1983).
(4)K. Abe et al. (Belle Collab.), Phys. Rev. Lett. 90, 131803 (2003).
(5)T. Aaltonen et al. (CDF Collab.), Phys. Rev. D 81, 031105 (2010).
(6)A. Poluektov et al. (Belle Collab.), Phys. Rev. D 81, 112002 (2010).
(7)P. del Amo Sanchez et al. (BaBar Collab.), Phys. Rev. D 82, 072004 (2010).
(8)P. del Amo Sanchez et al. (BaBar Collab.), Phys. Rev. D 82, 072006 (2010).
(9)P. del Amo Sanchez et al. (BaBar Collab.), Phys. Rev. Lett. 105, 121801 (2010).
(10)T. Aaltonen et al. (CDF Collab.), Phys. Rev. D 84, 091504 (2011).
(11)Y. Horii et al. (Belle Collab.), Phys. Rev. Lett. 106, 231803 (2011).
(12)R. Aaij et al. (LHCb Collab.), arXiv:1203.3662 (2012).
(13)The charge-conjugate modes are implicitly included unless otherwise stated.
(14)D. Atwood, I. Dunietz, and A. Soni, Phys. Rev. Lett. 78, 3257 (1997);
Phys. Rev. D 63, 036005 (2001).
(15)M. Gronau, Phys. Lett. B 557, 198 (2003).
(16)HFAG, online update for Charm at http://www.slac.stanford.edu/xorg/hfag/charm.
(17)B. Aubert et al. (BaBar Collab.), Phys. Rev. D 79, 072003(2009).
(18)S. Kurokawa and E. Kikutani, Nucl. Instr. and. Meth. A 499, 1 (2003),
and other papers included in this volume.
(19)A. Abashian et al. (Belle Collab.),
Nucl. Instr. and Meth. A 479, 117 (2002).
(20)The Fox-Wolfram moments were introduced in
G. C. Fox and S. Wolfram, Phys. Rev. Lett. 41, 1581 (1978).
The Fisher discriminant used by Belle, based on modified Fox-Wolfram moments (SFW), is described in
K. Abe et al. (Belle Collab.), Phys. Rev. Lett. 87, 101801 (2001) and
K. Abe et al. (Belle Collab.), Phys. Lett. B 511, 151 (2001).
(21)H. Kakuno et al., Nucl. Instr. and Meth. A 533, 516 (2004).
(22)M. Feindt and U. Kerzel, Nucl. Instr. and Meth. A 559, 190 (2006).
(23)K. Nakamura et al. (Particle Data Group), J. Phys. G 37, 075021 (2010) and 2011 partial update for the 2012 edition at http://pdg.lbl.gov.