Enhanced magnetic anisotropy of Nickel nanosheet prepared in Na-4 mica
Abstract
Nanosheets of nickel with thickness equal to 0.6 nm have been grown within the interlayer spaces of Na-4 mica. The sheets are made up of percolative clusters of nanodisks. Magnetization characteristics indicate a superparamagnetic behavior with a blocking temperature of 428 K.The magnetic anisotropy constant as extracted from the coercivity data has been found to be higher than that of bulk nickel by two orders of magnitude. This is ascribed to a large aspect ratio of the nickel nanophase. The Bloch exponent is also found to be considerably different from that of bulk nickel because of a size effect. The Bloch Equation is still found to be valid for the two dimensional structures.
I Introduction
The magnetic properties of two dimensional nanostructures with large aspect ratio have received considerable attention in recent yearsepjb1 . Two-dimensional systems display magnetic properties distinct from those of bulk materials, and it remains a challenge to understand their behavior hornbook . The magnetic properties of nanoparticles depend strongly on the particle size and shape and the results are interesting not only from the point of view of basic physics but also of technological applications such as ferrofluids, magnetic refrigaration etc. jms1 ; pss1 ; jms2 ; poppjmmm ; rajjmmm . Though the synthesis of two dimensional transition metal having fcc structure has been rarely explored, two dimensional single crystalline nickel has been grown recently by a solution phase method lengnt ; lengjpcc . These nanosheets are triangular and hexagonal in shape having a thickness of 6 nm and edge length of 15.4 nm.
We had previously synthesized two dimensional silver bosejncs ,manganese mitrajpcc and compounds like danjmc and GaN santanujpd ; santanuapl by a template assisted method. In order to synthesize them, sodium fluorophlogopite, commonly known as Na-4 mica, was used as the template. Na-4 mica is a layered material. The interlayer spaces have been exploited to grow two dimensional nickel. The thickness of such regions was estimated from the interplanar spacings of the concerned planes as calculated from the X-ray diffraction pattern of the material kodamajmc1 . From the latter the basal plane (001) spacing of the hydrated Na-4 mica was found to be 1.21nm. Subtracting the interplanar spacing of (002) planes viz; 0.61nm kodamajmc1 from the above we obtained 0.6nm, which we take as a measure of the interlayer thickness for hydrated Na-4 mica. These spaces have unusually large number of four cations per unit cell, loosely bound with the upper and lower block oxygen ions via weak electrostatic interactions. The cations can be exchanged with suitable ions. After proper treatment the formation of desired materials within the nanodimensional space can be achieved. Due to this small thickness, much higher aspect ratio can be induced in the system than that reported till date. We had recently used Na-4 mica to grow nickel nanosheets. The study was restricted to delineating the magnetodielectric effect in the system selfepl which was found to be substantial. In this present investigation we have explored the magnetic anisotropy behaviour of two dimensional metallic nickel of thickness 0.6 nm synthesized within the nanochannels of Na-4 mica.
II Experiment
II.1 Synthesis
Synthesis of Na-4 mica has been described elsewhere mitrajpcc ; danjmc ; pkmprb . The Na-4 mica powder was kept inside a saturated solution of nickel nitrate (as obtained from E.Merck (India) Ltd.) in water for two and a half months, at 333K in an air oven, for the ion exchange reaction, to occur. The pH of the solution was kept at 7.0. The concentration of ions in the solution was . The mixture was stirred at regular interval. Alongside the ion exchange process, the nanospaces were filled with cations and anions. A longer duration and slightly higher temperature than that required for ion-exchange process [8] were used because we wanted to ensure the introduction of and ions as well within the nanospace. The powder was then dried and washed thoroughly with deionized water several times, so that no molecule remained on the surface of the powdered sample. Finally, the sample was subjected to a reduction treatment. The ion exchanged powder, in an alumina boat, was brought to 1273 K in nitrogen atmosphere inside a tubular furnace and then it was subjected to Hydrogen gas flow for 1 h. Hydrogen reduced the ions in the nanospaces to form metallic nickel. The sample was brought back to room temperature by furnace cooling in nitrogen atmosphere. The temperature and time of reduction had to be determined by a trial and error method. The conversion to metallic nickel was possible only under this optimum condition.
II.2 Characterization
The phases present in the composites synthesized were identified by X-ray diffraction studies on them. A Bruker D8 XRD SWAX diffractometer
was used with Cu radiation. The diffraction angle was varied from to . For microstructural studies
an etching technique was used for separating the nickel nanosheets from Na-4 mica - the etchant being a 40% HF aqueous solution.
The nickel phase was retrieved from the solution by centrifuging the latter in a SORVALL RC 90 ultracentrifuge at
40,000 rpm for 30 minutes. After washing the sample in water several times for the removal of HF it was dispersed in acetone(AR Grade, E-Merck, India).
A JEOL 2010 transmission electron microscope operated at 200 kV was used to study the microstrure of the sample.
Magnetic properties were investigated by a Superconducting Quantum Interference Device (SQUID) magnetometer (Quantum Design MPMS XL)
in the temperature range 2 to 300 K with an applied field up to 30 kOe.
III Results and Discussion
III.1 Structure Analysis
The X-ray diffractogram obtained from Na-4 mica powder synthesized in this work is shown in figure 1. The d-spacings calculated from the diffraction angles pertaining to different peaks match well with those reported in the literature parkcm ; leejmc . Figure 2(a) shows the X-ray diffraction pattern of the composite comprising Na-4 mica and nickel. The characteristic diffraction peaks for both the phases with their corresponding lattice planes are marked on the figure. It may be noted that the XRD reflection (002) is strongly widened. This is explained as arising due to the partial pillaring of the mica structure during the growth of nickel phase at high temperature. Figures 2(b),2(c),2(d) show amplified views of the diffraction peaks corresponding to (111), (200), (220) planes of nickel phase respectively. The data in the figure were fitted by a Gaussian function as indicated by the solid line, which was then employed to calculate the Full Width Half Maxima (FWHM) values. The latter are summarized in table 1. It is evident that the values are different from each other showing thereby the anisotropic features of the grown nickel phase.

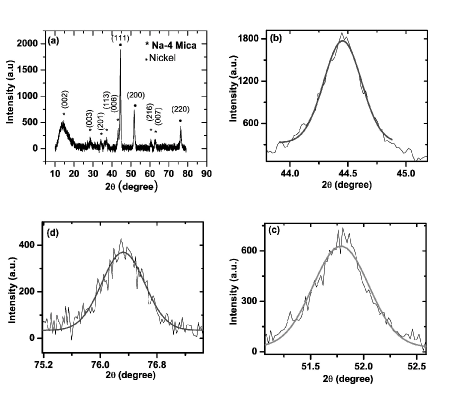
| Plane | FWHM (in degree) |
|---|---|
| (111) | 0.38 |
| (200) | 0.62 |
| (220) | 0.71 |
We have also tried to delineate the thickness of the nickel nanosheet by dispersing the extracted nickel entities (see section 2.2) on a freshly cleaved mica (SPI Supplies, West Chester, PA, USA) surface mounted on measuring platform of an Atomic Force Microscope (AFM) (Vecco Model,CP- II). The changes in AFM stylus position as it is drawn over the samples whose images are given in 3(a) . The green line in the z-color scale is the base line, denoting the substrate (mica) surface from which the heights were measured. The big, bright particles are unreacted flakes of Na-4 mica. It is to be noted that the steps in the line profiles arose due to the low resolution of the imaging, and definitely not real. The thickness of a single sheet of nickel was found to be 0.6 nm. However, we have also obtained areas of thickness 1.2 nm and 1.8 nm, because due to this method of sample preparation one may obtain a situation where few nickel nanosheets juxtaposed on top of each other. In table 2 we have given a quantitative analysis of the occurence of the various thicknesses as obtained from different line profile plots of figure 3(a). Two such line plots have been shown in the figure 3(b).The line profiles are done on two lines (viz; line1 and line2). The statistical observations have been summarized in figure 4(b). Figure 4(a) shows the 3-dimesional view of figure 3(a). Due to low magnification of the AFM image it has not been possible to determine the nanodisk shape and size. However, from the line profiles by considering the heights of 0.6 nm we measured the base width thereof and could conclude that the nanodisk diameters varied from 10 nm to 30 nm. To substantiate this transmission electron micrograph of nickel nanosheets grown within Na-4 mica has been shown in figure 5(a). It can be seen that the nickel nanosheets have been formed by the percolation of nickel nanodisks of diameter varying from 8 to 26 nm. Figure 5(b) gives the high resolution transmission electron micrograph of one of the nanosheets. The interplanar spacing obtained from the image is 0.20 nm, which is in agreement with the value for the (111) plane in nickel. Since nickel has an fcc crystal structure the formation of (111) plane is thermodynamically favorable, and this has been verified by the high resolution lattice image. The presence of nickel phase is further confirmed by figure 4(c), which shows the selected area electron diffraction pattern. The values are calculated from figure 5(c) and summarized in table 3. These are compared with Joint Committee on Powder Diffraction Standards (JCPDS) data (file no.04-0850) for nickel and Na-4 micaparkcm respectively.
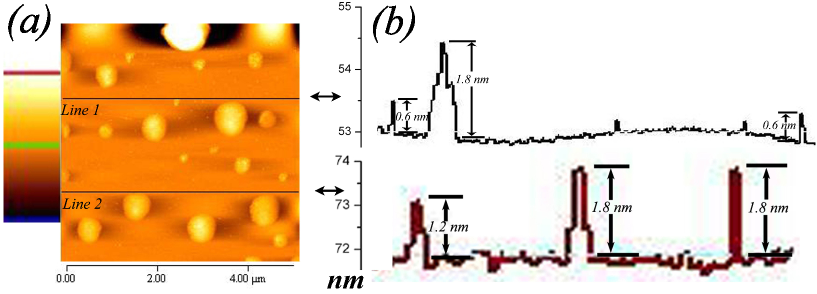
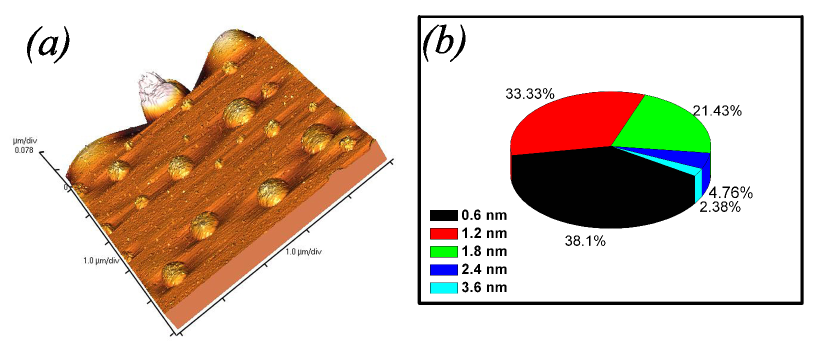
| Thickness measured | No. of times observed |
|---|---|
| (nm) | |
| 0.6 | 16 |
| 1.2 | 14 |
| 1.8 | 09 |
| 2.4 | 02 |
| 3.6 | 01 |

| Observed | Na-4 mica | Nickel |
| (nm) | (nm) | (nm) |
| 0.25 | 0.244 | |
| 0.20 | 0.203 | |
| 0.15 | 0.16 | |
| 0.12 | 0.124 | |
| 0.10 | 0.101 | |
| 0.09 | 0.088 | |
| indicates that there exist | ||
| no planes with these interplanar spacings | ||
| in the phases concerned. |
III.2 Magnetic Properties
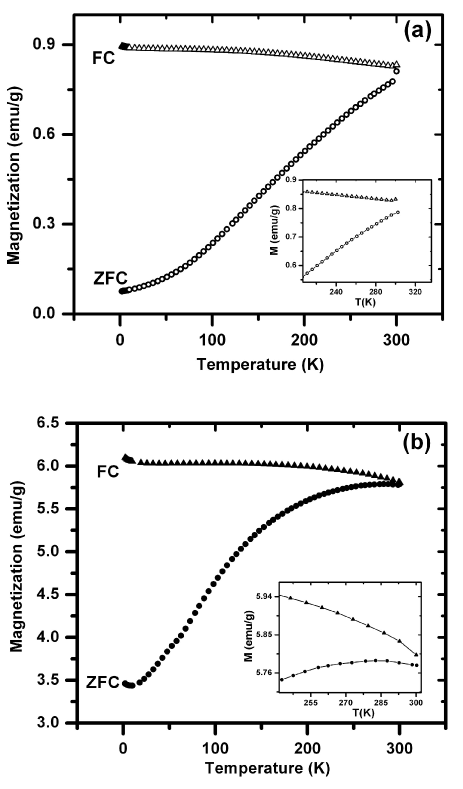
The variation of magnetization as a function of temperature under both field cooled (FC) and zero field cooled (ZFC) conditions and measured at magnetic fields 50 Oe and 500 Oe are shown in figures 6(a) and 6(b) respectively. The magnetization values were normalized in terms of the composite mass of the nanocomposite system. The diamagnetic contribution mitrajpcc from the Na-4 mica powder was duly subtracted from the measured values. The figures in the inset of figure 6(a) and 6(b) show those data in the higher temperature side. From this, it is evident that the ZFC and FC data do not merge with each other at 300 K,indicating that the spins are still blocked even at room temperature. The data indicate superparamagnetic behaviour above a certain temperature. Since at both the applied fields the FC curve deviates from the ZFC curve at the highest temperature measured (300 K), the superparamagnetic blocking temperature of the nanosheets is above 300 K. This high blocking temperature is a signature of their highly anisotropic nature. This is borne out by magnetization-magnetic field hysteresis curve shown in figure 7. In the temperature range of measurement of the M-H isotherm we observe a hysteretic feature which signifies that the material is ferromagnetic at the room temperature. It may be noted here that due to lack of data at temperatures above 300 K it was not possible to determine the exact value of blocking temperature from FC ZFC curves. We have measured the coercivity at different temperatures, from the M-H isotherms, and figure 8 represents the variation of coercivity as a function of temperature. The experimental data were fitted to the relation childressapl
| (1) |
where, is the blocking temperature, and is the coercivity at 0 K. From the least square fitting of the experimental data the extracted value of the blocking temeperature was found to be 428 K. It may be noted that eq.1 pertains to spherical particles. We have fitted our results to this equation and the calculated value of ‘’(see below) refers to the effective anisotropy constant for an equivalent set of spherical particles having the same volume as those of the nanodiscs in the present system. The magnetic anisotropy constant ‘’has been calculated using equation cullitybook
| (2) |


where is Boltzman constant is blocking temperature extracted from curve, and V is the volume of a single particle as measured from TEM image. The anisotropy constant was calculated to be , which is about two orders of magnitude higher than that of bulk nickel, viz; bonderjmmm . This high magnetic anisotropy constant can be attributed to the highly anisotropic shape of the nickel nanosheets. As a matter of fact the room temperaure coercivity is also two orders of magnitude higher than that of bulk nickel, viz;0.7 Oe chemmat1 . It should be pointed out here that the magnetic measurements were carried out on a powdered sample with the nanosheets aligned at random with respect to the magnetic field direction. Hence, the magnetic anisotropy as extracted above can not be assigned to any specific direction but can be described as arising due to an integrated effect of all directions of the sample system. In case of spheres, nanorods, and nanowires the measured coercivities at 5 K are 200 Oe, 630 Oe, and 730 Oe respectively jmmm310 .The value of 415 Oe obtained in our system seems consistent with these because our samples are two dimensional in nanoscale. In figure 9 the variation of saturation magnetization as a function of temperature has been shown. For achieving saturation magnetization from the M-H isotherms, we have plotted [M-(1/H)] and was obtained by the extrapolation of the data to . It is observed that the magnetization increases as the temperature is lowered due to a decrease in thermal energywumrb . It is to be noted, that the saturation magnetization obtained in our studies is around 12 emu/g. This is much lower than that observed in pure fcc nickel at 300 K hwangjmr . This difference is caused by the fact that our measurements were carried out on the composite powder in which Ni nanosheets formed a fraction of the material. Na-4 mica occupied the major volume of the sample. As a result the true magnetization can be obtained by dividing the value by a fraction ‘f ’delineating the value of the nickel nanosheets in our composite system. We have fitted the magnetic data with Bloch Equation kodamajmmm ; zhangprb
| (3) |

The values of B and b were found to be and 0.34 respectively. It can be noted that the value of Bloch exponent‘b’is smaller than 1.5. Such a discrepancy has been adduced to an interfacial or a size reduction effect zhangprb . The value of ‘b ’was reported to be lower than 1.5 as the particle size was reduced zhangprb . Our data are consistent with this finding reported earlier. However, the comparison has to be done carefully because our system is two dimensional. As a result, the nature of variation in the value of the Bloch coefficient is opposite to that reported in case of spherical iron nanoparticles. In the present system, both the aspects become operative. There is a large interface between the nickel sheets and the Na-4 mica blocks. Also the sizes of nickel nanodisks have values in the range 8 to 26 nm,with a thickness of 0.6 nm and as a result of reduction in size, the Bloch exponent shows a value smaller than 1.5 . However, Bloch equation is still valid for the two dimensional systems.
IV Conclusion
Nanosheets of nickel with thickness equal to 0.6 nm have been grown within the nanosized interlayer spaces of Na-4 mica. The sheets are made up of percolative clusters of nanodisks. Magnetization characteristics indicate a superparamagnetic behavior with a blocking temperature of 428K. The magnetic anisotropy as extracted from the coercivity data,is found to be higher than that of bulk nickel by two orders of magnitude. This is due to a large aspect ratio of the nickel nanophase. The Bloch exponent also deviates considerably from that of bulk nickel because of a size effect. The enhancement of coercivity in these nanofilms as compared to that in bulk nickel will make the material useful as a memory device.
Acknowledgement
The work was supported by Department of Science and Technology,Govt.of India, New Delhi under an Indo-Australian Project on Nanocomposites. Sreemanta Mitra and Amrita Mandal thank University Grants Commission for Senior Research Fellowships. D.Chakravorty thanks Indian National Science Academy for awarding an Honorary Scientist’s position.
References
- (1) Y. Manzhur, P. Imielski, K. Potzger, W. Brewer, M. Dietrich, M. Prandolini, and H. Bertschat, Eur.Phys.J.B 46, 535 (2005)
- (2) C. Schneider and J. Kirschner, Handbook of Surface Science (Elsevier, Amsterdam, 2000) pp. 511–688
- (3) Q. Liu, H. Huang, L. Lai, J. Sun, T. Shang, Q. Zhou, and Z. Xu, J. Mater. Sci. 44, 1187 (2009)
- (4) P. Gorria, M. Fernández-Garciá, M. Sevilla, J. Blanco, and A. Fuertes, Phys. Stat. Solidi RRL 3, 4 (2009)
- (5) F. Li, Q. Yamng, D. Evans, and X. Duan, J. Mater. Sci. 40, 1917 (2005)
- (6) J. Popplewell and L. Sakhnini, J. Magn. Magn. Mater. 149, 72 (1995)
- (7) K. Raj, B. Moskowitz, and R. Casciari, J. Magn. Magn. Mater. 149, 174 (1995)
- (8) Y. Leng, Y. Wang, X. Li, T. Liu, and S. Takahashhi, Nanotechnology 17, 4834 (2006)
- (9) Y. Leng, Y. Li, X. Li, and S. Takahashhi, J.Phys.Chem.C. 111, 6630 (2006)
- (10) A. Bose, B. Pal, A. Datta, and D. Chakravorty, J.Non-Cryst. Solids 355, 1488 (2009)
- (11) S. Mitra, A. Mandal, A. Datta, S. Banerjee, and D. Chakravorty, J.Phys.Chem.C. 115, 14673 (2011)
- (12) A.Dan, P. Mukherjee, and D. Chakravorty, J.Mater.Chem. 15, 1477 (2005)
- (13) S. Bhattacharya, A. Datta, S. Dhara, and D. Chakravorty, J.Phys.D:Appl.Phys. 42, 235504 (2009)
- (14) S. Bhattacharya, A. Datta, and D. Chakravorty, Appl.Phys.Lett. 96, 093109 (2010)
- (15) T. Kodama and S. Komerneni, J.Mater.Chem. 9, 533 (1999)
- (16) S. Mitra, A. Mandal, A. Datta, S. Banerjee, and D. Chakravorty, Euro.Phys.Lett. 92, 26003 (2010)
- (17) P. Mukherjee, K. Chatterjee, and D. Chakravorty, Phys.Rev.B 73, 035414 (2006)
- (18) M. Park, D. Lee, C.L.Choi, S. Kim, K. Kim, and J. Choi, Chem. Mater. 14, 2582 (2002)
- (19) K. Franklin and E. Lee, J.Mater.Chem. 6, 109 (1996)
- (20) J. Childress, C. Chien, and M. Nathan, Appl.Phys.Lett. 56, 95 (1990)
- (21) B. Cullity and C. Graham, Introduction to Magnetic Materials (Wiley, Massachusetts, 1972)
- (22) M. Bonder, E. Krikpatrick, T. Martin, S. Kim, R. Rieke, and D. Leslie-Pelecky, J. Magn. Magn. Mater. 222, 70 (2000)
- (23) Y. Guo, L.-J. Wan, C. Zhu, D.-L. Yang, D.-M. Chen, and C.-L. Bai, Chem. Mater. 15, 664 (2003)
- (24) S.-L. Oh, Y.-R. Kim, L. Malkinski, A. Vovk, S. Whittenburg, E.-M. Kim, and J.-S. Jung, J. Magn. Magn. Mater. 310, e827 (2007)
- (25) K. Wu, W. Huang, G. Wang, and T. Wu, Mat. Res. Bull 40, 1822 (2005)
- (26) J. Hwang, V. Dravid, M. Teng, J. Host, B. Elliot, D. Johnson, and T. Mason, J. Mater. Res. 12, 1076 (1997)
- (27) R. Kodama, J. Magn. Magn. Mater. 200, 359 (1999)
- (28) D. Zhang, K. Klabunde, C. Sorensen, and G. Hadjipanayis, Phys. Rev. B 58, 14167 (1998)