Dimensional-Crossover-Driven Mott Transition in the Frustrated Hubbard Model
Abstract
We study the Mott transition in a frustrated Hubbard model with next-nearest neighbor hopping at half-filling. The interplay between interaction, dimensionality and geometric frustration closes the one-dimensional Mott gap and gives rise to a metallic phase with Fermi surface pockets. We argue that they emerge as a consequence of remnant one-dimensional Umklapp scattering at the momenta with vanishing interchain hopping matrix elements. In this pseudogap phase, enhanced -wave pairing correlations are driven by antiferromagnetic fluctuations. Within the adopted cluster dynamical mean-field theory on the cluster and down to our lowest temperatures the transition from one to two dimensions is continuous.
pacs:
71.30.+h, 71.10.Pm, 71.10.Fd, 71.27.+aThe relative importance of spatial versus local fluctuations in the understanding of the Mott transition Imada98 can be tuned with dimensionality. Starting from the high dimensional limit, experimental studies on V2O3 indicate that exactly as a usual gas-liquid transition, the three dimensional bandwidth-controlled Mott transition belongs to the conventional Ising universality class: it is a first-order transition below the critical endpoint at K and affects solely the charge sector Lim03 . In contrast, Ising universality class has been ruled out in two-dimensional (2D) organic salts -(BEDT-TTF)2X (BEDT-TTF: bis(ethylenedithio)tetrathiafulvalene, X: monovalent anion) with a much lower critical point K Kag05 ; Kag09 . In this case geometric frustration, inherent to the triangular lattice, strengthens spin fluctuations which in turn affect the nature of the transition. The unconventional character of the quantum criticality in -(BEDT-TTF)2X has been confirmed in recent numerical simulations Sent11 ; Sem11 ; Sato11 . Moreover, enhanced spin fluctuations and spatial correlations in the copper oxide planes offer a natural framework which accounts for a depletion of low-energy states in the pseudogap regime of the high- superconductors Sene04 ; Civ05 ; Macr06 . As for the one-dimensional (1D) regime, it is dominated by spatial fluctuations Giamarchi_book . The relevance of Umklapp scattering for the half-filled band leads to the absence of a bandwidth-controlled Mott transition. However, a Mott transition can be triggered as a function of dimensionality.
The aim of this Letter is to reexamine the dimensional-crossover-driven Mott transition in the quasi-1D Hubbard model at half-filling. The subject combines many fascinating issues such as the breakdown of spin-charge separation and the binding of spinons into magnons Lake10 . These phenomena follow from a delicate interplay between -space and temporal fluctuations. To capture the relevant physics we employ a cluster extension of the dynamical mean-field theory (CDMFT) Geo96 . In the CDMFT, a cluster of impurities is subject to a dynamical effective bath simulating the effect of all the other sites of the lattice Kot01 . The ability of the CDMFT to reproduce the density-driven Mott transition in the 1D Hubbard model has been demonstrated in Refs. Bol03 ; Cap04 . Previous CDMFT studies of the dimensional-crossover-driven Mott transition in weakly-coupled 1D chains yielded ordinary open Fermi surface (FS) in the Hubbard model Bier01 and small FS pockets in the model of spinless fermions Bert06 .
We study the Hubbard model on a strongly anisotropic square lattice at half-filling,
| (1) |
where the electron hopping is () on the intrachain (interchain) bonds, is the chemical potential and we set . In addition, we allow for a finite diagonal next-nearest neighbor hopping (see Fig. 1). It brings about frustration in the ground state and by reducing nesting properties of the FS precludes long-range magnetic order in the and weak-coupling regime Tsu07 ; Mou11 . Hence, finite value of guarantees the Mott transition in the thermodynamic limit. We use the Hirsch-Fye Quantum Monte Carlo (QMC) algorithm as a cluster-impurity solver and extend previous studies Bier01 to a low temperature regime. However, computational cost prevented us from decreasing the temperature below on the cluster sign . The CDMFT allows one to compute the single-particle spectral function . Here is the lattice Green’s function represented in the original Brillouin zone. We estimate the latter by periodizing the cluster Green’s function and applying stochastic analytical continuation of the QMC data Beach04a .
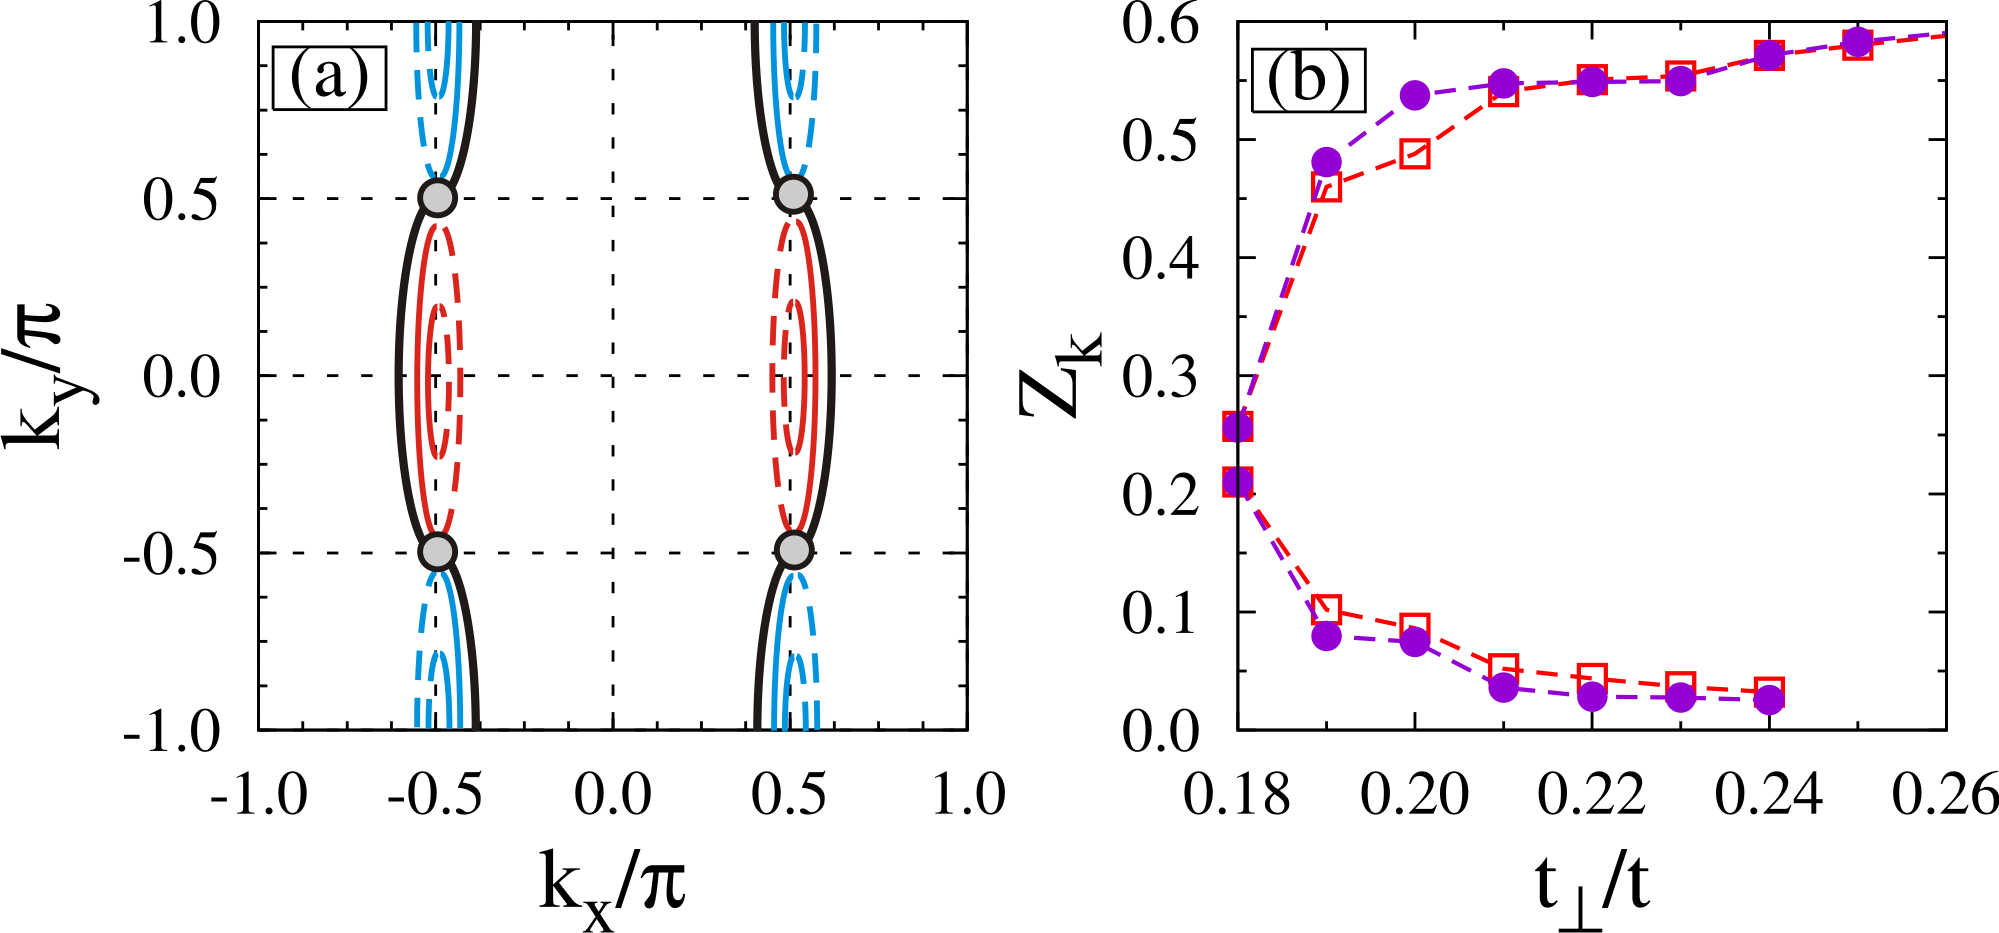
Our main results are summarized in Figs. 1 and 2. The control parameter interpolates between one and two dimensions and triggers the Mott transition at . To pin down the nature of the transition, continuous or first order, we plot in Fig. 1(a) with . Down to the considered temperatures, we do not detect a jump and thus conclude that the transition is continuous. in Fig. 1(a) corresponds to an interchain charge susceptibility which is greatly enhanced in the vicinity of the critical coupling . The open warped Fermi lines which form at sufficiently large (see Fig. 2) essentially follow from the topology of the tight-binding model. In the intermediate region, , we find a metallic phase where the FS is broken into electron and hole pockets. On the one hand, starting from the 1D Mott insulating state, the occurrence of the pockets might be understood by taking the interchain hopping into account at the random-phase approximation (RPA) level Ess02 . In this context the nodal points play a special role since there. On the other hand, starting from the large limit, scattering off and/or magnetic fluctuations could equally gap out the hot spots, . To provide support for this scenario, we plot in Fig. 1(b) the cluster spin susceptibility for both momenta. As apparent, 1D fluctuations remain robust up to but are then gradually suppressed, giving way to dominant fluctuations, which peak at the Mott transition. Let us however note that in the static mean-field limit, antiferromagnetic order is not sufficient to reproduce the observed FS topology pointing towards the remnant 1D Umklapp scattering at the nodal momenta as the origin of the pockets.
Enhanced staggered magnetic fluctuations give rise to pairing with a -wave character with the upper (lower) sign corresponding to (), respectively. The response of the system in the particle-particle channel is best seen in the pairing interaction vertex White89 . It is obtained from the full pairing susceptibility by subtracting the uncorrelated contribution. As shown in Fig. 1(b), the calculated pairing vertex is enhanced at the Mott transition which confirms the magnetic-pairing scenario.
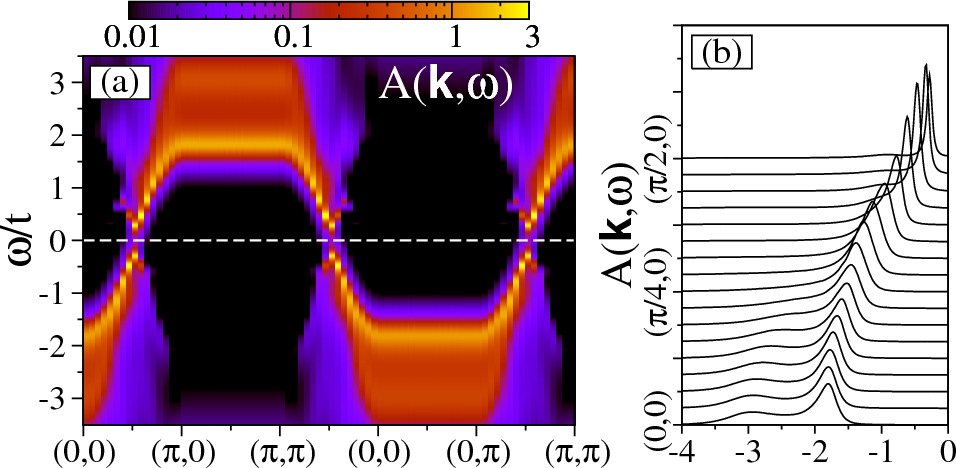
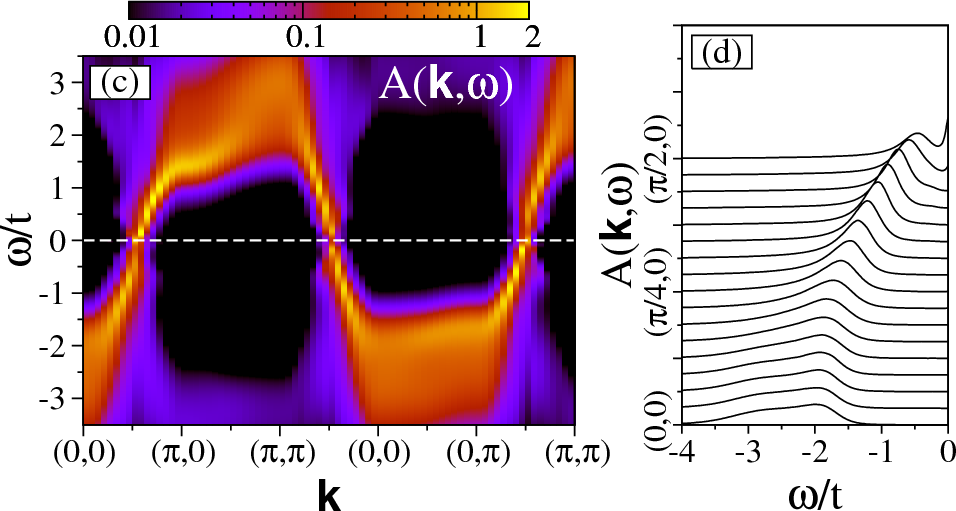
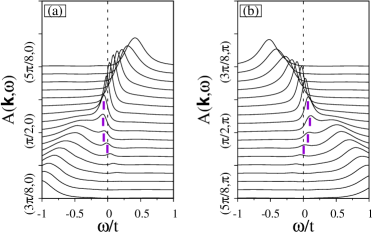
The schematic evolution of the FS surface shown in Fig. 2(a) stems from the calculation of the single-particle Green’s function. In Fig. 3 we show the dimensional-crossover-driven Mott transition as seen in the evolution of the single-particle spectral function . Most noteworthy features in the 1D limit shown in Fig. 3(a,b) are: (i) a well defined single-particle gap at and equivalent points; (ii) signatures of spinon and holon branches especially in the vicinity of Mat05 , and (iii) backfolding of the energy bands around and the equivalent points. Concerning (ii), already when the intensity of the spinon excitation is noticeably reduced but nevertheless one can distinguish two peaks epaps1 . As shown in Fig. 3(c,d), they are superseded by a single peak with a broad shoulder at the Mott transition. Finally, a broad quasiparticle (QP) peak is resolved at epaps1 . This remnant aspect of the 1D physics is captured in approaches starting from a fractionalized spectral function in the 1D limit and treating the interchain hopping at the RPA level Ess02 ; Rib11 . As for (iii), the pocket emerges when one of the backfolded bands intersects the Fermi energy. This defines a main and ghost side of the pocket which we can characterize with the magnitude of the QP residue . We extract this quantity by fitting the data to the Lorentzian form and plot it in Fig. 2(b). At the exception of Mott transition at where the pockets shrink and become very thin, strong anisotropy along the pockets is evident. We illustrate this in Fig. 4 by showing the low-frequency part of across the pockets at . The two features — one with a large and the second one with a small QP weight crossing the Fermi level are part of the electron [Fig. 4(a)] and hole [Fig. 4(b)] pocket. The broken FS is unrelated to a specific ladder geometry of the cluster and it is also found on the square cluster epaps2 .
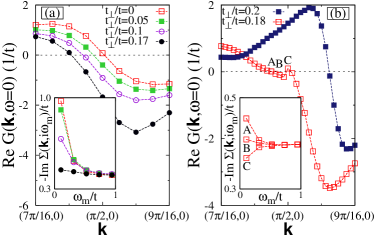
The reconstruction of the FS is governed by the topology of the real part of the zero-frequency Green’s function Stan06 ; Sak09 ; Gros12 . In the Fermi liquid theory, is positive (negative) inside (outside) the FS, respectively, and changes sign by going through a pole. This contrasts with the Mott insulator in which changes sign in momentum space passing through a zero as a result of a diverging lattice self-energy . We extract the latter from the Dyson’s equation , where is the bare Green’s function, in combination with the spectral representation of the lattice Green’s function . The diverging behavior of at momentum in the Mott phase is shown in Fig. 5(a). It is the coexistence of infinities and zeros which accounts for the anisotropy of the emergent pockets. We focus on the electron pocket and illustrate this in Fig. 5(b) for . On the one hand, in close vicinity of the -point with a vanishing , two adjacent poles of result in a very thin electron pocket. On the other hand, diverging yields a zero of at the -point. The latter reduces the QP weight of the nearby ghost side. The interference of the neighboring pole and zero becomes stronger with growing and prevented us from resolving the full structure of already at . Indeed, at our lowest temperature only a pole associated with the main side of the pocket and a broad minimum in is observed in Fig. 5(b). However, as depicted in Fig. 4(a) the ghost side remains visible in the spectral function. In analogy with the density-driven Mott transition in the 2D Hubbard model Stan06 ; Sak09 , we believe that the emergence of a large FS above corresponds to a simultaneous annihilation of the adjacent zero and pole leaving the pole carrying a larger QP weight.
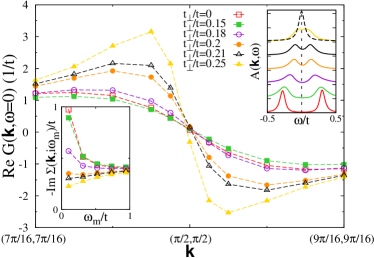
We turn now to the nodal direction of the Brillouin zone. Figure 6 reveals that remains almost unchanged with respect to the 1D regime up to the -selective Mott transition at . This agrees with: (i) the behavior of at which we expect to diverge in the limit up to , and (ii) the gap seen in . On further increasing , develops a pole-like feature. As a result, a broad QP peak emerges at . Its weight is much smaller than that at along the direction included for comparison in Fig. 6. The substantial variation in the scattering rate is a precursory indication of the broken FS at smaller .
Let us expand briefly on a relationship of our results with real materials such as quasi-1D organic (TM)2X salts where TM stands for TMTTF (tetramethyltetrathiafulvalene) or its selena TMTSF analog Giamarchi04 . Their unified phase diagram bears similarities to that of the high- cuprates in the sense that as a function of pressure a superconducting phase emerges in the proximity of the insulating Mott phase. The inclusion of a finite in our studies mimics the unnesting role of pressure. As we show, crossing over from the 1D system to a higher-dimensional regime involves recombination of spinons and holons into the conventional QPs and releases the charge from the confinement to the 1D chains. The pressure-induced change in the optical spectroscopy data on (TMTTF)2X is interpreted as an example of such a charge deconfinement Ves98 ; Pas10 . A quantitative comparison would involve studies within a model Hamiltonian extended by electron-phonon coupling and long-range Coulomb interaction to account for a wide variety of phase transitions observed in the (TM)2X families. Nevertheless, we find encouraging that our CDMFT studies within the bare Hubbard model Eq. (1) support accumulating experimental evidence that superconductivity in the (TMTSF)2X salts is mainly mediated by magnetic fluctuations Jer12 . Finally, the signatures of the closed FS contours that we find could be verified in the quantum oscillation experiments.
In summary, our CDMFT simulations yield a continuous quantum phase transition between a 1D Mott insulating state and a 2D metallic state. On the metallic side the coherence temperature below which QPs form marks the crossover scale and vanishes at the critical point. At energy scales below the coherence temperature and in the close vicinity of the transition point, the FS topology shows hole and electron pockets. We attribute their origin to the remnant 1D Umklapp scattering at the nodal momenta. Such a mechanism can also account for the pockets observed in the spinless model Bert06 . The evolution of the pockets with can be understood by tracking the zero and poles of the single-particle Green’s function. At energy scales above the coherence temperature, remnant features of spin-charge separation are apparent in the single-particle spectral function. At the two-particle level, the metallic state is characterized by enhanced antiferromagnetic fluctuations in the very close vicinity of the critical point. These magnetic fluctuations act as a glue for paring correlations with a -wave character. On the insulating side, the crossover scale is set by the Mott gap. Below this energy scale we observe robust 1D Mott physics: aspects of spin-charge separation are visible both in the spectral function and magnetic fluctuations which remain intact. Further work aimed at investigating the finite temperature consequences of this quantum critical point is presently under progress.
Acknowledgements.
We acknowledge support from the DFG grant AS120/8-1 (Forschergruppe FOR 1346) and thank the LRZ-Münich and the Jülich Supercomputing center for a generous allocation of CPU time.References
- (1) M. Imada, A. Fujimori, and Y. Tokura, Rev. Mod. Phys. 70, 1039 (1998).
- (2) P. Limelette, A. Georges, D. Jérome, P. Wzietek, P. Metcalf, and J. M. Honig, Science 302, 89 (2003).
- (3) F. Kagawa, K. Miyagawa, and K. Kanoda, Nature 436, 534 (2005).
- (4) F. Kagawa, K. Miyagawa, and K. Kanoda, Nat. Phys. 5, 880 (2009).
- (5) M. Sentef, P. Werner, E. Gull, and A. P. Kampf, Phys. Rev. B 84, 165133 (2011).
- (6) P. Sémon and A.-M. S. Tremblay, Phys. Rev. B 85, 201101 (2012).
- (7) T. Sato, K. Hattori, and H. Tsunetsugu, e-print arXiv:1111.5371 (2011).
- (8) D. Sénéchal and A.-M. S. Tremblay, Phys. Rev. Lett. 92, 126401 (2004).
- (9) M. Civelli, M. Capone, S. S. Kancharla, O. Parcollet, and G. Kotliar, Phys. Rev. Lett. 95, 106402 (2005).
- (10) A. Macridin, M. Jarrell, T. Maier, P. R. C. Kent, and E. D’Azevedo, Phys. Rev. Lett. 97, 036401 (2006).
- (11) T. Giamarchi, Quantum Physics in One Dimension (Oxford Univ. Press, Oxford, 2004).
- (12) B. Lake, A. M. Tsvelik, S. Notbohm, D. A. Tennant, T. G. Perring, M. Reehuis, C. Sekar, G. Krabbes, and B. Büchner, Nat. Phys. 6, 50 (2010).
- (13) A. Georges, G. Kotliar, W. Krauth, and M. J. Rozenberg, Rev. Mod. Phys. 68, 13 (1996).
- (14) G. Kotliar, S. Y. Savrasov, G. Pálsson, and G. Biroli, Phys. Rev. Lett. 87, 186401 (2001).
- (15) C. J. Bolech, S. S. Kancharla, and G. Kotliar, Phys. Rev. B 67, 075110 (2003).
- (16) M. Capone, M. Civelli, S. S. Kancharla, C. Castellani, and G. Kotliar, Phys. Rev. B 69, 195105 (2004).
- (17) S. Biermann, A. Georges, A. Lichtenstein, and T. Giamarchi, Phys. Rev. Lett. 87, 276405 (2001).
- (18) C. Berthod, T. Giamarchi, S. Biermann, and A. Georges, Phys. Rev. Lett. 97, 136401 (2006).
- (19) M. Tsuchiizu, Y. Suzumura, and C. Bourbonnais, Phys. Rev. Lett. 99, 126404 (2007).
- (20) S. Moukouri and E. Eidelstein, Phys. Rev. B 84, 193103 (2011).
- (21) The limiting factor comes from the scaling of the QMC solver while for the considered parameters and cluster sizes the QMC sign problem remains very mild.
- (22) K. S. D. Beach, e-print arXiv:cond-mat/0403055 (2004).
- (23) F. H. L. Essler and A. M. Tsvelik, Phys. Rev. B 65, 115117 (2002).
- (24) S. R. White, D. J. Scalapino, R. L. Sugar, N. E. Bickers, and R. T. Scalettar, Phys. Rev. B 39, 839 (1989).
- (25) H. Matsueda, N. Bulut, T. Tohyama, and S. Maekawa, Phys. Rev. B 72, 075136 (2005).
- (26) See Supplemental Material for the spectral function on the cluster at and .
- (27) P. Ribeiro, P. D. Sacramento, and K. Penc, Phys. Rev. B 84, 045112 (2011).
- (28) See Supplemental Material for the evidence of the FS pockets on the cluster.
- (29) T. D. Stanescu and G. Kotliar, Phys. Rev. B 74, 125110 (2006).
- (30) S. Sakai, Y. Motome, and M. Imada, Phys. Rev. Lett. 102, 056404 (2009).
- (31) L. F. Tocchio, F. Becca, and C. Gros, Phys. Rev. B 86, 035102 (2012).
- (32) T. Giamarchi, Chem. Rev. 104, 5037 (2004).
- (33) V. Vescoli, L. Degiorgi, W. Henderson, G. Grüner, K. Starkey, and L. K. Montgomery, Science 281, 1181 (1998).
- (34) A. Pashkin, M. Dressel, M. Hanfland, and C. A. Kuntscher, Phys. Rev. B 81, 125109 (2010).
- (35) D. Jérome, J. Supercond. Nov. Magn. 25, 633 (2012).
Supplementary data to the article: Dimensional-Crossover-Driven Mott Transition in the Frustrated Hubbard Model
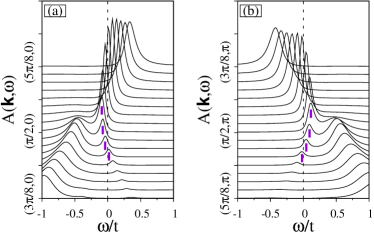
Figure 7 shows the single-particle spectral function on the cluster for and and it complements Fig. 3 in our Letter.
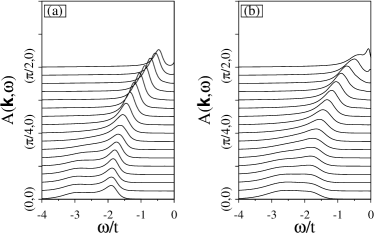
Auxiliary CDMFT simulations performed on the cluster indicate that the broken FS is unrelated to a specific ladder geometry of the cluster (c.f. Fig. 8) Hence, FS pockets appear to be a generic low-energy feature accompanying the Mott transition in the quasi-1D limit.