Structure and Diffusion of Nanoparticle Monolayers Floating at Liquid/Vapor Interfaces: A Molecular Dynamics Study
Abstract
Large-scale molecular dynamics simulations are used to simulate a layer of nanoparticles diffusing on the surface of a liquid. Both a low viscosity liquid, represented by Lennard-Jones monomers, and a high viscosity liquid, represented by linear homopolymers, are studied. The organization and diffusion of the nanoparticles are analyzed as the nanoparticle density and the contact angle between the nanoparticles and liquid are varied. When the interaction between the nanoparticles and liquid is reduced the contact angle increases and the nanoparticles ride higher on the liquid surface, which enables them to diffuse faster. In this case the short range order is also reduced as seen in the pair correlation function. For the polymeric liquids, the out-of-layer fluctuation is suppressed and the short range order is slightly enhanced. However, the diffusion becomes much slower and the mean square displacement even shows sub-linear time dependence at large times. The relation between diffusion coefficient and viscosity is found to deviate from that in bulk diffusion. Results are compared to simulations of the identical nanoparticles in 2-dimensions.
I. INTRODUCTION
Nanoparticles at a liquid/vapor or liquid/liquid interface have attracted extensive attention during the past two decades.Bresme and Oettel (2007) One motivation is that nanoparticles adsorbed at interfaces are found to be able to stabilize emulsions and foams.Binks and Lumsdon (2000); Binks and Clint (2002); Horozov and Binks (2006) Nanoparticles also self-assemble into various structures at an interface, which provides an efficient route to produce superlattices of nanoparticles of technological importance.Lin et al. (2003); Binder (2005); Böker et al. (2007) The advantage of this technique is that the assembly process can be fast and the resulting arrays are usually highly ordered. Due to their small size the adsorption energy of nanoparticles at an interface is typically only a few , where is the Boltzmann constant and is the temperature.Lin et al. (2003); Bresme and Oettel (2007); Du et al. (2010) The small adsorption energy implies that the adsorbed nanoparticles are highly dynamic and the self-assembly is quite reversible, the latter of which has been found to be crucial to form highly ordered arrays.Whitesides and Grzybowski (2002); Binder (2005). Nanoparticles straddling an interface can also be regarded as living in a quasi 2-dimensional (2D) environment, which provides a model system to study interesting problems such as phase transitions of 2D fluids.Pieranski (1980); Terao and Nakayama (1999); Zahn and Maret (2000); Sun and Stirner (2003)
Many experimental studies have been devoted to investigate the factors controlling the behavior of nanoparticles at an interface, including their size, surface morphology, shape, materials polarizability, and coatings.Heath et al. (1997); Glaser et al. (2006); Isa et al. (2011); Zang et al. (2011); Comeau and Meli (2012) Some of these factors influence the location and orientation of individual nanoparticles; others influence their mutual interactions and assembly geometry. However, in experiments these factors are usually intertwined to yield collective effects and it is difficult to single out the effect of each factor alone. This aspect is where molecular dynamics (MD) simulations can play a useful role by studying the effect of one factor at a time to help elucidate experimental observations and uncover new physical insights.Bresme and Quirke (1998); Fenwick et al. (2001); Powell et al. (2002); Bresme et al. (2009); Chiu et al. (2009); Cheung (2010, 2011); Fan et al. (2011); Frost and Dai (2011) For example, Bresme et al. showed that Young’s equation can be used to describe force balance at nanoscale interfaces, but in certain cases line tension should also be included.Bresme and Quirke (1998) Fenwick and Powell et al. showed that contrary to expectations, the collapse pressure measured in a typical Langmuir trough experiment should be independent of the contact angle.Fenwick et al. (2001); Powell et al. (2002) Recently, Cheung showed the importance of nanoparticle-liquid interactions and capillary waves in determining the stability of nanoparticles at liquid interfaces.Cheung (2011)
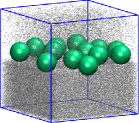
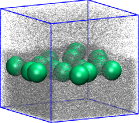
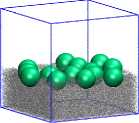
Although MD simulations to date have revealed many important aspects of the physical behavior of nanoparticles at an interface, some aspects are still unclear. Particularly, it is not clear how the structure and dynamics depend on contact angle and nanoparticle density in the low coverage regime. These behaviors are important since low density clusters can occur at the earlier stage of assembly and affect the morphology of the final dense layer.Bigioni et al. (2006) The effect of liquid viscosity on interfacial diffusion is also not well understood and has only been studied recently.Cheung (2010); Wang et al. (2011) In this paper we use MD to study the structure and dynamics of a layer of nanoparticles floating at a liquid/vapor interface. We focus on the effect of varying the contact angle, which is controlled by interactions between the nanoparticles and liquid, the nanoparticle density, and the liquid viscosity, respectively. Snapshots of some of the systems we have simulated are shown in Fig. 1 (only a part of the full simulation box is shown in each case). In Fig. 1(a) the contact angle between the nanoparticle and liquid is . In this case the nanoparticles only slightly dip into the liquid which is composed of Lennard-Jones (LJ) monomers and is in equilibrium with its vapor phase. In Fig. 1(b) and the nanoparticles are almost immersed in the liquid. In Fig. 1(c) and the nanoparticles straddle the surface of the liquid, in this case composed of flexible linear polymer chains. Note that the LJ monomer liquid has a high vapor density, but the vapor density of the polymeric liquid is essentially .Cheng et al. (2011) Also note that the polymeric liquid has a higher bulk density than that of the monatomic liquid and the liquid film in Fig. 1(c) is thinner than those in Fig. 1(a) and (b) since in our simulations all liquids contain a similar number of monomers.
II. SIMULATION METHODOLOGY
We placed a layer of nanoparticles at a liquid/vapor interface as shown in Fig. 1. Three liquid systems consisting of either LJ monomers or flexible linear chains of LJ beads for and were studied. In all three cases, the beads interact with each other through the standard LJ 12-6 potential
| (1) |
where is the distance between two beads, is the unit of energy, and is the diameter of beads. The interaction is truncated at . For the two polymeric liquids, beads in the chain are connected by an additional finite extensible nonlinear elastic potential with a spring constant and maximum extent .Kremer and Grest (1990) The liquid density and shear viscosity for the LJ monomer liquid is and ,Petersen et al. (2010) while for the polymer liquids, and for , and and for .not (a); Tuckerman et al. (1997)
The nanoparticles are assumed to consist of a uniform distribution of atoms interacting with a LJ potential. For spherical particles, their mutual interaction can then be determined analytically by integrating over all the interacting LJ atom pairs between the two particles.Hamaker (1937); Everaers and Ejtehadi (2003) For nanoparticles with radii , the interaction energy is given by
| (2) |
Here is the center-to-center distance between two nanoparticles. The Hamaker constant , where is the interaction strength between the LJ atoms that make up the nanoparticles, and is the diameter and the density of LJ atoms in the nanoparticles. To reduce the number of parameters, we take , and , in which case . In this paper we set .
The interaction between the LJ beads and nanoparticles is determined by integrating the interaction between a LJ bead and the LJ atoms within a nanoparticle, and the interaction potential is given by
| (3) |
where is the center-to-center distance between the bead and nanoparticle, and the Hamaker constant for and .
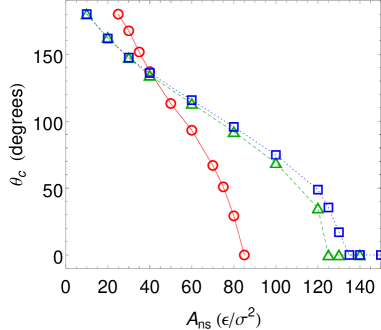
Depending on the values of the Hamaker constant and , the nanoparticles can either be dispersed in the liquid or phase separate. As we are interested in studying nanoparticles that are hard-sphere like at the liquid/vapor surface, we truncate the nanoparticle-nanoparticle interaction so that it is purely repulsive. For , this gives a cutoff for . Physically this corresponds to adding a short surfactant coating to the nanoparticles to avoid flocculation.in’t Veld et al. (2009); Grest et al. (2011) For the interaction between the nanoparticles and LJ beads making up the liquid and vapor, we set . The remaining free parameter controls the solubility of the nanoparticles in the liquid. We choose such that nanoparticles phase separate to the liquid/vapor interface, in which case controls the contact angle of the nanoparticles on the liquid surface. Results for as a function of are shown in Fig. 2. The data show that as . However, when exceeds certain critical value, which is approximately for LJ monomers and () for 10-bead (100-bead) chains, goes to and the nanoparticles diffuse into the liquid. In the intermediate range around , decreases roughly linearly as increases. For a fixed , increases as the chain length increases. This trend can be qualitatively understood as the result of less entropy gain when mixing the nanoparticles with longer chains. Correspondingly, a larger , which represents the enthalpy contribution of solvation, is required to disperse the nanoparticles into a liquid of longer chains.not (b) The effects of and chain length on the behavior of the nanoparticles at the liquid/vapor interface are visualized in Fig. 1.
All MD simulations were performed using the LAMMPS simulation package.Plimpton (1995); lam The simulation cell is a rectangular box of dimensions , where , , and for the LJ monomer liquid and for the polymeric liquids. The liquid/vapor interface is parallel to the - plane, in which periodic boundary conditions were employed. In the direction, the LJ atoms and nanoparticles are confined by two flat walls at and , respectively. Since the 2D packing of hard spheres is very sensitive to the aspect ratio of the enclosing box, we set so that the hexagonal close-packing is favored. Each system contains more than million LJ atoms to form a liquid layer with a thickness and in equilibrium with its vapor phase, which in the LJ monomer case has a thickness for . For the polymeric liquids, the vapor density is and was reduced accordingly. In order to investigate the effect of nanoparticle coverage, three systems were simulated with , , and nanoparticles, corresponding to 2D density , , and , respectively. All these densities are well below the critical density at the liquid/hexatic transition and at the hexatic/solid transition of 2D hard disk fluids.Alder and Wainwright (1962); Binder et al. (2002); Mak (2006)
The LJ atoms interact with both upper and lower walls through a LJ 9-3 potential, which depends only on their distance from the wall,
| (4) |
where . For the lower wall the interaction is truncated at , while at the upper wall is purely repulsive with . Though all nanoparticles are confined to the liquid/vapor interface and far from the two walls in most simulations, we also included a nanoparticle-wall potential of the form
| (5) |
where is the distance of the center of a nanoparticle from the wall and . At both walls the potential is truncated at to make it purely repulsive for the nanoparticles. This potential is useful for larger values of where the nanoparticles are dispersed in the liquid.Grest et al. (2011)
The equations of motion were integrated using a velocity-Verlet algorithm with a time step , where and is the mass of a LJ monomer. The nanoparticle with a radius has a mass . During the equilibration, the temperature was held at by a Langevin thermostat weakly coupled to all LJ atoms with a damping constant . Once the liquid/vapor interface was equilibrated, the Langevin thermostat was removed except for those liquid atoms within of the lower wall at . Since the thickness of the liquid layer is and all nanoparticles are floating at the liquid/vapor interface in our simulations, their motion is not affected by the thermostat.
For comparison, we also conducted MD simulations of 5000 nanoparticles in a 2D box with . The size of the 2D box was varied to ensure the same density as for the nanoparticles at liquid/vapor interfaces. A Langevin thermostat with a damping constant was used to keep the temperature at . The thermostat works as an implicit solvent. The interaction between the nanoparticles is still given by Eq. (2) since capillary interactions are negligible for nanoparticles because of the irrelevance of gravity.Kralchevsky et al. (1994) We confirmed this treatment in our simulations by directly calculating and visualizing the liquid/vapor interface, which is flat (except for temporary capillary fluctuations) all the way to the contact line on the nanoparticle surface and shows no distortion at all with the presence of nanoparticles. It should be pointed out that for larger particles, capillary interactions can be taken into account even in 2D simulations by adding an effective capillary attraction between particles.Bleibel et al. (2011)
III. RESULTS AND DISCUSSION
A. Out-of-Plane Fluctuations
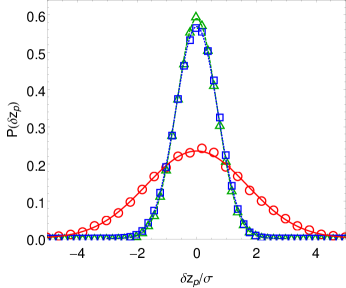
At a finite contact angle , the nanoparticles straddle the liquid/vapor interface and form a layer that is essentially 2D, with small thermal fluctuations in the -direction normal to the interface. Direct calculation of the magnitude of fluctuations shows that it is almost independent of and the nanoparticle density , but strongly depends on the properties of the supporting liquid film, including its density, viscosity, and surface tension. Because of thermal fluctuations, the layer thickness is broadened and the individual nanoparticle height deviates from the mean value of all nanoparticles. Such deviations are apparent in snapshots shown in Fig. 1. More quantitative results are shown in Fig. 3, where the probability density distribution is calculated as a function of the deviation from the instantaneous mean height of all nanoparticles. Note that the mean height itself fluctuates with time, but such fluctuations are excluded in Fig. 3. Including them would make the distributions even wider. The distributions in Fig. 3 all have a Gaussian shape, with a variance for the monatomic LJ liquid, and for the two polymeric liquids. Since the nanoparticle diameter is , the height variations amongst the nanoparticles are less than of their diameter, which confirms that the nanoparticle layer is close to a 2D system.
B. In-Plane Structure
To characterize the structure in the plane of the nanoparticle layer, we computed the 2D radial distribution function and the structure factor , where is a 2D wave-vector and and are unit vectors along and directions, respectively. While and are related through a Fourier transform, for a finite system it is easier to calculate each one directly. The calculation of involves counting the number of pairs of nanoparticles separated by distance and is straightforward. The structure factor is given by
| (6) |
where the sum is taken over all nanoparticle pairs indexed by and and separated by .
Results of are shown in Fig. 4. Data in Fig. 4(a) are for different ’s at . These results show the expected increase in the height of the first peak in as increases. The effect of on is illustrated in Fig. 4(b)-(d). All results consistently show that when is reduced, the locations of the peaks of move to larger , which indicates that the nanoparticle layer is slightly denser at larger . This trend is consistent with experimental results on the silica nanoparticle layer at the water-air interface.Zang et al. (2011) It can be understood from a simple physical picture. At large , the nanoparticles ride high at the liquid/vapor interface and the separation between nanoparticles is solely controlled by the hard core repulsion. However, at small , the nanoparticles are partially coated by the liquid, which increases their effective size. So as decreases the mean separation between two nanoparticles increases.
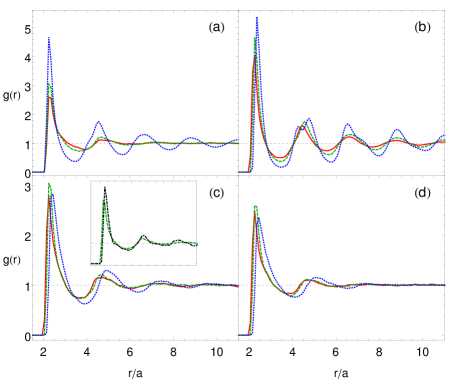
Figure 4(b) shows that at the peaks of grow as decreases, indicating that the nanoparticle layer becomes more ordered at smaller . The data in Fig. 4(c) and (d) for and also show this trend. However, the first peak of becomes lower when is further reduced to , though other peaks become higher. The apparent reduction in the first peak of at is due to a finite size effect. The calculation of indicates that all peaks grow as decreases and confirms that the nanoparticle layer exhibits stronger local order at smaller .
As continues to decrease to , we have observed the loss of nanoparticles at the interface as some of them diffuse into the liquid, though for an individual nanoparticle may still be finite. This effect is more significant at higher nanoparticle density. For example, at more than nanoparticles were dispersed in the liquid at the end of MD runs for ; while for , about have diffused into the liquid. The loss of nanoparticles at the interface for a finite is a consequence of their small activation energy, which is typically at the order of several .Bresme and Oettel (2007)
Result of for the polymeric liquid consisting of 100-bead chains is included in the inset of Fig. 4(c), together with the result for the monatomic LJ liquid at the same and . The peaks of are slightly higher for the polymeric liquid than those for the monatomic LJ liquid, indicating that local order is slightly stronger in the former case. As shown in Fig. 3, the out-of-layer fluctuation is much smaller for the polymeric liquids, i.e., the nanoparticle layer is more 2D-like. As a consequence, the nanoparticle density is effectively higher, which leads to higher peaks in for the polymeric liquids.
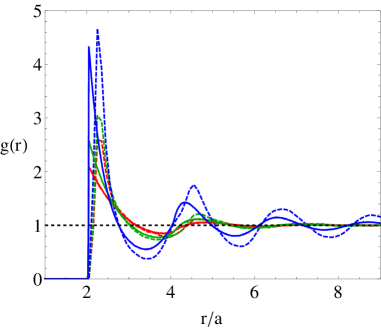
A comparison of for nanoparticles at the liquid/vapor interface and in 2D with an implicit solvent is shown in Fig. 5 for three densities. The peaks in for nanoparticles at the interface are clearly higher and decay slower than those for nanoparticles in 2D, indicating stronger local order in the former case. The locations of the peaks move towards larger for nanoparticles at the interface. The shift is between to , and reflects the liquid coating that is about in thickness on each nanoparticle. The coating makes the nanoparticles effectively larger than the bare ones in 2D simulations. Therefore, the actual nanoparticle density is effectively higher at the interface, which leads to higher peaks in . However, if the radius of nanoparticles in 2D was increased to reflect this coating, then we would expect higher peaks in at a given from 2D simulations. This trend can be derived indirectly from the previous comparison of between the monatomic LJ liquid and polymeric liquids. Higher peaks are found for the latter since the nanoparticle layer there is more 2D-like.
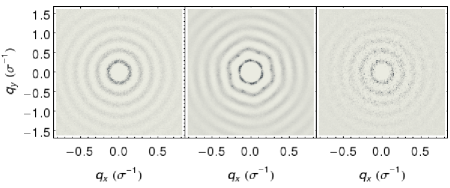
Additional information on the in-plane structure of the nanoparticle layer can be obtained from . A density plot of in the - plane is shown in Fig. 6 for and the monatomic LJ liquid at and , and the 100-bead chain polymeric liquid at . At low density and , the local structure is almost isotropic, indicating a fluid-like state of the floating layer. However, at , which is still lower than the critical density for the fluid/solid transition of 2D hard sphere systems, the hexagonal close-packing feature of the local structure is rather apparent as shown in the middle panel of Fig. 6. Smaller out-of-plane fluctuations of nanoparticles on the surface of the polymeric liquid lead to stronger local order in the nanoparticle layer at a given and , indicated by higher peaks in .
C. Orientational Order
A simple measure of orientational order of the floating nanoparticle layer is provided by the fraction of nanoparticles, , which have exactly six neighbors as in a close-packed hexagonal lattice. Here a simple criterion is adopted to identify nearest neighbors as those within a cut-off radius of a given nanoparticle. We chose , roughly corresponding to the location of the first valley of as shown in Fig. 4. After nearest neighbors were found, we computed the Nelson-Halperin (N-H) order parameter, which can be expressed as
| (7) |
where the first sum is over all nanoparticles, is the number of nearest neighbors of the -th nanoparticle, the second sum is over nearest neighbors, and is the angle formed by the bond between a nearest neighbor pair and a fixed axis. For an ideal hexagonal lattice , and it decreases to zero as the local bond disorder increases.
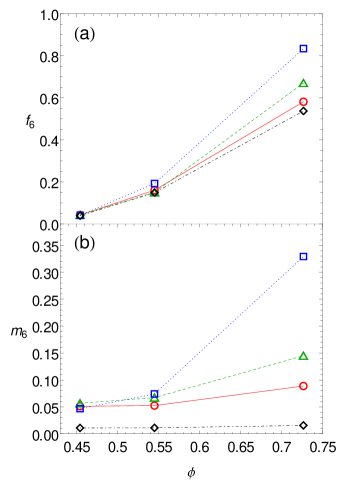
Results of and vs. are shown in Fig. 7 for nanoparticles floating on the surface of the monatomic LJ liquid at various contact angles. Results of 2D simulations are also included. As expected, in all cases and increase with , indicating the development of orientational order. Figure 7 also shows that at a given , the layer is more locally ordered at smaller as indicated by larger values of and . The increase in orientational order as is reduced is more dramatic at higher . This trend persists in our simulations when is reduced even further (e.g., ). In this case since some nanoparticles are eventually absorbed into the liquid at long times, we can only calculate and in the early stages of simulations when all nanoparticles are still at the liquid/vapor interface. In this early time regime systems follow the same trend that at a given , values of and are larger and the order is stronger at smaller . The trend is consistent with that found from as shown in Fig. 4. Data in Fig. 7 also show that orientational order is stronger for nanoparticles at the interface than for those in 2D since the liquid coating in the former case makes nanoparticles effectively larger and their density higher. The same reason also leads to enhancement of translational order as shown in Fig. 5.
The N-H order parameter shown in Fig. 7 was calculated with nearest neighbors identified with a simple cut-off criterion. To verify that this criterion leads to an accurate estimate of orientational order, we also conducted a Voronoi analysis of the packing geometry of the nanoparticle layer.Steinhardt et al. (1983) Nearest neighbors were identified as those sharing common sides in the Voronoi construction. The N-H order parameter was then computed with Eq. (7). Results from the Voronoi analysis typically agree within a few percent with those from the simpler cut-off approach. Thus the cut-off criterion is adequate for finding nearest neighbors needed for the calculation of the N-H order parameter, even when the nanoparticle density is low.
D. Diffusion Coefficient
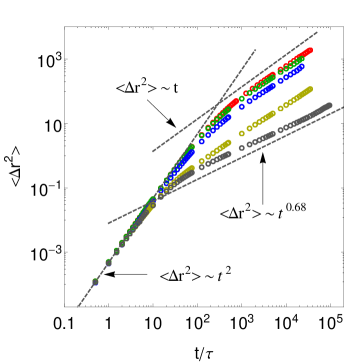
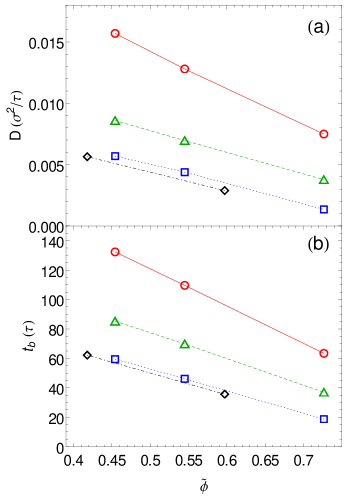
The in-plane motion of nanoparticles at the liquid/vapor interface is characterized by the mean square displacement , which is shown in Fig. 8 for various cases. At very short times, the motion of nanoparticles is nearly ballistic with , where is a velocity and is time. At larger times, the motion becomes diffusive and , where is a diffusion coefficient and 4 is the prefactor for 2D diffusion. Most of our results fit to this classical picture, as shown in Fig. 8. In all cases, and is nearly independent of and . The intersection of the ballistic and diffusive regime defines a ballistic time scale . Results for and are shown in Fig. 9 as a function of the true nanoparticle density for 4 values of . At small (e.g., ), because of the loss of nanoparticle from the interface, is lower than the nominal density calculated from . In other cases . Figure 9 shows that in all cases, and decrease approximately linearly with the nanoparticle density and the slope is steeper for larger . At the same , both and decrease as decreases. This is due to the fact that the attraction between the nanoparticles and liquid is enhanced to make smaller. As a consequence, nanoparticles become more immersed into the liquid and need to plow through more liquid in order to move, which makes their diffusion more difficult. At , and decrease by a factor of when is reduced from to . At , the reduction is almost -fold for the same change in .
For the 10-bead chain polymeric liquid, grows linearly with at early times and shows diffusive behavior at large times. However the diffusion coefficient is reduced significantly compared to the LJ monomer case. For example, at and , the value of is for the 10-bead polymeric liquid compared to for the monatomic LJ liquid. Note that Fig.2 shows that the interaction strength between the nanoparticles and liquid, dictated by , has to be adjusted to ensure the same for the polymeric and monatomic LJ liquid. For example, for the monatomic LJ liquid at , while we need to increase to to get the same for the 10-bead polymeric liquid. If is held fixed at for the 10-bead polymeric liquid, then increases to . In this case is . These data are summarized in Table 1. If we compare the values of between the monatomic LJ and 10-bead polymeric liquid at , i.e., at the same nanoparticle-bead interaction, we find that is reduced by a factor about . Note that the viscosity of the 10-bead polymeric liquid is approximately times larger than that of the monatomic LJ liquid. If we assume a scaling relation between and as , then is much less than 1, which is in contrast with the situation of free bulk Brownian diffusion where is expected. However, our results are consistent with a recent experimental measurement of the diffusion coefficient of single nanoparticles at water-oil interfaces, where was found.Wang et al. (2011)
| liquid | () | (∘) | () | () |
|---|---|---|---|---|
| monatomic | 60 | 93 | 1.01 | |
| 10-bead | 60 | 113 | 12 | |
| 10-bead | 79 | 93 | 12 |
For the 100-bead chains, at early times, and then crosses over to a sub-diffusive regime as shown in Fig. 8. This deviation from the expected long-time linear dependence on time continued out to the longest times we are presently able to simulate. In this sub-diffusive regime, the mean square displacement for the 100-bead chains can be better fit to , as shown in Fig. 8. The reason underlying this sub-diffusive regime is unclear.
V. CONCLUSIONS
In this paper we studied nanoparticles floating at liquid/vapor interfaces with MD simulations. Both the low-viscous monatomic LJ liquid and the high-viscous polymeric liquids composed of flexible linear chains were studied. We showed that as the attraction between the nanoparticles and liquid is increased, the contact angle is reduced and the nanoparticles are more wetted by the liquid. At the same time the short range order of the nanoparticle layer is slightly enhanced and the interfacial diffusion coefficient of the nanoparticles is greatly reduced. Our results further showed that both the translational and orientational order of the nanoparticle layer grow quickly and the nanoparticle diffusion slows down dramatically as the nanoparticle density is increased. Comparisons with results of 2D simulations revealed that the main effect of liquid on the nanoparticles is to provide a coating which makes their effective size larger than that of the bare ones. Otherwise, the nanoparticle layer at the liquid/vapor interface is close to a 2D system, though the out-of-plane fluctuations can be as large as of their diameter. The simulations with more viscous polymeric liquids showed that the the out-of-plane fluctuations of the nanoparticles are strongly suppressed even for relatively short chains (e.g., 10-bead chains). The local, short range order is slightly enhanced at a given contact angle and nanoparticle density as the chain length increases. At the same time, the nanoparticle diffusion becomes slower for more viscous liquids and even shows sub-diffusive behavior at large times for highly viscous liquids. The diffusion coefficient scales inversely with the viscosity however with an exponent less than 1.
ACKNOWLEDGMENTS
This research used resources of the National Energy Research Scientific Computing Center (NERSC), which is supported by the Office of Science of the United States Department of Energy under Contract No. DE-AC02-05CH11231, and the Oak Ridge Leadership Computing Facility located in the National Center for Computational Sciences at Oak Ridge National Laboratory, which is supported by the Office of Science of the United States Department of Energy under Contract No. DE-AC05-00OR22725. These resources were obtained through the Advanced Scientific Computing Research (ASCR) Leadership Computing Challenge (ALCC). This work was supported by the Laboratory Directed Research and Development program at Sandia National Laboratories. Sandia National Laboratories is a multi-program laboratory managed and operated by Sandia Corporation, a wholly owned subsidiary of Lockheed Martin Corporation, for the U.S. Department of Energy’s National Nuclear Security Administration under contract DE-AC04-94AL85000.
References
- Bresme and Oettel (2007) F. Bresme and M. Oettel, J. Phys.: Condens. Matter 19, 413101 (2007).
- Binks and Lumsdon (2000) B. P. Binks and S. O. Lumsdon, Langmuir 16, 8622 (2000).
- Binks and Clint (2002) B. P. Binks and J. H. Clint, Langmuir 18, 1270 (2002).
- Horozov and Binks (2006) T. S. Horozov and B. P. Binks, Angew. Chem. Int. Ed. 45, 773 (2006).
- Lin et al. (2003) Y. Lin, H. Skaff, T. Emrick, A. D. Dinsmore, and T. P. Russell, Science 299, 226 (2003).
- Binder (2005) W. H. Binder, Angew. Chem. Int. Ed. 44, 5172 (2005).
- Böker et al. (2007) A. Böker, J. He, T. Emrick, and T. P. Russell, Soft Matter 3, 1231 (2007).
- Du et al. (2010) K. Du, E. Glogowski, T. Emrick, T. P. Russell, and A. D. Dinsmore, Langmuir 26, 12518 (2010).
- Whitesides and Grzybowski (2002) G. M. Whitesides and B. Grzybowski, Science 295, 2418 (2002).
- Pieranski (1980) P. Pieranski, Phys. Rev. Lett. 45, 569 (1980).
- Terao and Nakayama (1999) T. Terao and T. Nakayama, Phys. Rev. E 60, 7157 (1999).
- Zahn and Maret (2000) K. Zahn and G. Maret, Phys. Rev. Lett. 85, 3656 (2000).
- Sun and Stirner (2003) J. Sun and T. Stirner, Phys. Rev. E 67, 051107 (2003).
- Heath et al. (1997) J. R. Heath, C. M. Knobler, and D. V. Leff, J. Phys. Chem. B 101, 189 (1997).
- Glaser et al. (2006) N. Glaser, D. J. Adams, A. Böker, and G. Krausch, Langmuir 22, 5227 (2006).
- Isa et al. (2011) L. Isa, F. Lucas, R. Wepf, and E. Reimhult, Nature Comm. 2, 438 (2011).
- Zang et al. (2011) D. Y. Zang, E. Rio, G. Delon, D. Langevin, B. Wei, and B. P. Binks, Mol. Phys. 109, 1057 (2011).
- Comeau and Meli (2012) K. D. Comeau and M. V. Meli, J. Chem. Phys. 28, 377 (2012).
- Bresme and Quirke (1998) F. Bresme and N. Quirke, Phys. Rev. Lett. 80, 3791 (1998).
- Fenwick et al. (2001) N. I. D. Fenwick, F. Bresme, and N. Quirke, J. Chem. Phys. 114, 7274 (2001).
- Powell et al. (2002) C. Powell, N. Fenwick, F. Bresme, and N. Quirke, Colloids Surfaces A 206, 241 (2002).
- Bresme et al. (2009) F. Bresme, H. Lehle, and M. Oettel, J. Chem. Phys. 130, 214711 (2009).
- Chiu et al. (2009) C. Chiu, B. M. P, W. Shinoda, and S. O. Nielsen, J. Chem. Phys. 131, 244706 (2009).
- Cheung (2010) D. L. Cheung, Chem. Phys. Lett. 495, 55 (2010).
- Cheung (2011) D. L. Cheung, J. Chem. Phys. 135, 054704 (2011).
- Fan et al. (2011) H. Fan, D. E. Resasco, and A. Striolo, Langmuir 27, 5264 (2011).
- Frost and Dai (2011) D. S. Frost and L. L. Dai, Langmuir 27, 11339 (2011).
- Bigioni et al. (2006) T. P. Bigioni, X.-M. Lin, T. T. Nguyen, E. I. Corwin, T. A. Witten, and H. M. Jaeger, Nature Mater. 5, 265 (2006).
- Wang et al. (2011) D. Wang, S. Yordanov, H. M. Paroor, A. Mukhopadhyay, C. Y. Li, H.-J. Butt, and K. Koynov, Small 7, 3502 (2011).
- Cheng et al. (2011) S. Cheng, J. B. Lechman, S. J. Plimpton, and G. S. Grest, J. Chem. Phys. 134, 224704 (2011).
- Kremer and Grest (1990) K. Kremer and G. S. Grest, J. Chem. Phys. 92, 5057 (1990).
- Petersen et al. (2010) M. K. Petersen, J. B. Lechman, S. J. Plimpton, G. S. Grest, P. J. in’t Veld, and P. R. Schunk, J. Chem. Phys. 132, 174106 (2010).
- not (a) As results for the shear viscosity for and 100 were not known for , we equilibrated systems of 25000 chains of length and 2500 chains of length at zero pressure and then sheared at a given shear rate. Non-equilibrium trajectories were generated by integrating the SLLOD equations of motion.Tuckerman et al. (1997) The shear viscosity was calculated for several shear rates and extrapolated to zero shear rate. We found and for and , respectively.
- Tuckerman et al. (1997) M. E. Tuckerman, C. J. Mundy, S. Balasubramanian, and M. L. Klein, J. Chem. Phys. 106, 5615 (1997).
- Hamaker (1937) H. C. Hamaker, Physica (Amsterdam) 4, 1058 (1937).
- Everaers and Ejtehadi (2003) R. Everaers and M. R. Ejtehadi, Phys. Rev. E 67, 041710 (2003).
- in’t Veld et al. (2009) P. J. in’t Veld, M. K. Petersen, and G. S. Grest, Phys. Rev. E 79, 021401 (2009).
- Grest et al. (2011) G. S. Grest, Q. Wang, P. J. in’t Veld, and D. J. Keffer, J. Chem. Phys. 134, 144902 (2011).
- not (b) Calculating as a function of provides a convenient way to determine the phase diagram of a nanoparticle/liquid mixture. Studies along this line will be presented in a future publication.
- Plimpton (1995) S. J. Plimpton, J. Comp. Phys. 117, 1 (1995).
- (41) http://lammps.sandia.gov/.
- Alder and Wainwright (1962) B. J. Alder and T. E. Wainwright, Phys. Rev. 127, 359 (1962).
- Binder et al. (2002) K. Binder, S. Sengupta, and P. Nielaba, J. Phys.: Condens. Matter 14, 2323 (2002).
- Mak (2006) C. H. Mak, Phys. Rev. E 73, 065104 (2006).
- Kralchevsky et al. (1994) P. A. Kralchevsky, N. D. Denkov, V. N. Paunov, O. D. Velev, I. B. Ivanov, H. Yoshimura, and K. Nagayma, J. Phys.: Condens. Matter 6, A395 (1994).
- Bleibel et al. (2011) J. Bleibel, A. Dominguez, M. Oettel, and S. Dietrich, Eur. Phys. J. E 34, 125 (2011).
- Steinhardt et al. (1983) P. J. Steinhardt, D. R. Nelson, and M. Ronchetti, Phys. Rev. B 28, 784 (1983).