Chemical segregation toward massive hot cores: The AFGL2591 star forming region
Abstract
We present high angular resolution observations (0.50.3) carried out with the Submillimeter Array (SMA) toward the AFGL2591 high-mass star forming region. Our SMA images reveal a clear chemical segregation within the AFGL2591 VLA 3 hot core, where different molecular species (Type I, II and III) appear distributed in three concentric shells. This is the first time that such a chemical segregation is ever reported at linear scales 3000 AU within a hot core. While Type I species (H2S and 13CS) peak at the AFGL2591 VLA 3 protostar, Type II molecules (HC3N, OCS, SO and SO2) show a double-peaked structure circumventing the continuum peak. Type III species, represented by CH3OH, form a ring-like structure surrounding the continuum emission. The excitation temperatures of SO2, HC3N and CH3OH (18511 K, 15020 K and 12412 K, respectively) show a temperature gradient within the AFGL2591 VLA 3 envelope, consistent with previous observations and modeling of the source. By combining the H2S, SO2 and CH3OH images, representative of the three concentric shells, we find that the global kinematics of the molecular gas follow Keplerian-like rotation around a 40 M⊙-star. The chemical segregation observed toward AFGL2591 VLA 3 is explained by the combination of molecular UV photo-dissociation and a high-temperature (1000 K) gas-phase chemistry within the low extinction innermost region in the AFGL2591 VLA 3 hot core.
Subject headings:
stars: formation — ISM: individual objects (AFGL2591) — ISM: molecules1. Introduction
Hot cores are hot (200 K), compact (0.1 pc) and dense (106 cm-3) condensations, which represent one of the earliest stages of massive star formation (e.g. Garay & Lizano, 1999). These objects are chemically very rich, and show large enhancements of S-bearing species such as H2S, OCS or SO2, and of complex organic molecules (COMs) such as H2CO, CH3OH or CH3CN (Blake et al., 1987; Comito et al., 2005; Hatchell et al., 1998b). These enhancements are attributed to the thermal evaporation of the mantles of dust grains, followed by rapid ion-neutral gas-phase reactions (Charnley et al., 1992; Charnley, 1997; Hatchell et al., 1998a; Viti et al., 2004; Wakelam et al., 2004).
Toward hot cores, the warming up of the gas in the envelope by the central protostar, generates a temperature gradient as a function of radius that largely affects the chemical composition of the grain mantles and of the molecular gas within these cores. As a consequence, a chemical segregation is expected to occur (van Dishoeck & Blake, 1998; Nomura & Millar, 2004). Indirect evidence of this molecular segregation has been found in the form of abundance discontinuities for COMs toward hot cores (van der Tak et al., 1999, 2000b), as well as toward low-mass warm cores (or hot corinos; see Ceccarelli et al., 2000; Maret et al., 2004; Awad et al., 2010). However, direct imaging of the chemical segregation at the inner regions of hot molecular cores, still remains to be reported.
The AFGL2591 high-mass star forming region is located in the Cygnus X complex at a distance of 3 kpc. This distance, which was substantially underestimated in the past, has been derived recently by using trigonometric parallax of the 22.2 GHz H2O masers detected toward this region (Rygl et al., 2012). The revised mass of the large-scale AFGL2591 clump is 2104 M⊙, and the measured total IR luminosity is 2105 L⊙ (Sanna et al., 2012). AFGL2591 hosts a cluster of young stellar objects (YSOs) over scales of 0.1 pc (Campbell, 1984; Trinidad et al., 2003; van der Tak & Menten, 2005), where several radio continuum sources are detected (see VLA 1, VLA 2 and VLA 3 in Trinidad et al., 2003). Sanna et al. (2012) has recently reported the detection of another YSO (the NE source) at 0.4 (1300 AU) north the AFGL2591 VLA 3 object.
From all the YSOs detected in the AFGL2591 star forming region, AFGL2591 VLA 3 is believed to be the youngest (dynamical age of 2104 yr; Doty et al., 2002; Stäuber et al., 2005) and most massive source in the cluster (estimated mass of 38 M⊙; Sanna et al., 2012). AFGL2591 VLA 3 is very bright in the mid-IR (de Wit et al., 2009), and is responsible for most of the IR luminosity measured toward this region (Sanna et al., 2012). AFGL2591 VLA 3 is also known to power a large-scale east-west outflow detected in CO and near-IR emission (P.A.280∘; Mitchell et al., 1992; Preibisch et al., 2003), whose axis lies close to the direction of the line-of-sight (Hasegawa & Mitchell, 1995; van der Tak et al., 1999). The blue-shifted lobe of the outflow is detected toward the west of AFGL2591 VLA 3, while the red-shifted outflowing gas is found toward the east (Mitchell et al., 1992). The AFGL2591 VLA 3 molecular envelope is seen almost pole-on, and rotates in the counter-clockwise direction (van der Tak et al., 2006). van der Tak et al. (1999) have proposed that the AFGL2591 VLA 3 molecular envelope has two different physical regimes with an inner and hotter core and an outer and cooler envelope. This makes the AFGL2591 VLA 3 hot core an excellent candidate to probe for chemical segregation.
In this paper, we report the first detection of a clear chemical segregation at linear scales 3000 AU within the hot core around the AFGL2591 VLA 3 high-mass protostar. The comparison of the SMA images with gas-grain chemical models shows that the observed chemical segregation is due to i) a strong UV radiation field leading to molecular photo-dissociation; and ii) a high-temperature gas-phase chemistry within the low-extinction innermost region in this core. The paper is organized as follows. The SMA observations are reported in Section 2. The images of the continuum and molecular line emission toward AFGL2591 VLA 3 are presented in Section 3. The derived excitation temperatures, column densities and abundances of the molecular species measured toward this source are given in Section 4. And the modelling of the chemical segregation detected toward this object is presented in Section 5. In Section 6, we summarize our conclusions.
2. Observations
Observations of the AFGL2591 star forming region were carried out with the SMA111The Submillimeter Array is a joint project between the Smithsonian Astrophysical Observatory and the Academia Sinica Institute of Astronomy and Astrophysics, and is funded by the Smithsonian Institution and the Academia Sinica. in the very extended configuration (VEX) on 2010 February 15. The size of the synthesized beam of our VEX observations was 0.550.34 (see Figure 1 for the UV coverage and dirty beam of the VEX data). The phase center of the observations was set at =20h29m24.90s, =+40∘11′20.3′′. The zenith opacity at 225 GHz was 0.06 and the double sideband system temperatures were typically 200-280 K. The receivers were tuned to an LO frequency of 218.75 GHz, and the correlator provided a uniform spectral resolution of 0.8 MHz (i.e. 1.1 km s-1). The radial velocity of the source was set at -5.5 km s-1 (van der Tak et al., 1999). We used 3C273 (12.5 Jy) as bandpass calibrator, and MWC349A (1.7 Jy) as flux and gain calibrator. Calibration of the raw data was carried out within the IDL MIR software package, and continuum subtraction, imaging and deconvolution was done within MIRIAD.
In order to quantitatively measure the effect of missing flux in our VEX data (see Section 3.4), we have also used unpublished data obtained by us with the SMA in Subcompact configuration (beam of 6.75.6). The central coordinates and spectral resolution of the SMA Subcompact images are the same as those of the VEX observations. However, the frequency coverage was slightly different from that of the VEX data, and the H2S (22,021,1) line was not observed. A detailed analysis of the large-scale structure of the continuum and molecular line emission toward AFGL2591 VLA 3 will be presented elsewhere (Jiménez-Serra et al. in preparation). In the present paper, we only use the Subcompact data to demonstrate that the chemical segregation detected toward this source is not an effect of missing short spacings in the VEX observations.

3. Results
3.1. Dust continuum emission and 12CO outflowing gas
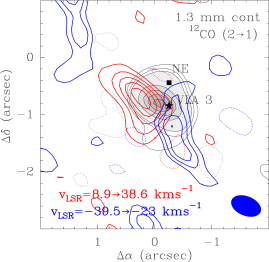
In Figure 2, we show the 12CO images for the red- and blue-shifted gas detected toward AFGL2591 VLA 3 (red and blue contours, respectively), superimposed on the 1.3 mm dust continuum emission (gray scale and black contours). The continuum emission (size of 0.60.45) is associated with the brightest mid-IR source in the region (de Wit et al., 2009), and peaks at =20h29m24.889s, =+40∘11′19.51′′. This position is very similar to that reported by Benz et al. (2007) for the continuum source seen at 348 GHz in their SMA images. The derived integrated 1.3 mm continuum flux (100 mJy) is smaller than previously reported (190 mJy; van der Tak et al., 2006), because the PdBI observations (beam of 0.9) were more sensitive to extended emission. The VLA 3 source detected at 3.6 cm (Trinidad et al., 2003) is located at 0.2 east of the 1.3 mm dust continuum peak, possibly linked to the blue-shifted part of the high-velocity jet (Sanna et al., 2012). The fainter 1.3 mm continuum component toward the south of AFGL2591 VLA 3 could be associated with shocked gas at the walls of the outflow cavity (see Maury et al., 2010).
Toward the north of VLA 3 (see Figure 2), the 1.3 mm continuum emission shows an elongation that could be associated with the NE source reported by Sanna et al. (2012). This source, which is not detected at centimeter wavelengths (Trinidad et al., 2003), has likely generated the double bow-shock structure seen in H2O masers at 0.4 north VLA 3. As shown in Sections 3.2 and 3.3, the NE source does not have any clear counterpart in molecular line emission. The kinematics of the molecular gas toward AFGL2591 VLA 3 seem to be dominated by the kinematics of the VLA 3 molecular envelope, although the angular resolution of our observations may not be sufficient to resolve any molecular feature arising from the NE source.
From Figure 2, we find that the 12CO emission forms a bi-conical structure aligned in the east-west direction and centered at the 1.3 mm VLA 3 source. The kinematics of this structure are consistent with those of the large-scale 12CO outflow (blue-shifted gas toward the west and red-shifted emission toward the east; see Mitchell et al., 1992). In addition, the 12CO blue lobe detected in our VEX images matches the morphology of the bright near-IR loop detected in the K-band (Preibisch et al., 2003). The opening angle of the bi-conical structure detected with the SMA is 90∘-100∘, similar to that measured from H2O masers (110∘; Sanna et al., 2012) or from near-IR emission (100∘; Preibisch et al., 2003).
3.2. Differences in the morphology of the molecular line emission toward AFGL2591 VLA 3
In Table 1, we report the molecular rotational lines measured within the 8 GHz passband of the SMA, and Figure 3 presents the integrated intensity maps for some of these lines superimposed on the 1.3 mm continuum image of the AFGL2591 VLA 3 source. From Figure 3, we find that the observed molecular species show different spatial distributions in a clear chemical segregation. According to the observed morphology, we classify these molecules into Type I, II and III species (see Figure 3). While Type I species (H2S) have a compact structure peaking at the AFGL2591 VLA 3 continuum emission (left panels), Type II molecules (HC3N, OCS and SO2) show a double-peaked morphology that circumvents the continuum peak (middle panels). For Type III species (represented by CH3OH; right panels), the emission is distributed in a ring-like structure surrounding the continuum core.
| TABLE 1 | |||
|---|---|---|---|
| Molecule | Transition | Frequency (MHz) | (K) |
| H2S | 22,021,1 | 216710.44 | 84 |
| 13CS | 54 | 231220.99 | 33 |
| SO | 5645 | 219949.44 | 35 |
| OCS | 1817 | 218903.36 | 100 |
| 1918 | 231060.98 | 111 | |
| HC3N | =0 2423 | 218324.72 | 131 |
| =1e 2423 | 218682.56 | 850 | |
| =1f 2423 | 218854.39 | 850 | |
| =1e 2423 | 218860.80 | 453 | |
| =1f 2423 | 219173.76 | 453 | |
| SO2 | 227,15236,18 | 219275.98 | 353 |
| 222,20221,21 | 219465.55 | 994 | |
| 163,13162,14 | 220165.26 | 893 | |
| 115,7124,8 | 229347.63 | 122 | |
| 132,12131,13 | 229545.30 | 838 | |
| 3710,28389,29 | 230965.25 | 892 | |
| 143,11142,12 | 231980.53 | 865 | |
| CH3OH | =0 5+1,44+2,2 | 216945.52 | 56 |
| =1 61,572,6 | 217299.20 | 374 | |
| =0 20+1,1920+0,20 | 217886.50 | 509 | |
| =0 4+2,23+1,2 | 218440.06 | 46 | |
| =0 8+0,87+1,6 | 220078.56 | 97 | |
| =0 15+4,1116+3,13 | 229589.06 | 375 | |
| =0 8-1,87+0,7 | 229758.76 | 89 | |
| =0 195,15204,16 | 229864.12 | 579 | |
| =0 195,14204,17 | 229939.10 | 579 | |
| =0 3-2,24-1,4 | 230027.05 | 40 | |
| =0 102,993,6 | 231281.11 | 165 | |
| =0 102,893,7 | 232418.52 | 165 | |
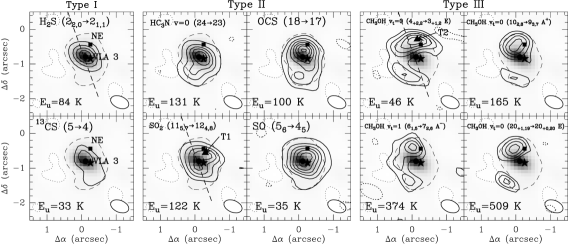
Two species, namely 13CS and SO, have been tentatively classified as Type I and Type II species, respectively. For 13CS, although the brightest emission is detected toward the continuum peak, this molecule also presents a secondary peak toward the south-west of AFGL2591 VLA 3. This peak does not coincide with any of the sources detected in the region or with the molecular emission peaks from Type II or III species. The secondary peak could be associated with outflowing gas. However, its kinematics (at red-shifted velocities) are not consistent with those of the outflow toward this position. As shown in Section 5, CS is also expected to be relatively abundant toward the regions where Type II species are detected, suggesting that the CS emission could be more extended than detected with the rarer 13CS isotopologue.
For SO, the double-peaked morphology in the SO integrated intensity map of Figure 3, is not as clearly seen as for HC3N, OCS or SO2. However, a closer inspection of the Position-Velocity diagram of the SO emission reveals a similar kinematic structure to that of e.g. SO2 (see Figure 5 and below). Nevertheless, we cannot rule out the possibility that the emission from the low-excitation SO (5645) transition is affected by large optical depth effects and/or it is part of the base of the AFGL2591 VLA 3 outflow. A significant amount of SO could also be present within the same region where Type I species arise (i.e. H2S and 13CS), as suggested by the modeling of the chemistry of the AFGL2591 VLA 3 source (Section 5).
We note that the double-peaked structure of Type II species such as SO2 or OCS, and the ring-like morphology of CH3OH, are not likely produced by excitation or optical depth effects since higher-excitation, optically thin transitions such as SO2 (227,15236,18) (=353 K) or CH3OH =1 (61,572,6 A-) and CH3OH =0 (20+1,1920+0,20 E) (=374 K and 509 K, respectively) present similar spatial distribution and kinematic structure to those of the lower-excitation lines (see Figure 3, Figure 5 and Section 3.3 below). This behavior clearly contrasts with that observed toward the G29.96-0.02 hot core (Beuther et al., 2007), where the CH3OH high-excitation, optically thin lines peak toward the hot core while the low-excitation, optically thick transitions show a double-peaked morphology surrounding the core, as expected from large optical depths and if the CH3OH gas were evenly distributed across the hot core. Although chemical differentiation has been reported toward G29.96-0.02 (Beuther et al., 2007), this differentiation is found across proto-cluster scales over 15000 AU, i.e. a factor of 5 larger than the linear scales over which the chemical segregation toward AFGL2591 VLA 3 has been detected (3000 AU). Therefore, the chemical segregation toward AFGL2591 VLA 3 is likely related to the physical structure and physical processes taking place in the molecular envelope around the VLA 3 source.
One may also consider that the two main peaks seen in Type II and III species could be associated with two independent sources coincident with the bright 1.3 mm continuum source toward AFGL2591 VLA 3 and the weaker secondary peak detected toward the south of this source (Figure 3). However, species such as SO2, OCS or CH3OH show emission peaks which are located more than one beam away from these sources. Furthermore, the global kinematics of the molecular gas toward AFGL2591 VLA 3 fit well with Keplerian-like rotation when all molecular emission across the envelope is considered (see Figures 4 and 5, and Section 3.3), suggesting that this emission likely arises from the same physical entity rather than being associated with two different sources.
3.3. Kinematics of the molecular gas toward AFGL2591 VLA 3
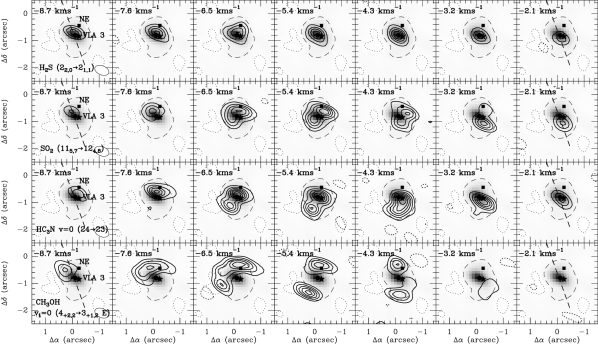
Figure 4 presents the channel maps of some representative lines of Type I (H2S), Type II (SO2 and HC3N) and Type III (CH3OH) species. These maps are superimposed on the 1.3 mm continuum emission of the AFGL2591 VLA 3 source. From these maps, we find that the molecular gas toward VLA 3 shows a velocity gradient from the north-east to the south-west of this source, from blue- to red-shifted velocities. A similar behavior was reported for HDO and HO by van der Tak et al. (2006), and contrasts with that of the outflowing gas (Section 3.1). Since the outflow axis lies almost along the line-of-sight (van der Tak et al., 1999), the kinematics of the molecular gas toward AFGL2591 VLA 3 are consistent with counter-clockwise rotation (van der Tak et al., 2006). We note that the channel maps do not show any clear molecular feature arising from the recently reported source NE (Sanna et al., 2012).
The presence of a velocity gradient for the molecular gas across AFGL2591 VLA 3 is also evident from the Position-Velocity (PV) diagrams obtained along the PV cuts shown in Figures 3 and 4 (see Figure 5). The direction of the PV cuts (P.A.20∘) has been selected so that it is roughly perpendicular to the axis of the AFGL2591 VLA 3 outflow (P.A.280∘; van der Tak et al., 1999). The offsets of the PV diagrams (in arcseconds) are calculated from the northeast to the southwest of AFGL2591 VLA 3.
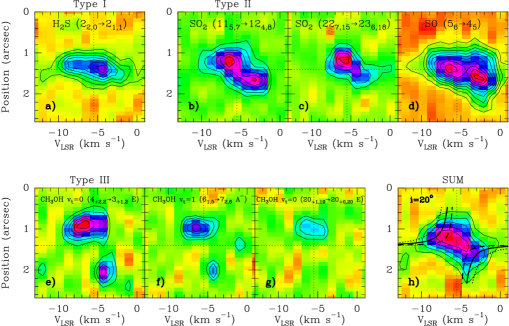
From Figure 5, we find that Type I, II and III species show significant differences in their kinematic distribution with holes in the PV diagrams of SO2, SO and CH3OH. The kinematic structure of all these molecules, however, seems to be complementary, as expected if they probed different regions within the envelope. As shown in Figure 5, H2S (Type I) traces the regions closer to the VLA 3 protostar and is detected across a larger velocity range (from -12 km s-1 to 0 km s-1) than SO2 (from -10 km s-1 to -2 km s-1) or CH3OH (from -8 km s-1 to -3 km s-1). In contrast to H2S, SO2 (Type II species) peaks at regions further away (at 0.25-0.35) from the position of the central source, while CH3OH (Type III) is found at 0.5 away from VLA 3.
Since every species probes a particular region within the AFGL2591 VLA 3 hot core, the global gas kinematics of the envelope can be obtained by combining the data from Type I, Type II and Type III species. For this, we have used the molecular line transitions H2S (22,021,1), SO2 (115,7124,8) and CH3OH =0 (4+2,23+1,2 E). The combined image is generated by normalizing the individual line datacubes to their measured peak intensities and, after normalization, the individual images are added by considering that each of them accounts for 1/3 of the final image. The combined image is shown in panel h of Figure 5. We note that if H2S were not included in the combined image, the final PV diagram would show a central hole in its distribution preventing us to characterize the very inner regions with the most blue- and red-shifted velocities toward the AFGL2591 VLA 3 hot core.
In Figure 5 (panel h), we also compare the combined map with the expected PV diagrams from a rotating envelope that follows a Keplerian law around a central source with a mass of 10 M⊙, 40 M⊙ and 100 M⊙ (see dashed, solid and dotted lines, respectively). The kinematics of the molecular gas toward the AFGL2591 VLA 3 envelope can be explained by Keplerian-like rotation around a 40 M⊙-source. The derived envelope size is 5400 AU, and the inclination angle is i=20∘. This angle is consistent with that proposed by van der Tak et al. (1999) and van der Wiel et al. (2011) for this source. The derived mass of the central object, 40 M⊙, is consistent with that estimated by Sanna et al. (2012, of 38 M⊙), and corresponds to an O6 star on the ZAMS. Previous estimates of the mass of the AFGL2591 VLA 3 source were underestimated due to the closer distance considered (of 1 kpc; see e.g. van der Tak et al., 1999; Trinidad et al., 2003).
3.4. UV coverage and missing flux in the VEX images
The differences in the morphology between Type I, II and III species toward AFGL2591 cannot be attributed to differences in the UV plane coverage, because all molecular lines were observed simultaneously within the same track (see Figure 1).
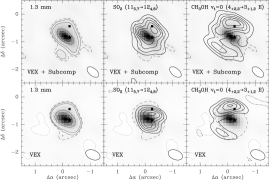
Alternatively, one may think that the observed morphological differences are due to missing flux in the VEX observations. In Figure 6, we compare the combined images of the 1.3 mm continuum, SO2 (Type II) and CH3OH emission (Type III species) obtained with the VEX + Subcompact data, with those generated with the VEX data only. From Figure 6, we find that the combined VEX + Subcompact maps provide a very similar spatial distribution to that reported in the VEX images. This demonstrates that the observed differences in the morphology of Type I, II and III species are not produced by missing short spacings, but due to a real chemical segregation within the AFGL2591 VLA 3 hot core. We note that in Figure 6 we do not include the combined image of the H2S (22,021,1) transition, because this line was not covered within the Subcompact observations (see Section 2).
4. Excitation temperature, column densities and molecular abundances toward AFGL2591
From the integrated intensities of the SO2, CH3OH and HC3N lines measured toward single beams across the AFGL2591 VLA 3 hot core, we can estimate the excitation temperature of the gas across the envelope, Tex, by means of the population diagram method that assumes optically thin emission and LTE (Goldsmith & Langer, 1999). We select the Continuum Peak position, and the emission peaks T1 and T2 because they show the brightest molecular emission for Type I, II and III species, respectively (see Figure 3). In Table 2, we report the observed parameters of the single beam lines measured toward the Continuum Peak for H2S and 13CS, and toward emission peaks T1 for SO, OCS, HC3N and SO2, and T2 for CH3OH (see Figure 3 and this Table for the exact coordinates of these positions). The derived central radial velocities, , and linewidths, , typically range from -5.5 to -6.5 km s-1, and from 2.5 to 4 km s-1, respectively, although significant discrepancies in and are found for some of the species within the same type (see e.g. SO for Type II or the low-excitation lines CH3OH =0 (5+1,44+2,2 E) and CH3OH =0 (3-2,24-1,4 E) for Type III; Table 2). These discrepancies could be due to large optical depths associated with these low-excitation lines (100 K; see Table 1).
In Figure 7, we show the population diagrams of SO2 and HC3N derived toward position T1, and the population diagram of CH3OH obtained toward position T2. The derived Tex are 18511 K for SO2, 15020 K for HC3N, and 12412 K for CH3OH, suggesting a temperature gradient within the envelope. The derived column densities of SO2, HC3N and CH3OH are 21017 cm-2, 81015 cm-2 and 41017 cm-2, respectively. In the case of CH3OH, Tex was derived from lines with 300 K because its lower-excitation transitions are likely optically thick. As shown by Girart et al. (2002), large optical depths indeed lead to the underestimation of the measured column densities of the low-excitation transitions of CH3OH, clearly deviating from the optically thin solution provided by the population diagram method.
| TABLE 2 | ||||
| Molecule | Transition | Continuum PeakaaThe coordinates of the Continuum Peak are =20h29m24.889s, =40∘11′19.51. | ||
| (km s-1) | (km s-1) | Peak Intensity (Jy/beam) | ||
| H2S | 22,021,1 | -5.4(0.5) | 7.3(1.2) | 0.34(0.03) |
| 13CS | 54 | -5.44(0.16) | 3.7(0.5) | 0.18(0.02) |
| Position T1bbThe coordinates for the T1 position are =20h29m24.870s, =40∘11′19.73. | ||||
| (km s-1) | (km s-1) | Peak Intensity (Jy/beam) | ||
| SO | 5645 | -4.71(0.06) | 6.42(0.13) | 0.60(0.02) |
| OCS | 1817 | -6.27(0.09) | 3.6(0.2) | 0.352(0.016) |
| 1918 | -6.21(0.16) | 4.5(0.4) | 0.21(0.02) | |
| HC3N | =0 2423 | -6.8(0.1) | 3.7(0.2) | 0.28(0.02) |
| =1e 2423 | -7.2(0.4) | 1.3(0.0) | 0.10(0.03) | |
| =1f 2423 | -7.7(0.4) | 1.7(0.5) | 0.06(0.02) | |
| =1e 2423 | 0.06ddUpper limits refer to the 3 level in the extracted single beam line spectra. | |||
| =1f 2423 | 0.05 | |||
| SO2 | 227,15236,18 | -5.81(0.12) | 3.1(0.3) | 0.193(0.017) |
| 222,20221,21 | 0.05 | |||
| 163,13162,14 | 0.05 | |||
| 115,7124,8 | -5.69(0.07) | 3.41(0.18) | 0.356(0.018) | |
| 132,12131,13 | 0.06 | |||
| 3710,28389,29 | 0.05 | |||
| 143,11142,12 | 0.05 | |||
| Position T2ccThe coordinates for position T2 are =20h29m24.884s, =40∘11′20.00. | ||||
| (km s-1) | (km s-1) | Peak Intensity (Jy/beam) | ||
| CH3OH | =0 5+1,44+2,2 | -5.3(0.5) | 4.1(1.0) | 0.07(0.03) |
| =1 61,572,6 | -6.41(0.13) | 2.4(0.3) | 0.174(0.018) | |
| =0 20+1,1920+0,20 | -5.95(0.15) | 2.1(0.4) | 0.18(0.02) | |
| =0 4+2,23+1,2 | -5.93(0.07) | 3.29(0.15) | 0.39(0.02) | |
| =0 8+0,87+1,6 | -5.7(0.3) | 4.9(0.7) | 0.087(0.017) | |
| =0 15+4,1116+3,13 | -6.0(0.3) | 4.4(0.8) | 0.085(0.018) | |
| =0 8-1,87+0,7 | -5.74(0.08) | 3.14(0.18) | 0.290(0.018) | |
| =0 195,15204,16 | 0.05 | |||
| =0 195,14204,17 | 0.04 | |||
| =0 3-2,24-1,4 | -7.13(0.15) | 2.5(0.4) | 0.124(0.016) | |
| =0 102,993,6 | -6.63(0.17) | 3.8(0.4) | 0.19(0.02) | |
| =0 102,893,7 | -6.3(0.2) | 4.1(0.5) | 0.16(0.02) | |
For H2S, 13CS, OCS, and SO, the molecular column densities are estimated from single transitions by considering optically thin emission and LTE conditions. The assumed excitation temperature for all these lines is Tex=185 K, the excitation temperature found for SO2 toward T1. For 13CS, we have also considered an isotopic ratio 12C/13C=60 (Wilson & Rood, 1994). The derived column densities are 71016 cm-2 for H2S, 41014 cm-2 for 13CS, 21016 cm-2 for OCS, and 31016 cm-2 for SO.
Since H2S and 13CS are mainly detected toward the Continuum Peak, it is possible that their excitation temperature is higher than assumed here, as suggested by our modelling of the chemical segregation toward AFGL2591 VLA 3 (see Section 5). In case Tex were 1000 K (as measured by Carr et al., 1995, from ro-vibrational absorption lines of HCN), the column densities derived for H2S and 13CS would be factors 5-8 higher than those reported above.
To estimate the molecular abundances across the AFGL2591 VLA 3 envelope, we used the 1.3 mm continuum flux toward the Continuum Peak (68 mJy/beam), toward T1 (19 mJy/beam), and toward T2 (8 mJy/beam), to derive the H2 column densities at these positions. From Equation 2 in Enoch et al. (2006), and by considering dust opacities of 0.01 cm2 g-1 (Ossenkopf & Henning, 1994), we estimate H2 column densities of 21024 cm-2, 41023 cm-2 and 31023 cm-2 toward the Continuum Peak, T1 and T2, respectively. We have assumed dust temperatures of 200 K toward the Continuum Peak, of 200 K toward T1, and of 120 K toward T2, following the gas excitation temperatures derived from SO2 and CH3OH (see above). However, we note that these H2 column densities are subject to uncertainties since the dust temperature cannot be constrained from our observations. If the temperature of the dust were higher than 200 K toward the Continuum Peak as suggested by the modeling of van der Tak et al. (1999, 500-800 K for angular scales 0.2), the derived H2 column densities would be decreased to 3-51023 cm-2.
The derived molecular abundances are presented in Columns 2 and 4 of Table 3. In this Table, we also include the HCN abundances measured toward AFGL2591 and reported by Doty et al. (2002). HCN is detected in absorption in the IR toward this source (Carr et al., 1995); and since absorption is restricted to the direction of the line-of-sight toward the source, the bulk of the HCN gas is likely associated with the innermost regions of the AFGL2591 VLA 3 envelope. We do not include the abundance from other molecular species reported in Doty et al. (2002), because they are mainly obtained from emission measurements toward this source, which likely probe gas at all scales throughout the envelope.
From Table 3, we find that the derived abundances decrease with increasing radius from the position of the Continuum peak to positions T1 and T2 by factors of 5-10 for H2S and CS, and by two orders of magnitude for HCN. For HC3N, SO2, OCS and SO, however, their derived abundances are factors 6 larger toward position T1 than toward the Continuum Peak. Following a similar trend, the derived abundance of CH3OH is a factor of 100 larger toward position T2 than toward the Continuum Peak.
We note that, if the assumed excitation temperature of the gas were 800 K toward the continuum peak, the measured molecular abundances toward this position (see Column 2 in Table 3) would be increased by factors of 2-40. This implies that the increasing abundance trend measured for Type II species (i.e. HC3N, SO2, OCS and SO) across AFGL2591 VLA 3 would become non-existent. However, in the case of CH3OH (Type III species), the derived upper limit to its abundance (210-7) would still be one order of magnitude lower than the CH3OH abundance measured toward position T2 (Table 3); and for Type I species (H2S and CS), their decreasing abundance trend with larger radii would be even stronger than reported in Table 3 (the H2S and CS abundances measured toward the Continuum Peak would be factors of 100-500 higher than toward T2).
We finally stress that the scope of this paper is to show the abundance trends found across the AFGL2591 VLA 3 envelope, and not to obtain the global molecular abundances measured toward this object for which observations with lower angular resolution would be required.

| TABLE 3 | ||||
|---|---|---|---|---|
| Abundances | Observed | ModelaaAbundances predicted by the model for a dynamical age of 2104 yr (Doty et al., 2002). | Observed | ModelaaAbundances predicted by the model for a dynamical age of 2104 yr (Doty et al., 2002). |
| (Continuum Peak) | (Region A) | (Positions T1/T2) | (Region B) | |
| H2S | 510-8 | 510-9 | 410-9bbUpper limits derived from the 1 level in the H2S and 13CS spectra toward position T2. | 110-10 |
| CS | 210-8 | 110-6 | 410-9bbUpper limits derived from the 1 level in the H2S and 13CS spectra toward position T2. | 110-7 |
| HCN | 110-6ccFrom Doty et al. (2002). | 410-5 | 110-8ccFrom Doty et al. (2002). | 310-7 |
| HC3N | 710-9 | 410-11 | 210-8 | 310-8 |
| OCS | 910-9 | 110-11 | 610-8 | 210-9 |
| SO2 | 110-7 | 310-11 | 610-7 | 110-6 |
| SO | 110-8 | 210-9 | 610-8 | 110-8 |
| CH3OH | 210-8ddUpper limits derived from the 1 level in the CH3OH spectrum toward the position of the Continuum Peak. | 110-13 | 210-6eeCH3OH abundance derived from the population diagram shown in Figure 7 for position T2. | 510-8 |
5. Chemical modeling of the AFGL2591 hot core
To qualitatively explain the chemical segregation observed toward AFGL2591 VLA 3, we have used the two-phase UCL CHEM gas-grain chemical code (Viti et al., 2004). In Phase I, this code simulates the free-fall gravitational collapse of a cloud where the mantles of dust grains form via hydrogenation reactions. The initial atomic abundances are solar (Sofia & Meyer, 2001). The formation of the initial core occurs from a diffuse medium with H2 densities of 100 cm-3 at a kinetic temperature of 20 K. The core collapse is stopped when the final density is reached in the model, and it corresponds to time-scales of 5106 yrs. In Phase 2, we calculate the time-dependent evolution of the chemistry of gas and dust once stellar activity is present. In our case, we assume that the mantles are instantaneously evaporated after the turning on of the protostar. We also assume that H2S is the main reservoir of atomic sulfur on dust grains.
The detection of ro-vibrational absorption of HCN toward AFGL2591 VLA 3 (Carr et al., 1995; Lahuis & van Dishoeck, 1997), suggests the presence of an inner and hotter core with relatively low extinction (30m), embedded within a more extended and cooler envelope (van der Tak et al., 1999). The AFGL2591 VLA 3 hot core has therefore been modeled taking into account these two physical regimes (regions A and B; Table 4). Region A corresponds to the inner core where the emission from H2S and 13CS peaks (i.e. toward the Continuum Peak with angular scales of 0.2 or =600 AU at a distance of 3 kpc). Region B corresponds to an intermediate position between T1 and T2 in our observations where HC3N, OCS, SO2, SO and CH3OH show their maximum emission (i.e. at 0.4, or =1100 AU, from the central source in our images; see Figure 3). Therefore, for simplicity, our two region model does not discriminate between positions T1 and T2 within the AFGL2591 VLA 3 envelope. We also consider the existence of an inner cavity within the AFGL2591 VLA 3 hot core, as proposed by Preibisch et al. (2003) and de Wit et al. (2009). These authors derived a radius of 40 AU for this cavity assuming a distance of 1 kpc for the AFGL2591 VLA 3 source (van der Tak et al., 1999). Since the actual distance to this source is 3 kpc (Rygl et al., 2012), the radius of the cavity considered in our model is 120 AU, i.e. a factor of 3 larger than that derived by Preibisch et al. (2003) or de Wit et al. (2009). This cavity remains unresolved in our VEX images. The wall of the cavity at =120 AU is the position at which the visual extinction in our model is =0.
The H2 densities at the end of Phase I for regions A and B are estimated by using the H2 density distribution calculated by van der Tak et al. (2000a), after correcting it from the distance of 3 kpc (see discussion in Section 4.2 of van der Tak et al., 1999, on how the H2 density distribution for AFGL2591 VLA 3 is affected by a larger distance to the source). The averaged H2 densities for regions A and B are, respectively, 4.6106 cm-3 and 1.8106 cm-3. These densities are kept constant in Phase II of our model.
In order to compare the H2 column densities expected from these H2 density values with those measured toward the Continuum Peak and positions T1/T2, one needs to consider the total H2 column density across the AFGL2591 VLA 3 envelope. For instance, to compare the results from region A with those observed toward the Continuum Peak, the contribution from the inner core (5106 cm-3960 AU, i.e. 2480 AU, the shell size for region A; see below) must be added to that from the outer envelope [2106 cm-3(5400-960) AU, where 5400 AU is the envelope size derived in Section 3.3]. This gives a total H2 column density of 21023 cm-2. For region B (or positions T1/T2), the total H2 column density can be estimated simply by doing 2106 cm-35400 AU, which gives 11023 cm-2. For region B, the expected and observed H2 column densities are within a factor of 4. However, for region A (or the Continuum Peak), the low value of the expected H2 column density (21023 cm-2 vs. 21024 cm-2; see Section 4) suggests that the actual temperature of the dust toward the Continuum Peak is likely higher than 200 K (Section 4).
The gas and dust temperatures assumed for regions A and B are obtained from the theoretical modelling of the core by Stäuber et al. (2004) for region A (1000 K), and by van der Tak et al. (1999) for region B (200 K). We stress that the dust and gas temperature profiles do not need to be corrected by the distance of 3 kpc because they are constant in terms of projected distance (i.e. in arcseconds; see Section 4.2 of van der Tak et al., 1999).
| TABLE 4 | ||||
|---|---|---|---|---|
| Region A | Region B | |||
| 600 AU | 1100 AU | |||
| (H2)aaFrom Boonman et al. (2001). | 4.6106 cm-3 | 1.8106 cm-3 | ||
| TkinbbConsistent with HCN line absorption data (Carr et al., 1995; van der Tak et al., 1999) and with our SO2 data (Section 4). | 1000 K | 200 K | ||
| AvccSee text for the derivation of . | 20.5m | 28.5m | ||
To derive the FUV luminosity emitted by the AFGL2591 VLA 3 source, we have used the FUV luminosity profile derived by Bruderer et al. (2009a) as a function of effective temperature, Teff (see Figure A.1 in their work). For an O6-type star on the ZAMS with an effective temperature of Teff4104 K, the luminosity in the FUV band is 21033 erg s-1 per L⊙. Considering that the AFGL2591 VLA 3 source has a total bolometric luminosity of Lbol2105 L⊙ (Section 3 and Sanna et al., 2012), we obtain that the total FUV luminosity emitted by this source is 41038 erg s-1. This luminosity is a factor of 10 higher than that used by Bruderer et al. (2009a), because the distance assumed in their calculations was 1 kpc instead of 3 kpc. Since our model considers a cavity within the AFGL2591 VLA 3 envelope, the FUV photon flux illuminating the wall of this cavity (at 120 AU) is 6109 hab (1 hab=1.610-3 erg s-1 cm-2; Habing, 1968), as derived from geometrical dilution. We thus assume an incident FUV flux of 6109 hab at the position with =0 in our model.
At 120 AU, the extinction is calculated as =[(H2)]/[1.61021 cm-2]. For region A (shell thickness =600 AU-120 AU=480 AU), the extinction is 20.5m. For region B, however, the individual extinction from regions A and B should be added since the FUV field from the AFGL2591 star will be attenuated as it propagates outwards through the envelope. The individual extinction at =1100 AU (shell thickness 1100 AU-600 AU=500 AU) is 8m, leading to a total extinction of 28.5m (20.5m+8m) for region B.
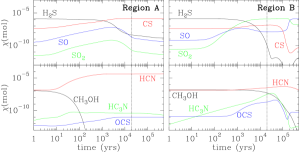
In Figure 8, we present the abundances of H2S, CS, HCN, SO, SO2, HC3N, OCS and CH3OH, predicted for Phase 2 by our two-point model of the AFGL2591 VLA 3 envelope. Our results show that the chemical segregation observed toward this source can be explained by the combination of molecular UV photo-dissociation and a high-temperature gas-phase chemistry in the inner core of AFGL2591 VLA 3. In region A, H2S and CH3OH are initially destroyed by FUV photons (extincted FUV flux of 7.5 hab for 20.5m) after the release of the grain mantles into the gas-phase (100 yr). However, the high temperatures of the gas (Tkin1000 K) allow the re-formation of H2S via the endothermic reaction H2 + HSH2S + H (activation barrier of 8050 K), making H2S abundant in the inner core (510-9 for t2104 yr; Figure 8). We note that these high temperatures are strictly required for region A because the H2S abundance would dramatically drop otherwise, in contrast with what is observed. Like H2S, HCN and CS survive the FUV photo-dissociation thanks to the gas-phase reactions H2 + CNHCN + H and C2 + SCS + C. CH3OH is completely destroyed since it cannot be re-formed in the gas phase (e.g. Garrod et al., 2008).
In region B, molecular photo-dissociation is less severe (extincted FUV flux of only 0.003 hab for 28.5m); and since the gas temperature is only 200 K, the activation barrier for the endothermic reaction to form H2S cannot be overcome. As a consequence, other S-bearing products such as SO, OCS and SO2 are enhanced (Figure 8). This explains the detection of H2S only toward the inner core of AFGL2591 and the double-peaked structure observed for SO, SO2 and OCS (Section 3). We note that this S-bearing chemical structure was also predicted by more complex chemical modeling of the AFGL2591 VLA 3 source, which includes UV and X-ray photo-chemistry (Bruderer et al., 2009b).
In the case of CH3OH and HC3N, these molecules are found to survive in region B thanks to the higher extinction. For HCN, the formation of this molecule is less efficient at lower temperatures, explaining the decrease of the HCN abundance (by a factor of 100) in region B (Figure 8). This decrease is consistent with that observed toward the AFGL2591 VLA 3 envelope (Table 3; van der Tak et al., 1999; Boonman et al., 2001).
The agreement between the predicted and measured abundances for the rest of the molecular species is within factors 2-50, except for HC3N, OCS and SO2 for region A where the discrepancies are found to be of several orders of magnitude. This could be due to the simplistic physical structure assumed for the AFGL2591 VLA 3 envelope. Continuous variations of the density and temperature of the gas and dust with increasing radius, as derived by comprehensive radiative transfer and chemical models (see e.g. van der Tak et al., 1999; Doty et al., 2002; Bruderer et al., 2009b), could significantly change the predicted abundances of these molecules. Indeed, the molecular abundances are very sensitive to the extinction assumed for regions A and B ( in Table 4), which depends on the H2 density distribution of the envelope and the distance to the central protostar. If the assumed extinction is decreased by 1m for regions A and B, the general trend for the molecular abundance is to decrease by factors of 3-7, except for HC3N, H2S and OCS in region B where their abundances are decreased by factors 20.
Alternatively, the large discrepancies in the measured and predicted abundances of HC3N, OCS and SO2 for region A could be due to the fact that the beam size of our VEX observations is larger (0.30.5) than the angular scale considered for region A (of only 0.2). The measured abundances for HC3N, OCS and SO2 could therefore have received some contribution from emission outside the inner 0.2 of the envelope, artificially increasing the abundances for these molecules toward this region.
We note that the maximum extinction allowed for region B is 28.5m. If an extinction of 29m is assumed for this region, the abundance of H2S increases to 10-6, which is several orders of magnitude higher than found from our observations (the upper limit to the H2S abundance measured toward position T2 is of 410-9; see Table 3).
Finally, our results do not depend on our selection of H2S as the main carrier of S on the grain mantles. We have run two models with i) 100% of S locked onto OCS; and ii) 50% of S locked on H2S and 50% just as S. For region A, once OCS is released from the mantles, it is photo-dissociated leading to large abundances of S. S subsequently reacts to form HS, which is rapidly converted into H2S. This also applies to the case with 50% S and 50% H2S, where all S is transformed into H2S. For region B, the only difference is found for the 100% OCS model, where OCS is the most abundant molecule after the release of the mantles. OCS is then efficiently converted into SO and SO2, showing a similar behavior to that found for our previous 100% H2S model.
6. Conclusions
We report the detection of a clear chemical segregation at linear scales 3000 AU within the massive hot core around the high-mass protostar AFGL2591 VLA3 with the SMA. The molecular gas is distributed in three concentric shells where: i) H2S and 13CS (Type I species) peak at the AFGL2591 VLA 3 continuum source; ii) HC3N, OCS, SO2 and SO (Type II species) show a double-peaked morphology circumventing the dust continuum peak; and iii) CH3OH (Type III species) is distributed in a ring-like structure that surrounds the dust continuum emission. The global kinematics of the gas, probed by the different molecules found across the envelope, are consistent with Keplerian-like rotation around a central source of 40 M⊙. This mass is consistent with previous findings (Sanna et al., 2012). In addition, the molecular gas shows a temperature gradient for increasing distance to the central source, as revealed by the higher Tex derived for SO2 (of 18511 K) than for CH3OH (of 12412 K). By comparing our SMA images with gas and dust chemical modeling, we find that the chemical segregation toward the AFGL2591 VLA 3 hot core is explained by the combination of molecular UV photo-dissociation and a high-temperature gas-phase chemistry within the low extinction innermost region in the AFGL2591 VLA 3 massive hot core.
References
- Awad et al. (2010) Awad, Z., Viti, S., Collings, M. P., & Williams, D. A. 2010, MNRAS, 407, 2511
- Benz et al. (2007) Benz, A. O., Stäuber, P., Bourke, T. L., van der Tak, F. F. S., van Dishoeck, E. F., & Jørgensen, J. K. 2007, A&A, 475, 549
- Beuther et al. (2007) Beuther, H., Zhang, Q., Bergin, E. A., Sridharan, T. K., Hunter, T. R., & Leurini, S. 2007, A&A, 468, 1045
- Blake et al. (1987) Blake, G. A., Sutton, E. C., Masson, C. R., & Phillips, T. G. 1987, ApJ, 315, 621
- Boonman et al. (2001) Boonman, A. M. S., Stark, R., van der Tak, F. F. S., van Dishoeck, E. F., van der Wal, P. B., Schäfer, F., de Lange, G., & Laauwen, W. M. 2001, ApJ, 553, L63
- Bruderer et al. (2009a) Bruderer, S., Benz, A. O., Bourke, T. L., & Doty, S. D. 2009a, A&A, 503, L13
- Bruderer et al. (2009b) Bruderer, S., Doty, S. D., & Benz, A. O. 2009b, ApJS, 183, 179
- Campbell (1984) Campbell, B. 1984, ApJ, 287, 334
- Carr et al. (1995) Carr, J. S., Evans, N. J., II, Lacy, J. H., & Zhou, S. 1995, ApJ, 450, 667
- Ceccarelli et al. (2000) Ceccarelli, C., Castets, A., Caux, E., Hollenbach, D., Loinard, L., Molinari, S., & Tielens, A. G. G. M. 2000, A&A, 355, 1129
- Charnley et al. (1992) Charnley, S. B., Tielens, A. G. G. M., & Millar, T. J. 1992, ApJ, 399, L71
- Charnley (1997) Charnley, S. B. 1997, ApJ, 481, 396
- Comito et al. (2005) Comito, C., Schilke, P., Phillips, T. G., Lis, D. C., Motte, F., & Mehringer, D. 2005, ApJS, 156, 127
- de Wit et al. (2009) de Wit, W. J., et al. 2009, A&A, 494, 157
- Doty et al. (2002) Doty, S. D., van Dishoeck, E. F., van der Tak, F. F. S., Boonman, A. M. S. 2002, A&A, 389, 446
- Enoch et al. (2006) Enoch, M. L., et al. 2006, ApJ, 638, 293
- Garay & Lizano (1999) Garay, G., & Lizano, S. 1999, PASP, 111, 1049
- Garrod et al. (2008) Garrod, R. T., Weaver, S. L. W., & Herbst, E. 2008, ApJ, 682, 283
- Girart et al. (2002) Girart, J. M., Viti, S., Williams, D. A., Estalella, R., & Ho, P. T. P. 2002, A&A, 388, 1004
- Goldsmith & Langer (1999) Goldsmith, P. F., & Langer, W. D. 1999, ApJ, 517, 209
- Habing (1968) Habing, H. J. 1968, Bulletin of the Astronomical Institutes of the Netherlands, 19, 421
- Hasegawa & Mitchell (1995) Hasegawa, T. I., & Mitchell, G. F. 1995, ApJ, 451, 225
- Hatchell et al. (1998a) Hatchell, J., Thompson, M. A., Millar, T. J., & MacDonald, G. H. 1998, A&A, 338, 713
- Hatchell et al. (1998b) Hatchell, J., Thompson, M. A., Millar, T. J., & MacDonald, G. H. 1998, A&AS, 133, 29
- Lahuis & van Dishoeck (1997) Lahuis, F., & van Dishoeck, E. F. 1997, Proceedings of the first ISO workshop on Analytical Spectroscopy, Ed. A.M. Heras, K. Leech, N. R. Trams, & M. Perry. ESA Publications Division, p.275
- Maret et al. (2004) Maret, S., et al. 2004, A&A, 416, 577
- Maury et al. (2010) Maury, A. J., André, Ph., Hennebelle, P., Motte, F., Stamatellos, D., Bate, M., Belloche, A., Duchêne, G., & Whitworth, A. 2010, A&A, 512, 40
- Mitchell et al. (1992) Mitchell, G. F., Hasegawa, T. I., & Schella, J. 1992, ApJ, 386, 604
- Nomura & Millar (2004) Nomura, H., & Millar, T. J. 2004, A&A, 414, 409
- Ossenkopf & Henning (1994) Ossenkopf, V., & Henning, Th. 1994, A&A, 291, 943
- Preibisch et al. (2003) Preibisch, T., Balega, Y. Y., Schertl, D., & Weigelt, G. 2003, A&A, 412, 735
- Rygl et al. (2012) Rygl, K. L. J., et al. 2012, A&A, 539, 79
- Sanna et al. (2012) Sanna, A., Reid, M. J., Carrasco-González, C., Menten, K. M., Brunthaler, A., Moscadelli, L., Rygl, K. L. J. 2012, ApJ, 745, 191
- Sofia & Meyer (2001) Sofia, U. J., & Meyer, D. M. 2001, ApJ, 554, L221
- Stäuber et al. (2004) Stäuber, P., Doty, S. D., van Dishoeck, E. F., Jorgensen, J. K., & Benz, A. O. 2004, A&A, 425, 577
- Stäuber et al. (2005) Stäuber, P., Doty, S. D., van Dishoeck, E. F., & Benz, A. O. 2005, A&A, 440, 949
- Trinidad et al. (2003) Trinidad, M. A., et al. 2003, ApJ, 589, 386
- van der Tak et al. (1999) van der Tak, F. F. S., van Dishoeck, E. F., Evans, N. J., II, Bakker, E. J., Blake, G. A. 1999, ApJ, 522, 991
- van der Tak et al. (2000a) van der Tak, F. F. S., van Dishoeck, E. F., Evans, N. J., II, & Blake, G. A. 2000a, ApJ, 537, 283
- van der Tak et al. (2000b) van der Tak, F. F. S., van Dishoeck, E. F., & Caselli, P. 2000b, A&A, 361, 327
- van der Tak & Menten (2005) van der Tak, F. F. S., & Menten, K. M. 2005, A&A, 437, 947
- van der Tak et al. (2006) van der Tak, F. F. S., Walmsley, C. M., Herpin, F., & Ceccarelli, C. 2006, A&A, 447, 1011
- van der Wiel et al. (2011) van der Wiel, M. H. D., van der Tak, F. F. S., Spaans, M., Fuller, G. A., Plume, R., Roberts, H., & Williams, J. L. 2011, A&A, accepted, arXiv:1101.5529
- van Dishoeck & Blake (1998) van Dishoeck, E. F., & Blake, G. A. 1998, ARA&A, 36, 317
- Viti et al. (2003) Viti, S., Girart, J. M., Garrod, R., Williams, D. A., & Estalella, R. 2003, A&A, 399, 187
- Viti et al. (2004) Viti, S., Collings, M. P., Dever, J. W., McCoustra, M. R. S., & Williams, D. A. 2004, MNRAS, 354, 1141
- Wakelam et al. (2004) Wakelam, V., Caselli, P., Ceccarelli, C., Herbst, E., & Castets, A. 2004, A&A, 422, 159
- Wilson & Rood (1994) Wilson, T. L., & Rood, R. 1994, ARA&A, 32, 191