2 Aryabhatta Research Institute of Observational Sciences (ARIES), Nainital 263129, India
email:[r.j.morton, robertus]@sheffield.ac.uk
Observations of quasi-periodic phenomena associated with a large blowout solar jet
Abstract
Aims. A variety of periodic phenomena have been observed in conjunction with large solar jets. We aim to find further evidence for (quasi-)periodic behaviour in solar jets and determine what the periodic behaviour can tell us about the excitation mechanism and formation process of the large solar jet.
Methods. Using the Å (He-II), Å (Fe IX), Å (Fe XII/XXIV) and Å (Fe VIII/XXI) filters onboard the Solar Dynamic Observatory (SDO) Atmospheric Imaging Assembly (AIA), we investigate the intensity oscillations associated with a solar jet.
Results. Evidence is provided for multiple magnetic reconnection events occurring between a pre-twisted, closed field and open field lines. Components of the jet are seen in multiple SDO/AIA filters covering a wide range of temperatures, suggesting the jet can be classified as a blowout jet. Two bright, elongated features are observed to be co-spatial with the large jet, appearing at the jet’s footpoints. Investigation of these features reveal they are defined by multiple plasma ejections. The ejecta display (quasi-)periodic behaviour on timescales of s and have rise velocities of km s-1 along the open field lines. Due to the suggestion that the large jet is reconnection-driven and the observed properties of the ejecta, we further propose that these ejecta events are similar to type-II spicules. The bright features also display (quasi)-periodic intensity perturbations on the timescale of s. Possible explanations for the existence of the (quasi-)periodic perturbations in terms of jet dynamics and the response of the transition region are discussed.
1 Introduction
Solar jets are relatively short lived, transient, common features often observed at the solar limb. Their presence demonstrates the active nature of the underlying solar atmosphere suggesting ubiquitous, fine-scale explosive magnetic events (e.g., Schrijver et al., 1998; Moore et al., 2011). The term solar jets covers a wide range of plasma ejection events that have been observed over the last century, including H surges (Newton, 1934), spicules (Secchi, 1877 or e.g., Beckers, 1972 and references within), type-II spicules (De Pontieu et al., 2007a), macro-spicules (Bohlin et al., 1975), UV jets (Brueckner & Bartoe, 1983), EUV jets (Budnik et al., 1998) and X-ray jets (Shibata et al., 1992). There is some suggestion that these events may all be closely related but no firm evidence has yet been presented to establish this.

Large solar jets may launch plasma hundreds of mega-meters into the solar atmosphere, where the plasma has on occasion exhibited a clear torsional/helical motion during the jets rise. The driving mechanism behind these various jets is yet to be firmly established but the height and speed of the large jets has lead to the proposition of a mechanism involving magnetic reconnection (e.g., Yokoyama & Shibata, 1995, 1996). Jet models often revolve around the emergence of magnetic flux interacting with the existing magnetic field or the motion of existing magnetic fields (Shibata et al., 1992; Moore et al., 2010). Shibata et al. (2007) suggests that varying the heights of the reconnection may give rise to the range of jets observed. Increased spatial resolution and the ability for multi-wavelength analysis of these large jets (e.g., Liu et al., 2011) should provide some answers to the excitation mechanisms and determine the main differences, if any, between the various reported jet phenomena. Some differences between large solar jets has been defined by Moore et al. (2010), who suggest two categories, namely, ‘standard’ and ‘blowout’ jets. Standard jets fit the emerging flux-open field reconnection model mentioned earlier, and emission is mainly seen in X-rays. On the other hand, blowout jets begin as standard jets but the emerging flux erupts during the formation of the standard jet. This results in the presence of a multi-thermal jet, with chromospheric and transition region material ejected in addition to the X-ray jet.
The importance of studying jet phenomena is highlighted by the current interest in the so-called type-II spicules. The reported properties of type-II spicules suggest they are fast moving ( km s-1), apparently short lived ( s) jets that are heated as they rise from the chromosphere, where they are seen in Ca II filters ( MK), to the corona, with temperatures possibly reaching MK. The interest is due to the suggestion that they may play a role in the heating of the quiet Sun, acceleration of the solar wind and maintaining the mass balance in the corona (see, e.g., De Pontieu et al., 2007b, 2009; De Pontieu et al., 2011 and Tian et al., 2011). The type-II spicules are assumed to be excited by reconnection events in the lower solar atmosphere and have been identified in advanced simulations of chromospheric dynamics (Martínez-Sykora et al., 2011).
Observations of the supposedly different jet phenomena have been identified in a singular event. Sterling et al. (2010) report observing bright, fast moving jet features around Mm in length in Ca II, at the footpoints of a larger ‘blowout’ solar jet seen in EUV and soft X-rays. The authors also note the jets observed in Ca II have rise speeds similar to type-II spicules but last for 5 minutes, much longer than previously reported type-II events. However, the observations offer no insight into how these Ca II jets are generated.


Recently, the presence of waves has begun to be reported in observations of solar jets. The study of wave and (quasi-) periodic phenomena in the solar atmosphere has received increased attention over the last two decades. This is partly due to improved spatial and temporal resolution of both space- and ground-based telescopes, paving the way for the new and expanding field of solar magneto-seismology (Uchida, 1970; Roberts et al., 1984; Erdélyi, 2006a, b) which exploits observed wave phenomena to determine hard to measure or otherwise unmeasurable plasma parameters, e.g., the magnetic field strength of the individual magnetic waveguides (see, e.g., Banerjee et al., 2007; Andries et al., 2009; De Moortel, 2009; Ruderman & Erdélyi, 2009; Taroyan & Erdélyi, 2009; Wang, 2011 for reviews of waves in the solar atmosphere and how to exploit them for diagnostic purposes). Advances in ground-based technology has led to the development of high resolution and high cadence instruments that have allowed the direct detections of, e.g., linear torsional Alfvén (Jess et al., 2009 ) and sausage (Morton et al., 2011a) waves.
Magnetic reconnection models predict that some form of periodic wave phenomena is generated by a reconnection event. Two-dimensional numerical simulations by Yokoyama & Shibata (1996) demonstrate the excitation of non-linear slow and fast modes due to the reconnection. Pariat et al. (2009) predicts the presence of kink motions propagating along the field lines surrounding a rotating, closed magnetic region. The kink motions are assumed to be due to a kink instability of the magnetic region before reconnection occurs.

The most visible, and consequently most reported, sign of waves in the large jets is torsional/helical mode that is due to the untwisting of the jet as it rises (e.g., Shimojo et al., 1996; Pike & Mason, 1998; Patsourakos et al., 2008; Liu et al., 2009; Kamio et al., 2010). This feature is possibly due to the relaxation of a twisted field line which has reconnected with an open coronal field line (Shibata & Uchida, 1985; Pariat et al., 2009). However, the helicity is also reported in spicules and macro-spicules, e.g., Zaqarashvili & Erdélyi (2009); Curdt & Tian (2011), with spicules (type-I) generally thought to be driven by waves (De Pontieu et al., 2004). Transverse motions have also been reported in both smaller jets, i.e., spicules (see, e.g., De Pontieu et al., 2007b; Zaqarashvili & Erdélyi, 2009; Kuridze et al., 2012), and large jets (Cirtain et al., 2007; Vasheghani Farahani et al., 2009; Morton et al., 2011b). Recent observations and simulations in Scullion et al. (2011) also find waves propagating along the transition region due to the interaction of a jet with the transition region.
In the following work, we investigate (quasi-)periodic phenomena associated with a large solar jet. Plasma with a range of temperatures is seen to be ejected into the corona. Two, bright elongated features at at the footpoints of the large jet are studied and display quasi-periodic behaviour at different, distinct timescales. The shortest timescale resolved is of the order of s and corresponds to fast moving, bright ejecta. The measured velocities ( km s-1), curved paths seen in time-distance plots and lifetimes of the bright ejecta that make up the elongated features are very similar to the previously reported features of type-II spicules. Further, quasi-periodic intensity disturbances with a longer timescale ( s) are also seen in the bright elongated features. This quasi-periodic behaviour is in conjunction with a propagating transverse kink wave seen in a cool filament ejected with the large jet (Morton et al., 2011b). These observed periodic phenomena allow us to conjecture, along with observational evidence, that the large jet was excited by a low atmosphere (possibly chromospheric) reconnection event. We also discuss possible mechanisms responsible for the presence of periodic phenomena.
2 Observations
The observations began at 09:00 UT on January and last an hour and a quarter till 10:15 UT, on the south east limb using the Solar Dynamic Observatory (SDO) Atmospheric Imaging Assembly (AIA) (Lemen et al., 2011). SDO/AIA has a pixel size of 0.6 arcsec ( km) and a cadence of 12 s. The large solar jet (Fig. 1d) was observed clearly in the Å and Å filters close to the southern polar coronal hole. The jet event is seen partially in the higher temperature filters of AIA, but we will only use information from the Å and Å filters. The data were obtained from the SSW cutout service and had already been corrected for flat-field, de-spiked and co-aligned. Some aspects of the jet have already been studied in Morton et al. (2011b).
The observed evolution of the jet is as follows. A region close to the limb, approximately km in diameter, is seen to undergo a brightening at 09:15 UT in Å. In the the same region in Å, 3-4 small patches of bright emission are simultaneously seen, followed by the appearance of a bright loop or arcade in both channels (Fig. 1a). The emission is seen to increase in the left-hand leg of the loop and then fills the loop in s, suggesting heated plasma flows along the loop.
After the loop/arcade brightening, plasma begins to rise from the left hand side of the loop in Å. The plasma rises above the surrounding spicular material obscuring the loop from view. Approximately s after the loop has disappeared, the plasma has formed a collimated jet and brighter plasma starts to travel along the edges of the jet. The bright plasma appears to highlight twisted magnetic field lines, seen by the bright ‘s’ shapes (Fig. 1b). As the large jet rises higher, the upper portion of the bright twisted field lines fade and two bright, elongated features remain at the base of the jet (Fig. 1c and e). These features exist while plasma is being ejected into the atmosphere; however, once plasma ejection has diminished they fade from view. We note here the bright features are an intrinsic part of the large jet.


The jet has a different appearance in the Å channel compared to that seen in the Å, Å and Å. The jet is the most visible in Å, where a significant amount of plasma is seen to be launched into the solar atmosphere to a height of Mm. This material makes up what is referred to as the plasma curtain. The ejected plasma flows outwards, at an angle to the normal from the surface (from left to right in Fig. 1c). At a later time, a portion of the ejected material is also seen to return to the surface. A cross-cut along the axis of the jet is made and a time-distance plot of the jet rise is obtained (Fig. 2). Bright, outward flowing plasma can be seen to be initially ejected in bursts at s (i.e. s after 09:00 UT). An average value for the outwards velocity of the plasma during the rise phase is km s-1. The plasma curtain cools and begins to fall, with an average speed of km s-1, giving the observed parabolic profile.
At a height of Mm above the jet base, a whip-like motion of the the jet occurs sending the out-flowing plasma in the opposite direction (right to left), giving the plasma curtain a helical motion (Fig. 1c). Another cross-cut (see, Fig. 1d for cross-cut position) is placed perpendicular to the jet axis at around Mm above the jet footpoint. The corresponding time-distance plot is shown in Fig. 3. The onset of helical motion in the plasma curtain can be seen at s, diagonal tracks in the time-distance plot made by the plasma are the result. Some of these tracks are highlighted by the arrows in the plot.
The plasma curtain is not readily visible in the Å, Å and Å channels but faint, co-spatial up-flowing emission is observed. It can be seen in Fig. 1 that the plasma curtain has similar emission to the surrounding spicular material, with a number of regions displaying enhanced emission. This would suggest the temperature of the majority of the plasma curtain is at chromospheric/transition region temperatures; however, the observed enhanced emission would mean the plasma is likely to be multi-thermal with a wide range of temperatures. The bright elongated features are still present in the Å, Å and Å channels along with a dark filament. In Å and Å only the bright, elongated feature (labeled ) closest to the solar surface is clearly visible, the other feature () is much fainter in comparison.
The properties of the dark filament are explored in detail in Morton et al. (2011b). The filament is seen to rise from the jet excitation site and magneto-seismology suggests it has a temperature of K. There is evidence that the filament is partially seen in the Å channel, again as an absorbing feature. However, the plasma curtain forms a ‘sheath’ around the filament and partially obscures it from sight. This suggests the filament is the remnant of a chromospheric magnetic loop (or arcade) that has been ejected.
The bright loop/arcade and the twisted field lines suggest a scenario where twisted, emerging flux has reconnected with open field lines and heated plasma flows along the open lines. This scenario has been suggested previously for the formation of large jets (Shibata et al., 1992) and preliminary studies of this scenario are being carried out with numerical simulations (e.g., Pariat et al., 2009). However, we also see cool chromospheric material ( MK) in the form of the dark filament and upper chromospheric/transition region material in the plasma curtain. This would indicate that we observe an example of a blowout jet, as suggested by Moore et al. (2010). We note also that the spire, typically associated with plasma heated by reconnection, is absent from the event.


3 Periodic behaviour
Now that a description of the large jet has been given, let us proceed to examine the blowout jet event in detail. In particular, we are interested in the bright, elongated features seen at the footpoints of the jet. These features are intrinsically related to the jet formation process and the mass flow into the corona. Further, we search for periodic phenomena in the intensity time series of plasma associated with the bright elongated features. To our knowledge, the investigation of intensity perturbations associated with large jets has so far been neglected. We aim to resolve this and discuss their presence in terms of the formation process of the bright features and the large jet.
3.1 Short Timescales
To begin with, we place cuts (-pixel wide, pixels in length) along the bright, elongated features seen at the foot-points of the jet (Fig. 1e). The bright features are around Mm in length and separated by degrees, with all the ejected plasma that comprises the large jet appearing from between these two features. The features show increased emission (compared to the surrounding plasma) for around s. In Fig. 4 we show the time-distance plots obtained from the cross-cuts placed along the bright features in the Å and Å channels. In both channels and both cuts we see increased emission around 09:15 UT indicating the onset of the jet. This is followed by the rise of fainter plasma, then the rise of further plasma with increased emission.
In the cross-cuts placed along the bright feature labeled (Fig. 1e), it can be seen that there are multiple, bright ejections starting at 09:23 UT. The exact number of ejections is hard to distinguish but it appears to be at least five occurring within a s time frame. A zoom of these ejecta as seen in the Å cross-cut are shown in Fig. 5 with dotted lines highlighting the paths of the brightest ejecta. It is evident from the time-distance plots that the features are fast moving but the ejections do not have a constant speed. The first ejection is the brightest and it can be seen that, close to the base of the cross-cut, the path is curved, suggesting acceleration. An example of two ejecta paths are shown in Fig. 6. The tracks where obtained by determining the pixels with the greatest value of intensity in the time-distance plots and fitting a cubic polynomial to the obtained points. The ejection has an initial speed of km s-1 and accelerates to km s-1. The bright material fades as it reaches the end of the cross-cut. The lifetime of the individual ejecta in both Å and Å filters is between s. This behaviour is not visible in the cross-cut for the bright feature No. 1 (Fig. 4), however, the provided online movies shows many similar ejections from the bright feature.
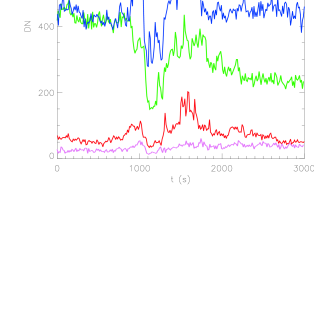
Now, let us examine the flux time series and search for the signature of these fast moving ejections. We select the pixels located at arcseconds (mid way) along the cross-cut in Å, Å, Å and Å. The time series for the intensity between 09:00 UT and 09:48 UT of these pixels are shown in Fig. 7. The plotted flux profile is typical of the other pixels in the cross-cut. At s we see five large peaks in intensity with a quasi-periodicity on s timescales in three of the four selected filters. To investigate further, we de-trended the time series for Å and Å and subject it to a wavelet transform. The results are plotted in Figs. 8 and 9. Significant power (contoured at ) is found in the global spectra at timescales of s and s in Å (Fig. 8) and at s in Å (Fig. 9). The wavelet transforms (Figs. 8b, 9b) also show the presence of power at s timescales during the time of the ejecta. However, the power is contoured above significance only in the wavelet of the Å. The wavelet for Å shows power at for s timescales.
To extract the feature we are interested in, we now turn to Empirical Mode Decomposition (EMD) (for details see, e.g., Huang et al., 1998; Terradas et al., 2004). The first four intrinsic mode functions (IMFs) derived with the EMD for Å are shown in Fig. 10. They correspond to timescales of s, s, s and s identified in the wavelet transforms. Let us concentrate on the first IMF. At s we see the large peaks in intensity, also observed in the flux time series (Fig. 7). This is the signal of the fast moving, ejected material and can be seen to be periodic (or at least quasi-periodic) with a decaying amplitude. A zoom of the first IMF between s is shown in Fig. 11. The magnitude of the amplitude of the signal is of the median background signal in Å and of the median background signal in Å.
To observe this behaviour as a function of distance along the cross-cut, a Fast Fourier Transform (FFT) for each pixel in the cross-cut is taken and a Gaussian filter centered on s with a width is applied and the inverse FFT is taken. The results are shown in the top panels of Figs. 12 and 13. This plot provides a somewhat better visualisation of the high speed, up-flowing material, where the curved tracks show a visibly coherent signal along the entire cross-cut between s and s. Although we cannot see the individual ejections in Fig. 4 for the bright feature , the EMD and the FFT technique do reveal that there are similar, fast moving, up-flowing features with a timescale of s.

3.2 Longer Timescales
Now, let us investigate the nature of the phenomena with timescales s which had significant power in the wavelets (Fig. 8 and 9). We ignore the timescale peaked at s, as this begins well before and ends after the large jet. Further, the Fourier power shows contributions from a wide range of timescales ( s). Instead, we first concentrate on the phenomena with a timescale of s, which is found in the wavelets of the intensity time series from both Å and Å. We again apply a Gaussian filter (as discussed before) centered on s with a width . The results are plotted in Fig. 12 (third panel) for Å and Fig. 13 (second panel) for Å. A coherent, quasi-periodic signal (after s) that propagates along the cross-cut can be seen in both channels. The measured speed of this quasi-periodic feature along the cross-cut is km s-1.
We have also applied the Gaussian filtering process to the entire data cube that makes up the jet observation, for both Å and Å. The movies for this are supplied online (). In the movie of the filtered Å channel, the spicular material surrounding the jet is also seen as it has typical timescales of s. The quasi-periodic phenomena is found throughout the large jet and is dominant in the region defined by the plasma curtain (as seen in the Å images). The quasi-periodic behaviour has relatively large amplitudes at the footpoint of the jet but the amplitude decreases with height (also seen in the cross-cuts, Figs. 12 and 13). Comparing the Fourier power spectra derived from the wavelets (Fig. 14), we note that the power of the quasi-periodic phenomena is stronger in the Å channel with decreasing power in the Å and Å channels. This feature is also seen by comparing the movie of the filtered Å images to the filtered Å images.

Finally, we discuss the intensity perturbation with a timescale of s, observed only in the Å wavelet transform. We again apply a Gaussian filter about s for each pixel in cross-cut (results shown in middle panel of Fig. 12). A coherent signal is seen to propagate along the slit, but only over a distance of Mm. The time at which the intensity perturbation begins is at the same time as the dark filament passes through the cross-cut. The dark features and intensity perturbations rise velocities along the cross-cut are km s-1 (the actual rise velocity of the filament is km s-1, see Morton et al., 2011b). Hence, it would suggest that the passage of the filament is the cause of the intensity perturbation. This is confirmed as we find a velocity of km s-1 for the filament and the intensity perturbation with a timescale of s as seen in cross-cut .
The cross-cuts along the bright features are located at an angle to the path that the dark filament makes through the atmosphere, hence we obtain rise speeds a fraction of that reported in Morton et al. (2011b). If the filament is the driver for the quasi-periodic perturbation, then the propagation speed for the intensity perturbation could also be as high as km s-1. Placing a cross-cut along the filaments axis, almost perpendicular to the solar surface (the orientation of the filament can be seen in Fig. 1e), we do indeed obtain velocities of the order km s-1 associated with the intensity perturbation. The role of the filament in exciting the quasi-periodic phenomena is also seen in the movie of the Å images filtered at s. The amplitude and height of the quasi-periodic phenomena can be observed to increase as the filament rises.
4 Discussion
The nature of the periodic signals seen in the wavelet and EMD of the intensity are not straightforward. Possible options for the intensity perturbations may be due to MHD waves, quasi-periodic up-flows or dominant time-scales related to the jet event. We now discuss the possible interpretation of each observed event. We note there is currently some debate as to the exact differences between the observational signatures of quasi-periodic up-flows and slow modes. Such a discussion is outside the scope of this investigation, so we refer an interested reader to the following pieces of work: De Pontieu & McIntosh (2010); Verwichte et al. (2010); Wang et al. (2011).
High-speed up-flows in large solar jets have been reported previously by, e.g., Liu et al. (2009) and Sterling et al. (2010), although no periodicity was reported in the up-flow. The properties of the high-speed up-flows that are observed here, also bring to mind recent results of investigations into type-II spicules (e.g. De Pontieu et al., 2007a). It is thought that reconnection drives the type-II spicules, which are characterised by the ejection of high velocity up-flows ( km s-1) of hot material into the corona (De Pontieu et al., 2011). Previously reported type-II spicules are seen to originate in the chromosphere with temperatures of MK and velocities of km s-1, before appearing in coronal lines with temperatures of MK. The presence of type-II spicule-like events in large jets are also discussed in Sterling et al., 2010. As pointed out by the authors, the type-II spicule-like features are part of the macroscopic jet so the situation is somewhat more complicated than individual type-II spicules.
Such a statement is highlighted with the following differences between the spicule-like events we see here and previously reported type-II spicules. The bright, fast moving features we observe here have a quasi-periodic rate of recurrence of the order of s, while previous reports indicate periods of minutes for type-II spicules (De Pontieu & McIntosh, 2010). A further difference is that the quasi-periodic behaviour observed here displays apparent damping and only lasts for five periods, whereas no such features have been reported with type-II spicules previously, to our knowledge. However, these properties probably indicate a difference between the drivers of the events.
How can we explain such a phenomena in terms of the suggested mechanisms of jet formation? One option is that multiple reconnection events between emerging, closed field lines and open field lines take place. This would cause the numerous ejections that are being guided upwards by the open field lines. The data also suggests that the reconnection event would probably have to be periodic or quasi-periodic. The possibility for periodic reconnection has been demonstrated in 2-d models if the reconnection has been driven by a fast magneto-acoustic wave (McLaughlin et al., 2010).
Another possibility is that only one reconnection event has occurred and we are seeing the response of the transition region to a single velocity pulse. The rebound-shock model suggests that a velocity pulse can cause the transition region to generate a damped, (quasi-)periodic response (Hollweg et al., 1982; Murawski & Zaqarashvili, 2010). However, the bright, fast moving emission can be seen up to heights of at least 18 arcseconds ( Mm). Simulations of spicule formation via waves show that wave driven spicule phenomena cannot reach such heights, e.g., the simulation of small chromospheric jets such as spicules (De Pontieu et al., 2004), fibrils (Hansteen et al., 2006), mottles (Heggland et al., 2007) typically have heights Mm. Typical rise velocities for wave-driven spicules are also lower ( km s-1) than those measured here. Although, typical amplitudes and velocities for these simulations are based on driving by photospheric granulation, so the results may not be directly applicable here if reconnection driven outflows or non-linear waves are the driver. Recent simulations of a pulse driven jet (Srivastava & Murawski, 2011) demonstrate that an initial large amplitude pulse can lead to the ejection of material to heights of tens of Mm with rise velocities of the order of km s-1.
Enhanced emission at the jets footpoints is seen to exist for longer than s time period associated with the initial, fast moving ejections (although the greatest emission is observed with these ejecta). The enhanced emission also displays quasi-periodic intensity perturbations with the time-scale of s. This may suggest that two separate mechanisms are responsible for its appearance. Similar arguments to those just given about the origins of the periodicity can be applied.
If we assume reconnection is responsible, than we have to explain the presence of the quasi-periodicity. The observed timescale is similar to that previously reported for a range of wave phenomena present throughout the solar atmosphere see, e.g. Banerjee et al., 2007. It has been demonstrated that the waves in the lower solar atmosphere can drive reconnection to produce small scale jet events with the same periodicity as the exciting wave (Heggland et al., 2009). On the other hand, waves generated by reconnection (e.g. Yokoyama & Shibata, 1996) could also display these timescales.
An alternative to reconnection is, again, the rebound shock process. From the results of previous simulations of the rebound shock process, it would appear more feasible that they could generate the observed behaviour at s timescales rather than the s timescale. For example, the observed up-flow speed of km s-1 is compatible with rebound-shock spicule simulations (e.g., Murawski & Zaqarashvili, 2010).
The movies of the filtered time series also show that the quasi-periodic behaviour is also present throughout the large jet. The amplitude of the perturbations appears to decrease significantly with height (e.g., compare amplitudes at the footpoints to the amplitudes at Mm above the surface). The regions which display the (quasi-)periodic behaviour are co-spatial with the plasma curtain. This hints that whatever is generating the observed timescales and the bright elongated features also contributes to the formation of the plasma curtain. Although, further investigation is needed before a firm statement can be made on this.


There is also the presence of an intensity perturbation with a period of s in the Å time series. The quasi-periodicity appears to be driven by the passage of the cool filament. To explain the quasi-periodic nature of the signal, we suggest the passage of the filament through the transition region could result in the initiation of the rebound-shock process. The filament fills the role of a density/velocity pulse, as used in the simulations, and initiates quasi-periodic behaviour as it passes through the transition region. The amplitude of the signal for the perturbation is larger close the jet footpoints but appears to decay with height and does not propagate high into the atmosphere (see online movie). The amplitude is also seen to decay with time in the EMD results (Fig. 10, third panel). Similar behaviour is also found in the rebound-shock simulations. If this is indeed the scenario, then the observed quasi-periodic behaviour, i.e., the intensity perturbation with a period of s, would not then tell us anything about the initiation process of the large jet.

5 Summary and Conclusions
We study a large solar jet event that occurs close to the southern polar coronal hole. Due to a number of observational signatures such as a loop/arcade brightening, an untwisting field and the final height of the large jet we conclude that the jet is probably initiated by a magnetic reconnection event between a twisted, closed field and an open magnetic field. The presence of plasma with a wide range of temperatures suggests this event falls into the blowout jet scenario (Moore et al., 2010), although no high temperature (X-ray) component is observed. To investigate the process of jet formation we take a novel approach and look for periodic behaviour in intensity associated with enhanced emission at the large jet’s footpoints.
For part of the enhanced emissions lifetime, bright elongated features composed of multiple bright, fast moving ( km s-1) plasma ejections are observed. The ejections have properties that are similar to those reported for type-II spicules. Interpretation of the observed events as type-II spicule-like features is not incompatible with the idea that a reconnection-based mechanism is responsible for generating the large solar jets. The events appear to have a timescale of s, suggesting that (quasi-)periodic reconnection may be occurring.
On the other hand, there exists quasi-periodic intensity perturbations with a timescale of s in the enhanced emission. The oscillation had significant power in the Å and Å channels and was found to propagate along the slits at km s-1. The appearance of two separate time-scales, i.e., 50 s and 300 s, could suggest that more than one mechanism is responsible for determining the jet dynamics.
In our view, the presence of the multiple bright, fast moving plasma ejections here, and in previous works (Sterling et al., 2010), suggests that type-II spicule-like events could play an important role in determining the appearance of the jets. Type-II events are already thought to be important for maintaining the mass balance in the corona and could be important for the distribution of the UV/EUV temperature material, that makes up the larger jet, into the corona. The extent of the role played by the response of the transition region to waves and flows impinging on it also needs further detailed study with regards to jet formation.
Acknowledgements.
The authors thank the referee for providing insightful comments that improved the manuscript and A. Engell, D. Jess, and P. Grigis for a number of useful discussions. RE acknowledges M. Kéray for patient encouragement. The authors are also grateful to NSF, Hungary (OTKA, Ref. No. K83133) and the Science and Technology Facilities Council (STFC), UK for the support they received. AKS thanks SP2RC for the financial support received for the visits and collaborative research. AKS also acknowledges the encouragement and support of Shobhna Srivastava. The data is provided courtesy of NASA/SDO and the AIA, EVE, and HMI science teams.References
- Andries et al. (2009) Andries, J., van Doorsselaere, T., Roberts, B., et al. 2009, Space Science Reviews, 149, 3
- Banerjee et al. (2007) Banerjee, D., Erdélyi, R., Oliver, R., & O’Shea, E. 2007, Sol. Phys., 246, 3
- Beckers (1972) Beckers, J. M. 1972, ARA&A, 10, 73
- Bohlin et al. (1975) Bohlin, J. D., Vogel, S. N., Purcell, J. D., et al. 1975, ApJ, 197, L133
- Brueckner & Bartoe (1983) Brueckner, G. E. & Bartoe, J. 1983, ApJ, 272, 329
- Budnik et al. (1998) Budnik, F., Schroeder, K., Wilhelm, K., & Glassmeier, K. 1998, A&A, 334, L77
- Cirtain et al. (2007) Cirtain, J. W., Golub, L., Lundquist, L., et al. 2007, Science, 318, 1580
- Curdt & Tian (2011) Curdt, W. & Tian, H. 2011, A&A, 532, L9+
- De Moortel (2009) De Moortel, I. 2009, Space Science Reviews, 149, 65
- De Pontieu et al. (2004) De Pontieu, B., Erdélyi, R., & James, S. P. 2004, Nature, 430, 536
- De Pontieu et al. (2007a) De Pontieu, B., McIntosh, S., Hansteen, V. H., et al. 2007a, PASJ, 59, 655
- De Pontieu & McIntosh (2010) De Pontieu, B. & McIntosh, S. W. 2010, ApJ, 722, 1013
- De Pontieu et al. (2011) De Pontieu, B., McIntosh, S. W., Carlsson, M., et al. 2011, Science, 331, 55
- De Pontieu et al. (2007b) De Pontieu, B., McIntosh, S. W., Carlsson, M., et al. 2007b, Science, 318, 1574
- De Pontieu et al. (2009) De Pontieu, B., McIntosh, S. W., Hansteen, V. H., & Schrijver, C. J. 2009, ApJ, 701, L1
- Erdélyi (2006a) Erdélyi, R. 2006a, Royal Society of London Philosophical Transactions Series A, 364, 351
- Erdélyi (2006b) Erdélyi, R. 2006b, in Proceedings of SOHO 18/GONG 2006/HELAS I, Beyond the spherical Sun, ed. K. Fletcher & M. Thompson, ESA SP-624
- Hansteen et al. (2006) Hansteen, V. H., De Pontieu, B., Rouppe van der Voort, L., van Noort, M., & Carlsson, M. 2006, ApJ, 647, L73
- Heggland et al. (2007) Heggland, L., De Pontieu, B., & Hansteen, V. H. 2007, ApJ, 666, 1277
- Heggland et al. (2009) Heggland, L., De Pontieu, B., & Hansteen, V. H. 2009, ApJ, 702, 1
- Hollweg et al. (1982) Hollweg, J. V., Jackson, S., & Galloway, D. 1982, Sol. Phys., 75, 35
- Huang et al. (1998) Huang, N. E., Shen, Z., Long, S. R., et al. 1998, Royal Society of London Proceedings Series A, 454, 903
- Jess et al. (2009) Jess, D. B., Mathioudakis, M., Erdélyi, R., et al. 2009, Science, 323, 1582
- Kamio et al. (2010) Kamio, S., Curdt, W., Teriaca, L., Inhester, B., & Solanki, S. K. 2010, A&A, 510, L1+
- Kuridze et al. (2012) Kuridze, D., Morton, R. J., Erdélyi, R., et al. 2012-Accepted, ApJ
- Lemen et al. (2011) Lemen, J. R., Title, A. M., Akin, D. J., et al. 2011, Sol. Phys., 115
- Liu et al. (2009) Liu, W., Berger, T. E., Title, A. M., & Tarbell, T. D. 2009, ApJ, 707, L37
- Liu et al. (2011) Liu, W., Berger, T. E., Title, A. M., Tarbell, T. D., & Low, B. C. 2011, ApJ, 728, 103
- Martínez-Sykora et al. (2011) Martínez-Sykora, J., Hansteen, V., & Moreno-Insertis, F. 2011, ApJ, 736, 9
- McLaughlin et al. (2010) McLaughlin, J. A., Hood, A. W., & de Moortel, I. 2010, Space Sci. Rev., 62
- Moore et al. (2010) Moore, R. L., Cirtain, J. W., Sterling, A. C., & Falconer, D. A. 2010, ApJ, 720, 757
- Moore et al. (2011) Moore, R. L., Sterling, A. C., Cirtain, J. W., & Falconer, D. A. 2011, ApJ, 731, L18+
- Morton et al. (2011a) Morton, R. J., Erdélyi, R., Jess, D. B., & Mathioudakis, M. 2011a, ApJ, 729, L18
- Morton et al. (2011b) Morton, R. J., Verth, G., McLaughlin, J. A., & Erdélyi, R. 2011b, ApJ
- Murawski & Zaqarashvili (2010) Murawski, K. & Zaqarashvili, T. V. 2010, A&A, 519, A8
- Newton (1934) Newton, H. W. 1934, MNRAS, 94, 472
- Pariat et al. (2009) Pariat, E., Antiochos, S. K., & DeVore, C. R. 2009, ApJ, 691, 61
- Patsourakos et al. (2008) Patsourakos, S., Pariat, E., Vourlidas, A., Antiochos, S. K., & Wuelser, J. P. 2008, ApJ, 680, L73
- Pike & Mason (1998) Pike, C. D. & Mason, H. E. 1998, Sol. Phys., 182, 333
- Roberts et al. (1984) Roberts, B., Edwin, P. M., & Benz, A. O. 1984, ApJ, 279, 857
- Ruderman & Erdélyi (2009) Ruderman, M. S. & Erdélyi, R. 2009, Space Science Reviews, 149, 199
- Schrijver et al. (1998) Schrijver, C. J., Title, A. M., Harvey, K. L., et al. 1998, Nature, 394, 152
- Scullion et al. (2011) Scullion, E., Erdélyi, R., Fedun, V., & Doyle, J. 2011, Submitted
- Secchi (1877) Secchi, P. A. 1877, La Soleil, Vol. 2, Chapter II (Paris: Gauthier-Villars)
- Shibata et al. (1992) Shibata, K., Ishido, Y., Acton, L. W., et al. 1992, PASJ, 44, L173
- Shibata et al. (2007) Shibata, K., Nakamura, T., Matsumoto, T., et al. 2007, Science, 318, 1591
- Shibata & Uchida (1985) Shibata, K. & Uchida, Y. 1985, PASJ, 37, 31
- Shimojo et al. (1996) Shimojo, M., Hashimoto, S., Shibata, K., et al. 1996, PASJ, 48, 123
- Srivastava & Murawski (2011) Srivastava, A. K. & Murawski, K. 2011, A&A, 534, A62
- Sterling et al. (2010) Sterling, A. C., Harra, L. K., & Moore, R. L. 2010, ApJ, 722, 1644
- Taroyan & Erdélyi (2009) Taroyan, Y. & Erdélyi, R. 2009, Space Science Reviews, 24
- Terradas et al. (2004) Terradas, J., Oliver, R., & Ballester, J. L. 2004, ApJ, 614, 435
- Tian et al. (2011) Tian, H., McIntosh, S. W., & De Pontieu, B. 2011, ApJ, 727, L37+
- Uchida (1970) Uchida, Y. 1970, PASJ, 22, 341
- Vasheghani Farahani et al. (2009) Vasheghani Farahani, S., Van Doorsselaere, T., Verwichte, E., & Nakariakov, V. M. 2009, A&A, 498, L29
- Verwichte et al. (2010) Verwichte, E., Marsh, M., Foullon, C., et al. 2010, ApJ, 724, L194
- Wang (2011) Wang, T. 2011, Space Sci. Rev., 16
- Wang et al. (2011) Wang, T., Ofman, L., & Davila, J. M. 2011, ArXiv e-prints
- Yokoyama & Shibata (1995) Yokoyama, T. & Shibata, K. 1995, Nature, 375, 42
- Yokoyama & Shibata (1996) Yokoyama, T. & Shibata, K. 1996, PASJ, 48, 353
- Zaqarashvili & Erdélyi (2009) Zaqarashvili, T. V. & Erdélyi, R. 2009, Space Sci. Rev., 149, 355