Probing the innermost dusty structure in AGN with mid-IR and near-IR interferometers
Abstract
With mid-IR and near-IR long-baseline interferometers, we are now mapping the radial distribution of the dusty accreting material in AGNs at sub-pc scales. We currently focus on Type 1 AGNs, where the innermost region is unobscured and its intrinsic structure can be studied directly. As a first systematic study of Type 1s, we obtained mid-/near-IR data for small samples over 3–4 orders of magnitudes in UV luminosity of the central engine. Here we effectively trace the structure by observing dust grains that are radiatively heated by the central engine. Consistent with a naive expectation for such dust grains, the dust sublimation radius is in fact empirically known to be scaling with from the near-IR reverberation measurements, and this is also supported by our near-IR interferometry. Utilizing this empirical relationship, we normalize the radial extent by and eliminate the simple scaling for a direct comparison over the samples. We then find that, in the mid-IR, the overall size in units of seems to become more compact in higher luminosity sources. More specifically, the mid-IR brightness distribution is rather well described by a power-law, and this power-law becomes steeper in higher luminosity objects. The near-IR flux does not seem to be a simple inward extrapolation of the mid-IR power-law component toward shorter wavelengths, but it rather comes from a little distinct brightness concentration at the inner rim region of the dust distribution. Its structure is not well constrained yet, but there is tentative evidence that this inner near-IR-emitting structure has a steeper radial distribution in jet-launching objects. All these should be scrutinized with further observations.
1 Introduction
Using long-baseline interferometers in both the mid-IR and near-IR, we are probing the innermost dusty structure in the putative torus in active galactic nuclei (AGNs) at unprecedented spatial resolutions in the IR. One of the first goals of our study has been to directly map the radial distribution of the accreting material. We currently focus on Type 1 AGNs, where our line of sight is thought to be more or less face-on and the innermost region can directly be studied without significant effects from inclination and obscuration. We aim to summarize below the status of our systematic Type 1 study in both the mid-IR and near-IR.
2 Removing the simple dependency
Let us start with addressing a simple, but naive, luminosity scaling that should be carefully considered in our study. The mid- and near-IR radiation in AGNs is generally thought to be the thermal emission from dust grains that are radiatively heated by the UV/optical emission of the central engine. Effectively, we are using these dust grains to trace the inner structure. When the temperature of the observed dust grains is simply determined by the central engine’s direct illumination and the dust thermal re-emission, the radial distance of the dust grains at a given temperature will be proportional to . Here we assume that the incident spectral shape does not change with the UV luminosity , which we discuss more below. Then our observations at a fixed wavelength would find the size of the structure to also scale with , since they would be sensing the dust grains of the same temperature range.
This simple scaling may not realize due to various quantities and properties potentially changing with luminosity. However, at least for the innermost dust sublimation region, this seems to hold – the dust sublimation radius as probed by the near-IR reverberation measurements is known to be proportional to Suganuma06 . Here the relation is found for optical luminosity, rather than the more relevant UV luminosity, implying the same UV–optical spectral shape over the range of luminosities at least approximately. Therefore, we assume a generic spectral shape and define the UV luminosity as a scaled optical luminosity. This innermost scaling is in fact supported also by the results from our near-IR interferometry, although there is a distinction between our interferometric size measurements and the reverberation measurements, as we discuss in Sect.4. Based on this empirical relationship, which matches the naive expectation, it would be physically insightful if we normalize the radial extent in our study by the dust sublimation radius given by the fit to the reverberation measurements. This will remove the simple scaling and let us investigate what is left behind it.
Each interferometric measurement gives a visibility at a certain spatial frequency, or its reciprocal, spatial wavelength, which roughly corresponds to the spatial scale probed by that particular configuration of the interferometer (see more in Sect.3). We normalize this probed spatial scale by for each observed object (in this case, spatial frequency will have the units of cycles per ). Differences in distance, as well as in luminosity, will be folded into the different angular sizes of , where visibility curves as a function of the spatial wavelength in units of for different objects can be compared uniformly Kishimoto09 . The normalization gives a physical meaning to the probed spatial scale, which makes the interferometric observables more interpretable physically and directly. This is quite important since our converage is normally poor and we still have to deal with direct observables in Fourier space (i.e. visibility), rather than quantities converted to those in image space.
We note that the dust sublimation radii from the reverberation measurements are systematically smaller by a factor of 3 Kishimoto07 than that expected for a representative property of dust grains in the Galactic interstellar medium for each given Barvainis87 . We have specifically discussed this issue in Kishimoto07 , including the case for large grains as well as anisotropic radiation and absorption. The case for large grains in the nuclear region has long been suggested on different grounds (e.g. Maiolino01II ; Gaskell04 ), while the effect of anisotropy is extensively studied recently by Kawaguchi10 .
(a)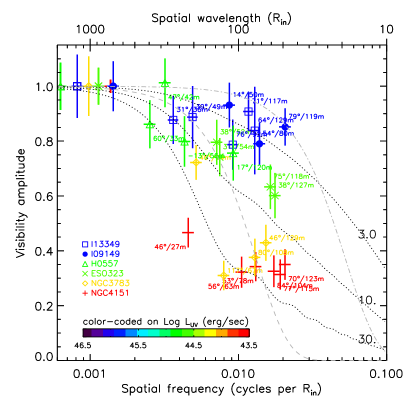 (b)
(b)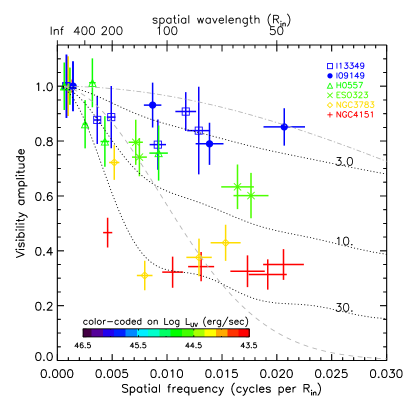
3 Results: mid-IR
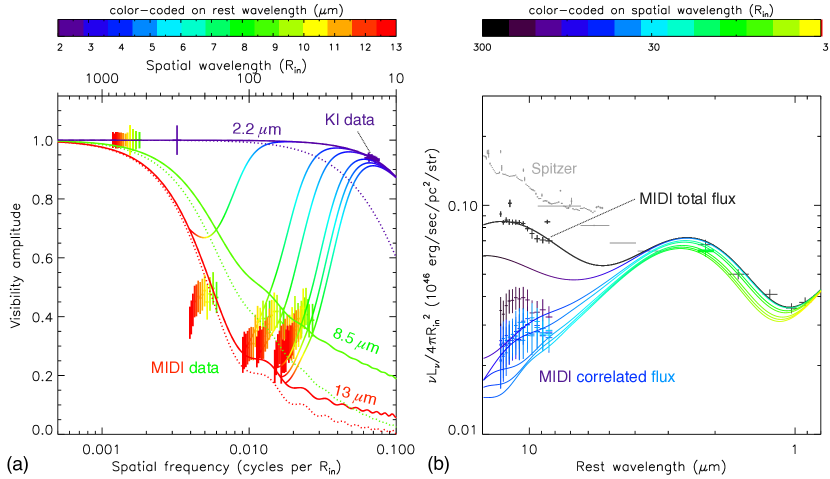
Figure 1 is such a uniform comparison plot. It shows the visibility amplitudes measured with MIDI/VLTI for 6 Type 1 objects at the rest-frame wavelength range of 10–12 m as a function of normalized spatial frequency in log scale (or normalized spatial wavelength; see upper axis). Figure 1 is for the reader who prefers to see the same plot in linear scale.
First, if the structure scales only with , i.e. if we see intrinsically the same distribution (only with the radius-temperature scaling discussed above), the visibility curves should look all the same in the normalized units. However, this is not the case. Visibilities at a given normalized spatial frequency, or at a given spatial scale probed, are systematically different: within the small sample, which nevertheless spans over 2.5 orders of magnitudes in UV luminosity, the overall mid-IR emission size in higher luminosity objects (shown in bluer colors) seems more compact than that in lower luminosity ones (redder colors), when seen in units of .
Here we need to be careful when we talk about the size. In Fig.1, we also have plotted visibility curves of Gaussians with HWHM of 20 and 5 . In this log-scale plot, the visibility curve for a Gaussian with another HWHM will simply be shifted in the horizontal direction with no change in shape, with the shift amount proportional to the HWHM ratio. This conveniently tells us which visibility data points probe approximately which spatial scales111For instance, the HWHM=20 Gaussian gives visibility =0.5 at spatial wavelength =4.5HWHM=90 (more exactly, 4.5 means ), and conversely, an observation at =90 would roughly probe a spatial scale of radius =20. This quantity would be called a half-visibility radius Kishimoto11MIDI ., but this also immediately tells us that a single Gaussian seems quite inadequate for describing the mid-IR visibility curve for each object. This is also evident in Fig.1 where none of the objects seem to follow Gaussian-like visibility curves.
Rather, the observed visibility curves show that the mid-IR flux originates from a much wider range of spatial scales in each object. The dotted curves in both panels of Fig.1 are for power-law brightness distributions with different steepnesses, where the steepness is characterized as a half-light radius, within which the half of the total integrated light at a given wavelength is contained (with the inner cut-off at radius ; the outer radius is set to 100 here). Each object seems to follow a power-law brightness distribution of a different steepness, with higher luminosity objects looking steeper, while lower luminosity ones being more extended. Furthermore, since the radial temperature run of the heated (illuminated) dust grains as a function of the normalized radius is expected to be roughly the same for these face-on targets, the steepness of the brightness distribution would correspond to that of the surface density of these heated dust grains. Thus we can infer that the higher luminosity objects have steeper dust density distributions.
4 Results: near-IR
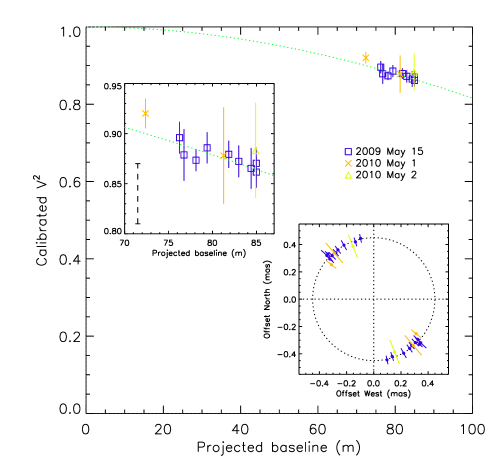
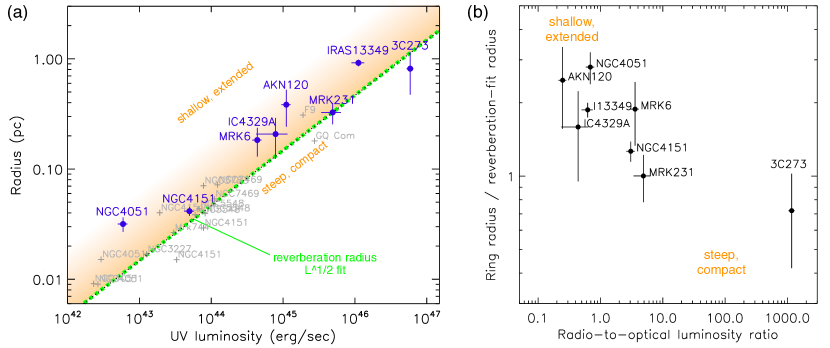
In the near-IR, the first measurement of the K-band (2.2 m) visibility was made for the brightest Type 1 AGN NGC4151 with the Keck interferometer (KI), which showed squared visibility at a projected baseline of 83 m Swain03 . The result was recently confirmed by us Kishimoto09KI and also by Pott10 . Furthermore, we measured the K-band visibility for in total 8 Type 1 AGNs Kishimoto09KI ; Kishimoto11 . All of the targets showed high visibilities 0.8 – 0.9 at m. We interpret this as an indication of the partial resolution of the dust sublimation region. First, we have marginally detected a decrease of visibility over increasing projected baselines for NGC4151 (Fig.2) Kishimoto09KI ; Kishimoto11 , which would be robust evidence that we are resolving a structure. Secondly, from this visibility curve, we derived a thin-ring radius for NGC4151, and also for the other AGNs from the observed visibilities. These interferometric ring radii turned out to be quite comparable to the dust sublimation radii from the near-IR reverberation measurements (Fig.3a) Kishimoto09KI ; Kishimoto11 , which strongly suggests that we are resolving the dust sublimation region.
A further close look at the ring radii and reverberation radii shows that the former are slightly and systematically larger than the latter on average. This is not surprising since the reverberation measurements are known to be most sensitive to the smallest responding radii Koratkar91 , meaning that they are most probably probing a radius very close to the inner boundary of the dust distribution (thus adequately adopted as the dust sublimation radius). On the other hand, the interferometric ring radii are rather brightness-weighted, effective radii of the overall near-IR brightness distribution. Therefore, we can postulate that the ratio of the ring radius to the reverberation radius , i.e. ring radius in units of , can approximately describe the steepness of the structure, in the sense that the ratio is closer to unity when the structure is steeper, while much larger than unity when it is more extended (Fig.3a).
This description of course has a limitation. As the power-law becomes more shallow and extended, the single ring radius description becomes more inadequate, as we have seen in the mid-IR visibility curves222Note that we do not differentiate a ring from a Gaussian since they have essentially the same visibility curve at low spatial frequencies, though a ring model is more physically motivated here.. Here, the underlying assumption is that the near-IR brightness distribution is steep enough to be approximately described by a single ring radius, independent of baseline lengths (though still at relatively low spatial frequencies). Currently, the near-IR structure is not well constrained yet, and this should be followed up with multiple, longer baseline observations.
Under this approximate description of the inner radial structure, do we see any relationship between the inner radial structure and the central engine? In fact, there is tentative evidence that jet-launching objects tend to have a steeper structure (Fig.3) Kishimoto11 . However, the statistical significance is not high and this should be investigated further with a larger sample.
5 Correlated flux as the spectrum of an unresolved structure
We discussed above the mid-IR and near-IR emission regions separately. Obviously, we do want to know whether these two are nicely interconnected. Can we think these two are coming from a single component? The answer does not seem to be affirmative, or at least not in a very obvious way.
Certainly we do see that the structure looks more and more compact toward shorter wavelengths. Figure 4 shows the data for NGC4151, and some of their aspects are shared by other objects. Figure 4 shows visibilities both in the mid- and near-IR, where the color of each data point represents the observing wavelength as indicated by the color bar at the top. Toward shorter wavelengths, the overall visibility becomes larger quite quickly, and thus the corresponding structure becomes smaller. However, when we look into the total flux spectrum, shown in black in Figure 4, it can be easily seen that if we try to extrapolate the mid-IR power-law component toward shorter wavelengths, its color is too red to consistently explain the near-IR part of the spectrum. Instead, the near-IR part makes up a somewhat distinct component on top of the mid-IR power-law component333Historically, the bump around 3 m in the SED of QSOs has been known for decades Neugebauer79 .. As we have seen in the previous section, the near-IR size scale is quite close to the dust sublimation radius , and the near-IR total flux spectrum shows that its color temperature is around 1400 K, quite generically for other objects as well (e.g. 1–2 m SED fit in Fig.2 of Kishimoto09KI , and Fig.3 of Kishimoto07 ). From the measured size and the absolute flux level of this near-IR component, its brightness temperature is estimated to be quite close to the color temperature (see Fig.11 of Kishimoto11MIDI ), meaning that the surface filling factor is quite close to unity and the radiation is almost like that of a black body. Thus the near-IR flux seems to originate from an optically-thick, bright rim region of the dust grains at around and at the sublimation temperature of 1400 K.
Figure 4 also shows the correlated flux spectra at progressively longer baseline with different colors (see the color bar, coded for spatial wavelength). For the visibilities at relatively low spatial frequencies in the first lobe (i.e. before the first null) and in the case of a roughly centro-symmetric object (which we would expect for Type 1s), the correlated flux approximately shows the spectrum of the part of the source unresolved by the interferometer. The correlated flux at longer baselines excludes the flux from the outer region, leaving the spectrum only for the inner core part of the source. Since we also see that the visibility curves look relatively flat at long baselines (Fig.4), they probably show the flux fraction of an almost unresolved source, with the corresponding correlated flux showing the spectrum of this unresolved core. The correlated flux spectrum at long baselines in Fig.4 then indicates that the spectrum of this unresolved core does not seem to be as blue as the mid-IR tail of the near-IR-emitting hot rim component we inferred above — it rather suggests a core at a much lower temperature. In this sense, this lower temperature core seems to co-exist with the near-IR hot bright rim at the spatial scale of .
This hybrid description seems also consistent with the mid-IR and near-IR data for the other 5 targets, having a difference in the steepness of the mid-IR brightness distribution Kishimoto11MIDI .
6 Temperature/density gradient parameterization
All analyses above involve almost no modeling – we can essentially infer all these conclusions from the direct observables. However, we can also make our arguments a little more quantitative by introducing a very simple, physical parameterization. To describe the face-on structure physically, we simply use power-law distributions of temperature and surface density, as we have already seen evidence for the distribution resembling a power law. In addition, we approximate the near-IR rim emission as a ring with a certain effective radius. The accretion disk component, which seems to become important only at wavelengths 1 m, is assumed to be unresolved and have the near-IR spectral shape of , which is supported both theoretically and observationally Koratkar99 ; Kishimoto08 .
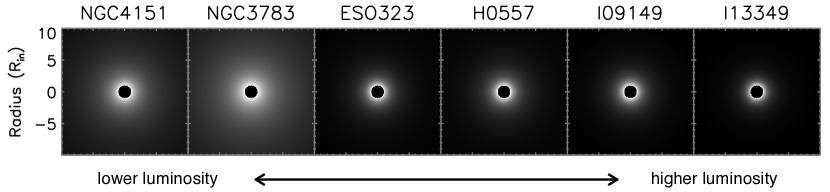
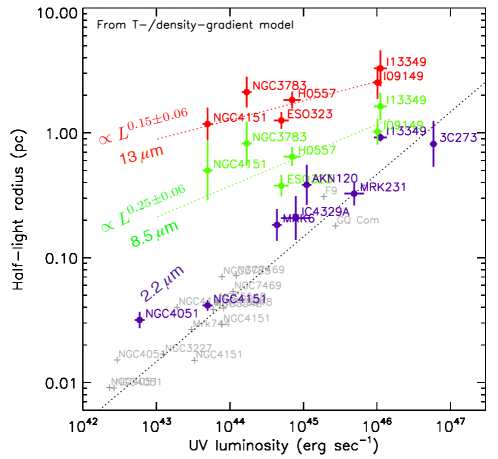
This parameterization can describe the whole data sets at least approximately. Figure 4 includes the fitted model curves for NGC4151, and those for the whole sample are found in Figs.1 and 2 of Kishimoto11MIDI . Using the best-fit parameters, we can construct the model images which visually illustrate what we have discussed. The panels of Figure 5 are such images at 13 m in the rest frame of each object, with spatial scales in units of , showing that the structure becomes steeper for higher luminosity objects (to the right). We can also show this structural change back in unnormalized, physical spatial scales, e.g. in pc, by looking at the change of characteristic radii at different wavelengths. Figure 6 shows the mid-IR half-light radii in pc for the 6 mid-IR targets at the rest-frame 13 and 8.5 m derived from the model fits above, together with the thin-ring radii at 2.2 m for the 8 near-IR targets (with two overlapping targets). If the surface density structure were the same over the sample, the ratios of the mid-IR to near-IR size would just be the same over the sample. However, since mid-IR radii in pc increase with luminosity much slower than (specific values are given in Fig.6), the difference between radii at different wavelengths becomes smaller toward higher luminosities, meaning that the radial density structure becomes steeper at higher luminosities.
Note that Figure 6 is essentially the same as Fig.8 of Kishimoto11MIDI which shows the mid-IR half-light radii measured with a simple geometrical power-law brightness at each wavelength. The half-light radii from the temperature-/density-gradient model are certainly more model-dependent, but utilize more information for each object including the total flux spectrum. The results are essentially consistent within the errors.
The structural steepening could potentially mean that, since the accretion disk luminosity is directly linked to the mass accretion rate, the radial density distribution might become steeper in higher accretion rate objects (here we refer to the absolute rate, not normalized by the Eddington rate). We now even have quantitative estimations for the radial surface density index of the heated dust distribution, which ranges from to for the luminosities covered. We plan to further investigate correlations with different quantities such as the Eddington ratio using a larger sample in order to advance our physical understanding.
7 Conclusions
We have summarized the results of our first systematic study of Type 1 AGNs with IR interferometry, where we attempted to map the radial structure of the inner dusty accreting material. For the warm mid-IR power-law-like component, we seem to see steeper density distributions in objects with higher luminosities, or higher mass accretion rates. For the near-IR compact component in the dust rim region, we see a tentative correlation of steeper structures with more radio-loud central engines. We plan to further scrutinize all the results with a larger sample.
References
- [1] Suganuma M, Yoshii Y, Kobayashi Y, Minezaki T, Enya K, Tomita H, Aoki T, Koshida S and Peterson B A 2006 ApJ 639 46–63 (Preprint arXiv:astro-ph/0511697)
- [2] Kishimoto M, Hönig S F, Tristram K R W and Weigelt G 2009 A&A 493 L57–L60 (Preprint 0812.1964)
- [3] Kishimoto M, Hönig S F, Beckert T and Weigelt G 2007 A&A 476 713–721 (Preprint arXiv:0709.0431)
- [4] Barvainis R 1987 ApJ 320 537–544
- [5] Maiolino R, Marconi A and Oliva E 2001 A&A 365 37–48 (Preprint arXiv:astro-ph/0010066)
- [6] Gaskell C M, Goosmann R W, Antonucci R R J and Whysong D H 2004 ApJ 616 147–156 (Preprint arXiv:astro-ph/0309595)
- [7] Kawaguchi T and Mori M 2010 ApJ 724 L183–L187 (Preprint 1010.5799)
- [8] Kishimoto M, Hönig S F, Antonucci R, Millour F, Tristram K R W and Weigelt G 2011 A&A 536 A78 (Preprint 1110.4290)
- [9] Swain M, Vasisht G, Akeson R, Monnier J, Millan-Gabet R, Serabyn E, Creech-Eakman M, van Belle G, Beletic J, Beichman C, Boden A, Booth A, Colavita M, Gathright J, Hrynevych M, Koresko C, Le Mignant D, Ligon R, Mennesson B, Neyman C, Sargent A, Shao M, Thompson R, Unwin S and Wizinowich P 2003 ApJ 596 L163–L166 (Preprint arXiv:astro-ph/0308513)
- [10] Kishimoto M, Hönig S F, Antonucci R, Kotani T, Barvainis R, Tristram K R W and Weigelt G 2009 A&A 507 L57–60 (Preprint 0911.0666)
- [11] Pott J, Malkan M A, Elitzur M, Ghez A M, Herbst T M, Schödel R and Woillez J 2010 ApJ 715 736–742 (Preprint 1003.4757)
- [12] Kishimoto M, Hönig S F, Antonucci R, Barvainis R, Kotani T, Tristram K R W, Weigelt G and Levin K 2011 A&A 527 A121 (Preprint 1012.5359)
- [13] Koratkar A P and Gaskell C M 1991 ApJS 75 719–750
- [14] Neugebauer G, Oke J B, Becklin E E and Matthews K 1979 ApJ 230 79–94
- [15] Koratkar A and Blaes O 1999 PASP 111 1–30
- [16] Kishimoto M, Antonucci R, Blaes O, Lawrence A, Boisson C, Albrecht M and Leipski C 2008 Nature 454 492–494 (Preprint arXiv:0807.3703)