A deep search for CO J=2-1 emission from a Lyman- blob at
Abstract
We have used the Green Bank Telescope to carry out a deep search for redshifted CO J=2-1 line emission from an extended (17 kpc) Ly blob (LAB), “Himiko”, at . Our non-detection of CO J=2-1 emission places the strong upper limit of K km s-1 pc2 on the CO line luminosity. This is comparable to the best current limits on the CO line luminosity in LABs at and lower-luminosity Lyman- emitters (LAEs) at . High- LABs appear to have lower CO line luminosities than the host galaxies of luminous quasars and sub-mm galaxies at similar redshifts, despite their high stellar mass. Although the CO-to-H2 conversion factor is uncertain for galaxies in the early Universe, we assume M⊙ (K km s-1 pc2)-1 to obtain the limit M(H2) M⊙ on Himiko’s molecular gas mass; this is a factor of lower than the stellar mass in the LAB.
1 Introduction
Significant populations of star-forming galaxies have recently been discovered at high redshifts, , towards the end of the reionization epoch (e.g. Ellis, 2008). Many of these galaxies have been identified due to their excess emission in narrow-band images centred on the redshifted Ly wavelength (e.g. Rhoads et al., 2000; Taniguchi & et al., 2005; Hu et al., 2010); such systems are referred to as Ly emitters (hereafter LAEs). The star-formation rates determined from measurements of the rest-frame UV continuum emission in LAEs at tend to be low, M⊙ yr-1 (e.g. Taniguchi & et al., 2005), and the size of the emission region is typically small, kpc (Cowie et al., 2011).
High- LAEs thus appear to be relatively small galaxies, probably undergoing quiescent star formation. However, a recent Subaru narrow-band imaging survey has discovered a highly extended LAE at , with a spatial extent of kpc, far larger than that of the bulk of the LAE population (Ouchi et al., 2009). The object, “Himiko”, also has a far higher Ly line luminosity, erg s-1, than any other LAE at . Both the large size and the high Lyman- luminosity make Himiko similar to the “Lyman- blobs” (LABs), that have so far been detected at (e.g. Steidel et al., 2000; Matsuda et al., 2004; Dey et al., 2005; Nilsson et al., 2006; Matsuda et al., 2011). The LABs discovered at are extremely large ( kpc in size) Ly-emitting nebulae that show a striking correlation with over-dense regions in the Universe. These have Ly luminosities erg s-1, similar to the luminosities seen in massive high- radio galaxies (e.g. Reuland et al., 2003, but do not show radio emission. Follow-up multi-wavelength studies have shown that LABs tend to be associated with bright sub-millimeter or infrared-luminous galaxies (e.g. Geach et al., 2005) or obscured active galactic nuclei (AGNs; e.g. Basu-Zych & Scharf, 2004; Geach et al., 2009), often with high star formation rates ( M⊙ per year). Recent Spitzer studies have found that the infrared (IR) images of 60% of LABs are consistent with an origin due to star formation, with the remaining 40% of the sample likely to arise either due to AGN activity or an extreme starburst (Colbert et al., 2011). A few LABs have also been detected without a known associated bright galaxy (e.g. Nilsson et al., 2006).
No LABs have so far been detected at low redshifts, (Keel et al., 2009); the blobs thus appear to be a high-redshift phenomenon. The fact that LABs are typically located in over-dense regions suggests that they are linked to the formation of the massive galaxies (e.g. Steidel et al., 2000; Erb et al., 2011). Although a number of mechanisms have been suggested for the sources that power the Ly emission (e.g. cooling inflows of gas, outflows of gas from starburst galaxies or AGNs, or even AGN photoionization; Taniguchi & Shioya, 2000; Haiman & Rees, 2001; Matsuda et al., 2004; Dey et al., 2005; Dijkstra & Loeb, 2009; Geach et al., 2009), it appears unclear whether any single mechanism is capable of explaining the entire LAB population. However, while cooling radiation from gas streams may contribute some fraction of the LAB power (Haiman et al., 2000; Goerdt et al., 2010), radiative transfer calculations have shown that such streams of halo gas cannot account for all the Ly luminosity (Faucher-Giguère et al., 2010). Galaxy formation must hence be responsible for a significant fraction of the Ly emission from LABs. Studies of the star formation activity of galaxies in the vicinity of LABs are thus essential to understanding their nature. Observations of molecular and atomic gas tracers in the LABs would provide crucial insight into the fuel for star formation. The most effective means of studying the cold molecular gas reservoir in high- galaxies is through observations of redshifted CO line emission (e.g. Solomon & Vanden Bout, 2005), which provide a means of studying gas kinematics and estimating the total molecular gas mass available for star formation.
At present, only two LABs have been searched for CO line emission, both at , but with no detections of molecular gas (Yang et al., 2012). We present here a search for CO J=2-1 line emission in the LAB, Himiko, in order to measure its cold molecular gas mass and constrain the kinematics of the interstellar gas in a massive galaxy during the epoch of reionization.111When required, this paper uses a CDM cosmology, with km s-1 Mpc-1, , (Spergel & et al., 2007).
2 Himiko: a Ly blob at z=6.595
The target of our CO line observations, “Himiko”, is a giant ( kpc) LAE at , discovered in the Subaru/XMM-Newton Deep Survey (Ouchi et al., 2009). Himiko has an extremely high Ly line luminosity, L(Ly) erg s-1, well into the LAB category. The Ly emission yields a star-formation rate (SFR) of M⊙/yr (Ouchi et al., 2009); However, this is likely to be an underestimate by a factor of at least a few, given that the Ly line is both resonantly scattered by dust, and, for these redshifts, attenuated due to absorption by the damping wing of neutral hydrogen in the intergalactic medium. The SFR of Himiko is thus likely to be significantly larger than the estimate of M⊙/yr. Ouchi et al. (2009) used fits of stellar synthesis models to the spectral energy distribution over the optical to near-infrared (near-IR) wavelength range to obtain an extremely high stellar mass, M⊙, indicating that Himiko is a massive galaxy. The large transverse size of the Ly-emitting region is also consistent with Himiko being an extremely massive object, in the context of hierarchical models of structure formation. It is thus an excellent candidate for a search for the molecular gas that fuels its high rate of star formation.
3 Observations and Data Analysis
Observations of the CO J=2-1 line emission in Himiko were made with the 110m Green Bank Telescope (GBT) in project AGBT10B-010, using the Ka-band receiver which covers the frequency range GHz. At the redshift of Himiko, the CO J=2-1 line ( GHz) is redshifted to 30.354 GHz. The GBT beam at this frequency has a full-width-at-half-maximum (FWHM) of , corresponding to a spatial extent of kpc at . The GBT AutoCorrelation Spectrometer was set up to sample two 800 MHz IF bands at this frequency, overlapping by 200 MHz, with a single polarization and 2048 channels per band. The total velocity coverage was km s-1. Bandpass calibration was carried out using sub-reflector nodding with a cycle time of 6 seconds. While sub-reflector nodding has high observing overheads, it has been shown to yield excellent spectral baselines in earlier GBT Ka-band observations, far better than have been obtained with standard position-switching. Observations of 3C147 were used to correct the large-scale baseline structure in the target spectra and to calibrate the flux density scale, which we estimate to be accurate to 10%. Typical system temperatures were 35 K throughout the observations. The total on-source time was 4 hours.
The data were analyzed using the GBTIDL222http://gbtidl.sourceforge.net data analysis package, following standard procedures. The data were first visually inspected and any data affected by correlator failures or radio frequency interference were edited out. Next, the narrow expected line width (250 km/s, or 25.5 MHz if the CO linewidth is similar to that of the Ly line) relative to the size of each 800 MHz IF band, meant that we were able to fit and subtract out a 5th-order polynomial baseline from each individual spectrum, without affecting structure on the scales of the expected line emission. After flux density and bandpass calibration and baseline subtraction, the data were inspected for any residual baseline structure that might introduce spurious signals into the final spectrum. Around 10% of the data were found to be affected by such artefacts and were edited out. The individual spectral records were than averaged together, weighting by the system temperature, to produce the final CO spectrum. This was then Hanning-smoothed and re-sampled, before further boxcar smoothing and re-sampling to resolutions of 50, 100, 150 and 250 km/s.
4 Results and Discussion
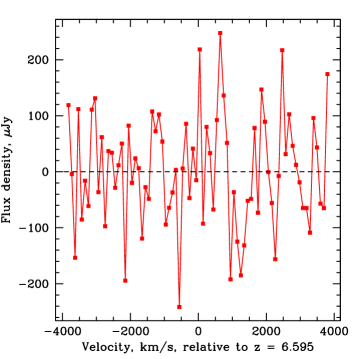
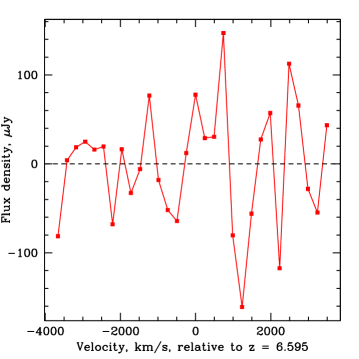
The two panels of Figure 1 show the final CO J=2-1 spectra of Himiko at velocity resolutions of 100 km s-1 (left panel) and 250 km s-1 (right panel). The root-mean-square (RMS) noise is 99 Jy per 100 km s-1 channel and 68 Jy per 250 km/s channel. No statistically-significant spectral features are visible in either spectrum.
Our non-detection of CO J=2-1 line emission in Himiko places strong constraints on the CO line luminosity. The CO line luminosity, , can be written as
| (1) |
where is the observing frequency (in GHz), is the luminosity distance (in Mpc), and is in K km s-1 pc2 (Solomon et al., 1997). In the case of a non-detection, (in Jy km s-1) gives the upper limit on the integrated flux density in the CO J=1-0 line, where is the RMS noise at the velocity resolution . We assume a line width of km s-1, from the observed Ly line width and similar to the median observed line width in quasar host galaxies at intermediate redshifts (e.g. Carilli & Wang, 2006). This results in a limit of K km s-1 pc2 on the CO J=2-1 line luminosity.
Assuming that the CO J=2-1 line emission is thermalized, we can use the CO line luminosity limit to obtain an upper limit to the cold molecular gas mass in Himiko, assuming an appropriate conversion factor, , from line luminosity to molecular gas mass (Solomon & Vanden Bout, 2005). This factor can vary between 0.8 and 4.6 M⊙ (K km s-1 pc2)-1, depending on whether the galaxy is an ultraluminous infrared galaxy (ULIRG) undergoing starburst activity ( M⊙ (K km s-1 pc-2)-1; Downes & Solomon, 1998), or a more quiescent object like the Milky Way ( (K km s-1 pc-2)-1; e.g. Solomon & Barrett, 1991). This factor may be even higher in regions of low metallicity gas (e.g. Hughes et al., 2010; Leroy et al., 2011), such as those expected to be found within the interstellar medium of LAEs in the early Universe. However, massive galaxies like Himiko are unlikely to have such low metallicities, especially given its high inferred stellar mass ( M⊙).
Previous studies of CO J=1-0 line emission in two LAEs at by Wagg et al. (2009) adopted a low factor, similar to ULIRG values, based on the elevated star formation rates in these objects. We note that Combes (2010) argues that the factor in these systems should be closer to the Milky Way value. For a ULIRG conversion factor, M⊙ (K km s-1 pc-2)-1, we obtain the limit M(H2) M⊙ (3-) on the molecular gas mass of Himiko. Ouchi et al. (2009) obtain a stellar mass of M⊙ from a fit to the spectral energy distribution; the molecular gas mass is thus less than the stellar mass by a factor of . Conversely, assuming a Milky Way conversion factor, M⊙ (K km s-1 pc-2)-1, yields the limit M(H2) M⊙ () on the gas mass.
Our limit on the CO line luminosity in Himiko can be converted to a limit on the total far-infrared (FIR) luminosity due to star formation . The best-fit parametrization of the relationship between and , valid for nearby spiral galaxies and starbursts, is (Gao & Solomon, 2004). Assuming that this relationship also holds for the interstellar medium of high- LABs, our upper limit to the CO line luminosity yields the upper limit L⊙ on the total FIR luminosity. Using the relation of Kennicutt (1998) to convert this limit on the FIR luminosity to a limit on the obscured SFR, we obtain M⊙ yr-1. This is consistent with the lower limit of SFR M⊙ yr-1 obtained from the Lyman- line luminosity, even if obscuration/absorption effects cause the SFR derived from the Lyman- line to be underestimated by a factor of a few.
Searches for CO emission have been carried out in only two LABs, LABd05 at and SSA22-LAB01 at , prior to this work (Yang et al., 2012). These authors used the IRAM 30 m telescope to observe the CO 5-4 and CO 3-2 transitions in LABd05 and the Plateau de Bure interferometer to observe the CO 4-3 and CO 3-2 lines in SSA22-LAB01. The non-detections yielded limits of K km s-1 pc2 (LABd05) and K km s-1 pc2 (SSA22-LAB01), similar to our limit on the CO J=2-1 line luminosity in the LAB. We note, in passing, that similar limits on the CO line luminosity have been obtained from GBT CO J=1-0 studies of two LAEs at and (Wagg et al., 2009). Thus, at present, there is no evidence for significant amounts of molecular gas in high- LABs, despite their large stellar masses (e.g. Ouchi et al., 2009; Colbert et al., 2011). The CO luminosity in LABs appears to be significantly lower than that in the luminous quasar host galaxy population at (e.g. Walteret al., 2003; Wang et al., 2010, 2011), in sub-mm starburst and quasar host galaxies at , as well as in quiescent BK-selected disk galaxies at (e.g. Solomon & Vanden Bout, 2005; Daddi et al., 2008; Aravena et al., 2010).
Finally, it should be emphasized that the conversion factor from CO line luminosity to molecular gas mass is highly uncertain in high- galaxies. A low conversion factor [ M⊙ (K km s-1 pc2)-1], applicable to the local ULIRG population, is usually assumed for FIR-luminous objects like high- sub-mm galaxies and quasars (e.g. Tacconi et al., 2006). Conversely, values closer to ones found in the Milky Way have been obtained in star-forming BK-selected galaxies at [ M⊙ (K km s-1 pc2)-2; Daddi et al., 2010]. While studies of the high- LAB and LAE population have typically assumed the ULIRG conversion factor (e.g. Wagg et al., 2009; Yang et al., 2012), it is quite possible that a high conversion factor is applicable to LAEs and LABs at . This may be especially critical for the LAE population, which appears to consist of relatively small galaxies with low SFRs, M⊙ yr-1, and low stellar masses, M⊙ (e.g. Finkelstein et al., 2009; Pentericci et al., 2009; Ono et al., 2010). A low CO-to-H2 conversion factor value would imply that detections of low-J CO line emission would be extremely challenging in these systems, even with new facilities like the Expanded Very Large Array (EVLA) or the Atacama Large Millimeter Array (ALMA). For example, the CO J=3-2 line from a LAE with SFR= M⊙ yr-1 would be redshifted to a frequency of GHz with a peak flux density of Jy, assuming a line FWHM of km s-1), if we assume M⊙ (K km s-1 pc2)-1. Detecting such a line would require hundreds of hours with either the EVLA Q-band receivers or the ALMA Band-1 receivers. This issue would be exacerbated for the LAEs if, as it is likely (e.g. Finkelstein et al., 2011), they are low-metallicity systems. For such systems, with metallicities similar to the SMC, the CO-to-H2 conversion factor could be as high as 30 M⊙ (K km s-1 pc2)-1 (Hughes et al., 2010; Leroy et al., 2011), making it even harder to detect redshifted CO emission. Similarly, the models of Vallini et al. (2012) also suggest that the detection of high-J CO line emission in LAEs will not be possible in reasonable ALMA integration times.
5 Summary
We present results from a deep GBT search for redshifted CO J=2-1 line emission in Himiko, a Lyman- blob at . We do not detect CO J=2-1 line emission, with an upper limit of K km s-1 pc2. This limit is similar to the limits on the CO line luminosity obtained in two LABs at by Yang et al. (2012) and in two Lyman- emitters at by Wagg et al. (2009). Despite their high stellar masses, high- LABs appear to have significantly lower CO line luminosities than luminous quasars or sub-mm galaxies at similar redshifts. Our constraint on the CO line luminosity implies an upper limit of M(H2) M⊙ on the molecular gas mass, assuming a ULIRG conversion factor, M⊙ (K km s-1 pc2)-1. However, it should be noted that this conversion factor is unknown for LABs. A high value of , similar to values in the Milky Way or BK galaxies, would make it extremely difficult to detect CO line emission from LABs and LAEs at , even for upcoming telescopes like ALMA and the EVLA.
References
- Aravena et al. (2010) Aravena, M., Carilli, C., Daddi, E., et al. 2010, ApJ, 718, 177
- Basu-Zych & Scharf (2004) Basu-Zych, A. & Scharf, C. 2004, ApJ, 615, L85
- Carilli & Wang (2006) Carilli, C. L. & Wang, R. 2006, AJ, 131, 2763
- Colbert et al. (2011) Colbert, J. W., Scarlata, C., Teplitz, H., et al. 2011, ApJ, 728, 59
- Combes (2010) Combes, F. 2010, in American Institute of Physics Conference Series, Vol. 1294, American Institute of Physics Conference Series, ed. D. J. Whalen, V. Bromm, & N. Yoshida, 9
- Cowie et al. (2011) Cowie, L. L., Hu, E. M., & Songaila, A. 2011, ApJ, 735, L38
- Daddi et al. (2010) Daddi, E., Bournaud, F., Walter, F., et al. 2010, ApJ, 713, 686
- Daddi et al. (2008) Daddi, E., Dannerbauer, H., Elbaz, D., et al. 2008, ApJ, 673, L21
- Dey et al. (2005) Dey, A., Bian, C., Soifer, B. T., et al. 2005, ApJ, 629, 654
- Dijkstra & Loeb (2009) Dijkstra, M. & Loeb, A. 2009, MNRAS, 400, 1109
- Downes & Solomon (1998) Downes, D. & Solomon, P. M. 1998, ApJ, 507, 615
- Ellis (2008) Ellis, R. S. 2008, First Light in the Universe (Saas-Fee Advanced Course 36), 259
- Erb et al. (2011) Erb, D. K., Bogosavljević, M., & Steidel, C. C. 2011, ApJ, 740, L31
- Faucher-Giguère et al. (2010) Faucher-Giguère, C.-A., Kereš, D., Dijkstra, M., Hernquist, L., & Zaldarriaga, M. 2010, ApJ, 725, 633
- Finkelstein et al. (2011) Finkelstein, S. L., Hill, G. J., Gebhardt, K., et al. 2011, ApJ, 729, 140
- Finkelstein et al. (2009) Finkelstein, S. L., Rhoads, J. E., Malhotra, S., & Grogin, N. 2009, ApJ, 691, 465
- Gao & Solomon (2004) Gao, Y. & Solomon, P. M. 2004, ApJ, 606, 271
- Geach et al. (2009) Geach, J. E., Alexander, D. M., Lehmer, B. D., et al. 2009, ApJ, 700, 1
- Geach et al. (2005) Geach, J. E., Matsuda, Y., Smail, I., et al. 2005, MNRAS, 363, 1398
- Goerdt et al. (2010) Goerdt, T., Dekel, A., Sternberg, A., et al. 2010, MNRAS, 407, 613
- Haiman & Rees (2001) Haiman, Z. & Rees, M. J. 2001, ApJ, 556, 87
- Haiman et al. (2000) Haiman, Z., Spaans, M., & Quataert, E. 2000, ApJ, 537, L5
- Hu et al. (2010) Hu, E. M., Cowie, L. L., Barger, A. J., et al. 2010, ApJ, 725, 394
- Hughes et al. (2010) Hughes, A., Wong, T., Ott, J., et al. 2010, MNRAS, 406, 2065
- Keel et al. (2009) Keel, W. C., White, III, R. E., Chapman, S., & Windhorst, R. A. 2009, AJ, 138, 986
- Kennicutt (1998) Kennicutt, Jr., R. C. 1998, ARA&A, 36, 189
- Leroy et al. (2011) Leroy, A. K., Bolatto, A., Gordon, K., et al. 2011, ApJ, 737, 12
- Matsuda et al. (2004) Matsuda, Y., Yamada, T., Hayashino, T., et al. 2004, AJ, 128, 569
- Matsuda et al. (2011) Matsuda, Y., Yamada, T., Hayashino, T., et al. 2011, MNRAS, 410, L13
- Nilsson et al. (2006) Nilsson, K. K., Fynbo, J. P. U., Møller, P., Sommer-Larsen, J., & Ledoux, C. 2006, A&A, 452, L23
- Ono et al. (2010) Ono, Y., Ouchi, M., Shimasaku, K., et al. 2010, MNRAS, 402, 1580
- Ouchi et al. (2009) Ouchi, M., Ono, Y., Egami, E., et al. 2009, ApJ, 696, 1164
- Pentericci et al. (2009) Pentericci, L., Grazian, A., Fontana, A., et al. 2009, A&A, 494, 553
- Reuland et al. (2003) Reuland, M., van Breugel, W., Röttgering, H., et al. 2003, ApJ, 592, 755
- Rhoads et al. (2000) Rhoads, J. E., Malhotra, S., Dey, A., et al. 2000, ApJ, 545, L85
- Solomon & Barrett (1991) Solomon, P. M. & Barrett, J. W. 1991, in IAU Symposium, Vol. 146, Dynamics of Galaxies and Their Molecular Cloud Distributions, ed. F. Combes & F. Casoli, 235
- Solomon et al. (1997) Solomon, P. M., Downes, D., Radford, S. J. E., & Barrett, J. W. 1997, ApJ, 478, 144
- Solomon & Vanden Bout (2005) Solomon, P. M. & Vanden Bout, P. A. 2005, ARA&A, 43, 677
- Spergel & et al. (2007) Spergel, D. N. & et al. 2007, ApJS, 170, 377
- Steidel et al. (2000) Steidel, C. C., Adelberger, K. L., Shapley, A. E., et al. 2000, ApJ, 532, 170
- Tacconi et al. (2006) Tacconi, L. J., Neri, R., Chapman, S. C., et al. 2006, ApJ, 640, 228
- Taniguchi & et al. (2005) Taniguchi, Y. & et al. 2005, PASJ, 57, 165
- Taniguchi & Shioya (2000) Taniguchi, Y. & Shioya, Y. 2000, ApJ, 532, L13
- Vallini et al. (2012) Vallini, L., Dayal, P., & Ferrara, A. 2012, MNRAS, 2445
- Wagg et al. (2009) Wagg, J., Kanekar, N., & Carilli, C. L. 2009, ApJ, 697, L33
- Walteret al. (2003) Walter, F. et al. 2003, Nature, 424, 406
- Wang et al. (2010) Wang, R., Carilli, C. L., Neri, R., et al. 2010, ApJ, 714, 699
- Wang et al. (2011) Wang, R., Wagg, J., Carilli, C. L., et al. 2011, ApJ, 739, L34
- Yang et al. (2012) Yang, Y., Decarli, R., Dannerbauer, H., et al. 2012, ApJ, 744, 178