On the sizes of Damped Ly Absorbing Galaxies††thanks: Based on observations made with the Nordic Optical Telescope, operated on the island of La Palma jointly by Denmark, Finland, Iceland, Norway, and Sweden, in the Spanish Observatorio del Roque de los Muchachos of the Instituto de Astrofisica de Canarias. Based on observations collected at the European Organisation for Astronomical Research in the Southern Hemisphere, Chile under programs 084.A-0303(A) and 086.A-0074(A).
Abstract
Recently, the number of detected galaxy counterparts of Damped Lyman- Absorbers in QSO spectra has increased substantially so that we today have a sample of 10 detections. Møller et al. in 2004 made the prediction, based on a hint of a luminosity-metallicity relation for DLAs, that \textH i size should increase with increasing metallicity. In this paper we investigate the distribution of impact parameter and metallicity that would result from the correlation between galaxy size and metallicity. We compare our observations with simulated data sets given the relation of size and metallicity. The observed sample presented here supports the metallicity-size prediction: The present sample of DLA galaxies is consistent with the model distribution. Our data also show a strong relation between impact parameter and column density of \textH i. We furthermore compare the observations with several numerical simulations and demonstrate that the observations support a scenario where the relation between size and metallicity is driven by feedback mechanisms controlling the star-formation efficiency and outflow of enriched gas.
keywords:
galaxies: formation – galaxies: high-redshift – galaxies: ISM – quasars: absorption lines – quasars: individual: SDSS J 091826.16163609.0, SDSS J 033854.77000521.0, PKS045802 – cosmology: observations1 Introduction
The size of high redshift galaxies, its correlation with other properties like mass or luminosity, and its evolution with redshift is a fundamental quantity to measure (e.g., Rees & Ostriker, 1977). QSO absorption-line studies provide an interesting way to address these relations as the method is sensitive to galaxies over a large range of masses and sizes (e.g., Nagamine et al., 2007; Pontzen et al., 2008; Cen, 2010) and because it is complementary to the information gathered from studying the stellar light of galaxies (e.g., Ferguson et al., 2004).
Damped Lyman- Absorbers (DLAs) are believed to be the absorption signature of neutral interstellar gas in galaxies (see Wolfe et al. (2005) for a review). When the first sample of DLAs was collected it was found that the total cross-section for DLA absorption was about five times higher than what would be expected from the density and sizes of local spiral galaxies (Wolfe et al., 1986, see also Møller & Warren 1998). Wolfe et al. (1986) and also Smith et al. (1986) put forward the view that DLAs could be forming disks with radii times larger than local spirals. In this view galaxies were larger in the past, which would be at odds with the prevailing hierarchical model of galaxy formation. On the other hand, Tyson (1988) argued that DLAs could be caused by a population of many small (much smaller than local spirals), gas-rich dwarf galaxies (see also Haehnelt et al., 1998; Ledoux et al., 1998).
Detecting the absorbing galaxies in emission is the most obvious way to determine the sizes of DLAs from the distribution of impact parameters relative to the background QSOs. Another method is to measure the extent of 21 cm or X-ray absorption against extended background sources (Briggs et al., 1989; Dijkstra et al., 2005), but such extended background sources are currently rare. Also, information on sizes can be inferred from DLAs towards lensed QSOs (Smette et al., 1995; Ellison et al., 2004, 2007; Cooke et al., 2010), but such systems are also rare. Given the proximity of the bright QSO to the line of sight to the absorbing galaxy the first approach adopted was to search for Ly emission from the absorbing galaxy as the DLA itself here removes the light from the background QSO (Foltz et al., 1986). Two observing strategies were adopted reflecting two different ideas about the nature of DLAs. Under the assumption that the \textH i-extent of DLA galaxies is small their impact parameters relative to the QSO will also be small. Therefore a long-slit centered on the QSO should have a high probability of also covering the DLA (e.g. Hunstead et al., 1990, and references therein). If on the other hand, DLAs arise from large \textH i disks they may have large impact parameters relative to the QSO and narrow-band imaging will be a better approach as it eliminates the risk of missing the object on the slit (Smith et al., 1986; Møller & Warren, 1993). Later, spectroscopy using integral field units has also been attempted (Christensen et al., 2007; Péroux et al., 2011; Bouché et al., 2012).
In the period 1986–2010 only two galaxy counterparts of bona-fide intervening DLAs at (, and ) were detected (see Møller et al., 2004) despite many more systems were observed. This meager detection rate has gradually been understood to reflect the fact that DLA galaxies, due to their cross-section selection, trace the faint end of the galaxy luminosity function (Fynbo et al., 2008, and references therein). Møller et al. (2004) and Ledoux et al. (2006) found tentative evidence that DLA galaxies obey a metallicity-luminosity relation similar to local galaxies and suggested that a survey specifically targeting high metallicity DLAs should lead to a higher success-rate in searches for galaxy counterparts. Indeed, this strategy has more than doubled the number of detections of DLA galaxy counterparts in the literature in the last two years (Fynbo et al., 2010, 2011).
The objective of this work is to test the correlation between metallicity and physical size of DLA galaxies predicted by Møller et al. (2004). Thanks to the recent increase in number of detections of emission from DLAs we can now analyze how the distribution of impact parameters and their corresponding metallicities match up with the expected distribution from the model of Fynbo et al. (2008), based on the assumption of the previously mentioned correlation.
2 Observations and Sample selection
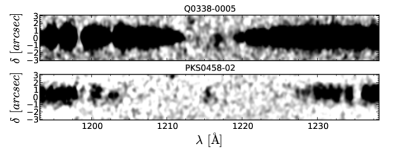
Q 03380005 was observed on November 9 2010 with the X-shooter spectrograph mounted on UT2 of ESOs Very Large Telescope following the same strategy as that described in Fynbo et al. (2010) and Fynbo et al. (2011), i.e. securing 1 hr of integration at three position angles and 60o. For details on the reduction we refer to the description in Fynbo et al. (2010) and Fynbo et al. (2011).
We detect the galaxy counterpart of the DLA in the trough of the damped Ly line in all three spectra (PAs of 0o, ). The lower panel of fig. 1 shows the stacked 2D spectrum around Ly where the Ly emission line can be seen in the bottom of the DLA trough. Using the triangulation described in Møller et al. (2004) and Fynbo et al. (2010) we infer an impact parameter of 0.490.12 arcsec. The metallicity is determined to be [M/H] based on low-ionization absorption lines from \textSi ii in a high resolution UVES spectrum of the QSO (Ledoux, private communication) and on the damped Ly line from which we measure .
The target PKS045802 was observed on November 24 2009 with X-shooter. The slit was placed at a position angle of 60.4o EofN with the purpose of measuring the precise impact parameter of the DLA galaxy. In the X-shooter spectrum (shown in the top panel of fig. 1) we measure an impact parameter of 0.310.04 arcsec. We have combined the data from Møller et al. (2004) with our new measurement of the impact parameter.
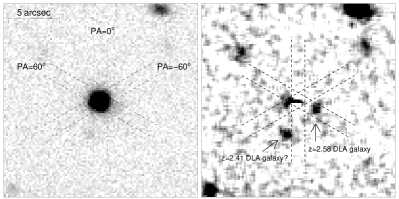
The galaxy counterpart of the DLA towards Q 09181636, reported in Fynbo et al. (2011), has here been observed in a ground based imaging study using Point Spread Function (PSF) subtraction to secure a more precise measure of the impact parameter. The field was observed with the Nordic Optical Telescope (NOT) using the ALFOSC instrument in service mode. The target was observed in the R-band over the nights March 27, 29 and April 9 2011, giving a total of 16 380 sec exposure. The images were reduced and combined using standard methods for CCD imaging data.
The field around Q09181636 is shown in the left panel of Fig. 2. The figure shows a 2020 arcsec2 region from the combined NOT image. In the right panel we show the field after PSF-subtraction and smoothing with a 33 pixel box-car filter. Two sources, both with -band magnitudes of approximately 25, are detected at impact parameters of 2.0 arcsec and 3.5 arcsec. Closer to the position of the QSO there are residuals from the PSF subtraction. With dashed lines we show the positions of the three X-shooter slit positions used by Fynbo et al. (2011). As seen, the continuum source at 2.0 arcsec seen in Fig. 2 coincides both in position angle and impact parameter with the emission line source detected in the X-shooter spectrum and must hence be the continuum counterpart of the DLA galaxy. The source at 3.5 arcsec falls outside of the X-shooter slits and it is on the basis of the data in hand not possible to establish if this source may be related to the DLA also detected in the spectrum of Q09181636 (Fynbo et al., 2011).
2.1 Sample selection
In this paper we base our analysis on data combined from the literature along with our new data for three systems of DLA galaxies; Q03380035, Q09181636 and PKS045802. In addition to the systems in the literature we include a confirmed candidate from an expanded sample based on the methods in Christensen et al. (2007) that has been confirmed by long-slit spectroscopy (Christensen et al., in preparation). We note, however, that no other candidates from that work has been confirmed. Bunker et al. in preparation also have a detection of Ly emission from a DLA galaxy using long-slit spectroscopy (Weatherley et al., 2005, their table 1). The redshift, metallicity and impact parameter of the systems used in our analysis are shown in Table 1. The DLA towards PKS0528250 has been shown to be unrelated to the nearby QSO and hence likely is similar to intervening DLAs (Møller & Warren, 1993, 1998).
3 The metallicity-size correlation
| QSO | log | [M/H] | ||
|---|---|---|---|---|
| (arcsec) | ||||
| Q220619(1) | 1.92 | 20.650.07 | 0.390.10 Zn | 0.990.05 |
| PKS045802(1,5) | 2.04 | 21.650.09 | 1.190.10 Zn | 0.310.04 |
| Q11350010(7) | 2.21 | 22.100.05 | 1.100.08 Zn | 0.100.01 |
| Q03380005(5,8) | 2.22 | 21.050.05 | 1.250.10 Si | 0.490.12 |
| Q224360(4) | 2.33 | 20.670.05 | 1.100.05 Zn | 2.800.20 |
| Q22220946(2) | 2.35 | 20.650.05 | 0.460.07 Zn | 0.8 0.1 |
| Q09181636(3,5) | 2.58 | 20.960.05 | 0.120.05 Zn | 2.0 0.1 |
| Q01390824(6,9) | 2.67 | 20.700.15 | 1.150.15 Si | 1.6 0.05 |
| PKS0528250(1) | 2.81 | 21.270.08 | 0.750.10 Si | 1.140.05 |
| Q095347(10,11) | 3.40 | 21.150.15 | 1.800.30 Si | 0.340.10 |
The relation between metallicity and size modeled by Fynbo et al. (2008) is based on the assumption that DLAs seen in the spectra of background QSOs are caused by galaxies comparable to low luminosity Lyman Break Galaxies. In this model the galaxies are approximated by randomly inclined disks, each one assigned a size, metallicity and metallicity gradient based on its luminosity. The different relations between the quantities listed above are all based on local observationally motivated correlations for which indications of their validity at higher redshift have been seen. The more luminous galaxies have bigger disks, higher metallicities and shallower metallicity gradients. The luminosity is then drawn from the LBG luminosity function weighted by \textH i cross section. An impact parameter is also assigned again with the luminosity dependent cross section of \textH i as weighting factor. The random sight line is then given a metallicity from the before mentioned relations connecting [M/H] to and the radial dependence of metallicity. For further details see Fynbo et al. (2008).
3.1 Testing the model
Though the sample we present here is currently the largest at hand, we still only have ten points. Therefore we need a simple statistical estimator to describe the data. We have chosen a two-parameter fit of the form: [M/H]. Since the internal scatter in the data is larger than the individual measurement errors we fit a straight line to the measured data by least-squares minimization without weights.
We then use the model described above to generate simulated data sets to which we can compare the measured data. Because the measured data points are selected in different ways we cannot simply draw ten random points from the model. In order to make a valid comparison, we choose model points around the same metallicities as the measured points.
The simulated data points have metallicity taken randomly from a gaussian distribution around each measured point using the measurement error as the width of the distribution. We then take the distribution of impact parameters from the model at the given metallicity and randomly pick an impact parameter. We do this for all ten points to simulate a complete data set 4 000 times. Every set of points is then fitted by a straight line to give the intercept, slope and scatter.
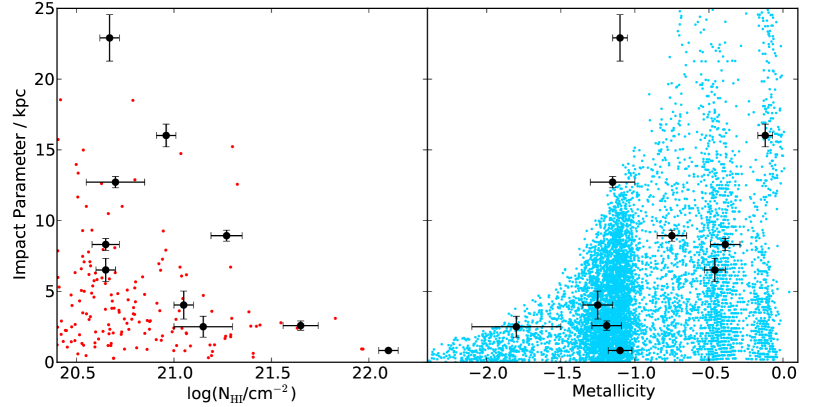
The 4 000 simulated data sets are shown in the right panel of fig. 3 as blue points along with the measured data points in black. To make the plot less crowded only every fifth simulated data set has been shown. The left panel of fig. 3 shows impact parameter vs. neutral hydrogen column density for our data in big black points. The red small points in the panel are results from Pontzen et al. (2008).
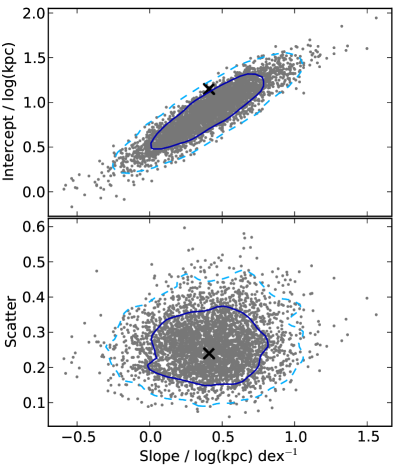
In fig. 4 we show the results of the fits to the data, both observed and simulated. The figure shows the 1 (solid) and 2 (dashed) contours of the distribution (grey points) of fitted slope and intercept and slope and scatter. The black cross in each panel point represents the best fitting values to the data: with a scatter around the fit of . The mean values of the intercept and slope from the simulated data are and , respectively, with a mean scatter of 0.27.
4 Discussion
The sample of spectroscopically confirmed DLA galaxies is now large enough to start determining statistical properties of DLA galaxies. Here we have presented a new detection, namely of the DLA galaxy counterpart of the relatively metal poor DLA towards Q 03380005 and have detected the DLA galaxy towards Q 0918+1636 in the continuum. Based on these and previous detections we have analyzed the distribution of impact parameters vs. metallicity to study the underlying correlation between size and metallicity. The results presented in fig. 4 show that our data are consistent with the model at the 1.2 level for slope vs. intercept. Our data is well within the 1-contour in slope vs. scatter. The agreement is also seen in the distribution shown in the right panel of fig. 3. There is, however, a single data point which is significantly outside the model distribution (see fig. 3: right panel, top part). This can be explained as a result of the simplicity of the model. The correlations that go into the model all have internal scatter. Including this scatter will result in a larger spread in physical size, hence making the upper edge of the model distribution less tight, and thereby including the outlying point.
An important point to note is that four of the data points have specifically been chosen to have high metallicity (Fynbo et al., 2010, 2011). When comparing the observations with the model it is therefore important to remember that the observed sample is biased towards high-metallicity DLA galaxies that in our model are expected at the largest impact parameters. At the same time we may be loosing points at the high-metallicity end because of dust bias (e.g., Pei et al., 1999; Khare et al., 2011) and due to the fact that our method using three long-slits is less sensitive to high impact parameter DLAs, see Fynbo et al. (2010) for a detailed description of the method. Nevertheless, the data on high-luminosity DLAs are consistent with the picture in which gas at large impact parameters of tens of kpc cause DLA absorption. These galaxies seem to follow relations between size, luminosity and metallicity comparable to the relations we see for disk galaxies in the local universe.
From hydrodynamic simulations it has also been investigated in which kind of systems DLAs originate (e.g., Cen, 2010; Pontzen et al., 2008; Razoumov et al., 2006; Gardner et al., 2001). In the simulation by Cen (2010) DLAs at are dominated by low metallicity systems at large impact parameters, typically kpc. In this simulation the contribution from gaseous disks to the DLA incidences is very small. Instead most DLAs arise in filamentary gas. The impact parameters at low metallicity from Cen (2010) are much larger than what we observe. The only metal poor DLA is found at an impact parameter of 2.5 kpc, hence not supporting the model by Cen (2010). Razoumov et al. (2006) also find a large number of DLAs at high impact parameter from filamentary gas around large structures. But they find that the importance of these filamentary DLAs decreases as they increase the resolution.
Pontzen et al. (2008) are able to reproduce the properties of DLAs well with their simulation, which contains very detailed feedback mechanisms. From their simulation they see positive correlations between the DLA cross-section and the mass of the halo containing the DLA and between the metallicity and the halo mass (see their fig. 4 and fig. 18). From the correlation between and it is possible to infer a limit on the impact parameters of the corresponding DLAs by assuming a spherical gas disk with a radius given by: . The largest possible cross-section found in the most massive haloes is . Hence, the impact parameters for DLAs around in their simulation are expected to be . The correlation of [M/H] and halo mass suggests that the metal poor systems are to be found in smaller haloes and therefore at smaller impact parameters. The opposite is true for metal rich DLAs. This agrees well with the data presented here in Fig. 3.
We see a fairly strong anti-correlation between log() and impact parameter (Spearman rank = ), see left panel in fig. 3. A similar trend is seen in studies by Møller & Warren (1998); Monier et al. (2009) and by Péroux et al. (2011), however, we find a tighter and steeper correlation in our data. Gardner et al. (2001) also find a clear anti-correlation between impact parameter and log(NHI) in their simulation of DLAs in different cosmologies, including CDM. They too find a shallower relation for DLAs at . This is most probably a result of the very simplified algorithms to handle cooling and feedback in their simulation. Pontzen et al. (2008) find a clear relation between log(NHI) and (red points of fig. 3) that coincides very well with our observed distribution as seen in the left panel of fig. 3. The good agreement between data and the simulation of Pontzen et al. (2008) indicates that the feedback mechanisms in their simulation that control star formation and outflow of enriched gas are responsible for the correlation between size and metallicity.
In conclusion, our analysis shows that our model well predicts the statistical properties of the observed sample without adjustment of any parameters, and as such provides strong support for the underlying size-metallicity relation. The nature of the metal poor population of DLA galaxies is, however, still unknown, as these DLA counterparts are much more difficult to observe.
Furthermore, this sample of spectroscopically confirmed DLA galaxies serves as constraints for future simulations that include modeling of DLAs.
Acknowledgments
The Dark Cosmology Centre is funded by the DNRF. JPUF acknowledges support form the ERC-StG grant EGGS-278202. We also thank Andrew Pontzen for constructive discussion and Andrew Bunker for sharing his data analysis with us.
References
- Bouché et al. (2012) Bouché, N., Murphy, M. T., Péroux, C., et al., 2012, MNRAS, 419, 2
- Briggs et al. (1989) Briggs, F. H., Wolfe, A. M., Liszt, H. S., Davis, M. M., & Turner, K. L., 1989, ApJ, 341, 650
- Cen (2010) Cen, R., 2010, ArXiv e-prints, 1010.5014
- Christensen et al. (2007) Christensen, L., Wisotzki, L., Roth, M. M., Sánchez, S. F., Kelz, A., & Jahnke, K., 2007, A&A, 468, 587
- Cooke et al. (2010) Cooke, R., Pettini, M., Steidel, C. C., King, L. J., Rudie, G. C., & Rakic, O., 2010, MNRAS, 409, 679
- Dijkstra et al. (2005) Dijkstra, M., Haiman, Z., & Scharf, C., 2005, ApJ, 624, 85
- Ellison et al. (2007) Ellison, S. L., Hennawi, J. F., Martin, C. L., & Sommer-Larsen, J., 2007, MNRAS, 378, 801
- Ellison et al. (2004) Ellison, S. L., Ibata, R., Pettini, M., Lewis, G. F., Aracil, B., Petitjean, P., & Srianand, R., 2004, A&A, 414, 79
- Ferguson et al. (2004) Ferguson, H. C., Dickinson, M., Giavalisco, M., et al., 2004, ApJ, 600, L107
- Foltz et al. (1986) Foltz, C. B., Chaffee, Jr., F. H., & Weymann, R. J., 1986, AJ, 92, 247
- Fynbo et al. (2010) Fynbo, J. P. U., Laursen, P., Ledoux, C., et al., 2010, MNRAS, 408, 2128
- Fynbo et al. (2011) Fynbo, J. P. U., Ledoux, C., Noterdaeme, P., et al., 2011, MNRAS, 413, 2481
- Fynbo et al. (2008) Fynbo, J. P. U., Prochaska, J. X., Sommer-Larsen, J., Dessauges-Zavadsky, M., & Møller, P., 2008, ApJ, 683, 321
- Gardner et al. (2001) Gardner, J. P., Katz, N., Hernquist, L., & Weinberg, D. H., 2001, ApJ, 559, 131
- Haehnelt et al. (1998) Haehnelt, M. G., Steinmetz, M., & Rauch, M., 1998, ApJ, 495, 647
- Hunstead et al. (1990) Hunstead, R. W., Pettini, M., & Fletcher, A. B., 1990, ApJ, 356, 23
- Khare et al. (2011) Khare, P., vanden Berk, D., York, D. G., Lundgren, B., & Kulkarni, V. P., 2011, MNRAS, 1668
- Ledoux et al. (1998) Ledoux, C., Petitjean, P., Bergeron, J., Wampler, E. J., & Srianand, R., 1998, A&A, 337, 51
- Ledoux et al. (2006) Ledoux, C., Petitjean, P., Fynbo, J. P. U., Møller, P., & Srianand, R., 2006, A&A, 457, 71
- Møller & Warren (1998) Møller, P. & Warren, S. J., 1998, MNRAS, 299, 661
- Møller et al. (2004) Møller, P., Fynbo, J. P. U., & Fall, S. M., 2004, A&A, 422, L33
- Møller & Warren (1993) Møller, P. & Warren, S. J., 1993, A&A, 270, 43
- Monier et al. (2009) Monier, E. M., Turnshek, D. A., & Rao, S., 2009, MNRAS, 397, 943
- Nagamine et al. (2007) Nagamine, K., Wolfe, A. M., Hernquist, L., & Springel, V., 2007, ApJ, 660, 945
- Noterdaeme et al. (2012) Noterdaeme, P., Laursen, P., Petitjean, P., et al., 2012, ArXiv e-prints
- Pei et al. (1999) Pei, Y. C., Fall, S. M., & Hauser, M. G., 1999, ApJ, 522, 604
- Péroux et al. (2011) Péroux, C., Bouché, N., Kulkarni, V. P., York, D. G., & Vladilo, G., 2011, MNRAS, 410, 2237
- Pontzen et al. (2008) Pontzen, A., Governato, F., Pettini, M., et al., 2008, MNRAS, 390, 1349
- Prochaska et al. (2003) Prochaska, J. X., Gawiser, E., Wolfe, A. M., Cooke, J., & Gelino, D., 2003, ApJS, 147, 227
- Razoumov et al. (2006) Razoumov, A. O., Norman, M. L., Prochaska, J. X., & Wolfe, A. M., 2006, ApJ, 645, 55
- Rees & Ostriker (1977) Rees, M. J. & Ostriker, J. P., 1977, MNRAS, 179, 541
- Smette et al. (1995) Smette, A., Robertson, J. G., Shaver, P. A., Reimers, D., Wisotzki, L., & Koehler, T., 1995, A&AS, 113, 199
- Smith et al. (1986) Smith, H. E., Cohen, R. D., & Bradley, S. E., 1986, ApJ, 310, 583
- Tyson (1988) Tyson, N. D., 1988, ApJ, 329, L57
- Weatherley et al. (2005) Weatherley, S. J., Warren, S. J., Møller, P., Fall, S. M., Fynbo, J. U., & Croom, S. M., 2005, MNRAS, 358, 985
- Wolfe et al. (2005) Wolfe, A. M., Gawiser, E., & Prochaska, J. X., 2005, ARA&A, 43, 861
- Wolfe et al. (2008) Wolfe, A. M., Prochaska, J. X., Jorgenson, R. A., & Rafelski, M., 2008, ApJ, 681, 881
- Wolfe et al. (1986) Wolfe, A. M., Turnshek, D. A., Smith, H. E., & Cohen, R. D., 1986, ApJS, 61, 249