Influence of major mergers on the radio emission of elliptical galaxies
Abstract
Aims. We investigate the influence of major mergers on the radio emission of elliptical galaxies.
Methods. We use a complete sample of close pairs, which contains 475 merging and 1828 non-merging paired elliptical galaxies of -21.5 selected from the Sloan Digital Sky Survey. In addition, a control sample of 2000 isolated field galaxies is used for comparison. We cross-identify the optical galaxies with the radio surveys of FIRST and NVSS.
Results. We find that the radio fraction of merging paired galaxies is about 6%, which is slightly higher than the 5% obtained for non-merging paired galaxies, although these values are consistent with each other owing to the large uncertainty caused by the limited sample. The radio fraction is twice as that of isolated galaxies, which is less than 3%.
Conclusions. Radio emission of elliptical galaxies is only slightly affected by major mergers, but predominantly depends on their optical luminosities. Therefore, merging is not important in triggering the radio emission of elliptical galaxies.
Key Words.:
galaxies: interactions — radio continuum:galaxies:1 Introduction
The interactions of galaxies and merging processes are very common in the universe, and they affect the properties of galaxies, for instance their morphology (White & Rees 1978), star formation (Sanders et al. 1988; Barton et al. 2000; Lambas et al. 2003; Robaina et al. 2009), and the activity of their nuclei (Keel et al. 1985; Schawinski et al. 2007; Jogee et al. 2008).
Previously, there have been a number of investigations of the radio emission related to interactions and the merging process. Stocke (1978) found that both spiral and elliptical galaxies in close pairs are more likely to be radio sources, twice as that of the widely separated galaxies. For star-forming galaxies, radio emission is enhanced by star formation triggered by galaxy interactions (Hummel 1981; Condon et al. 1982; Altschuler & Pantoja 1984; Heckman 1983a; Giuricin et al. 1990). Radio galaxies with strong optical emission lines tend to have interaction features in optical images, which are probably produced by the merging of gas-rich galaxies (Heckman et al. 1986; McCarthy et al. 1987; González Delgado et al. 2006; Tadhunter et al. 2011; Ramos Almeida et al. 2011). Wilkinson et al. (1987) and Tal et al. (2009) showed that interactions play only a minor role on the nuclear activity of elliptical galaxies. The radio detection rates of elliptical galaxies is found to be directly related to the optical luminosity (Calvani et al. 1989), rather than other properties of galaxies, such as ellipticity and shape of isophotes (Govoni et al. 2000).
Previous investigations of the radio emission caused by physical interactions or mergers of gas-poor elliptical galaxies were affected by the small size of samples and the difficulty in the merger identification. Only visual pairs, which may or may not be mergers, were used in all kinds of studies. The merging galaxies clearly host stronger interactions than the non-merging ones. The interaction features of elliptical galaxies are very weak and far more difficult to identify than those of spiral galaxies. In this paper, we verify whether any enhancement in radio emission is caused by the major dry mergers of elliptical galaxies using a large volume-limited complete sample of pairs that was identified in the Sloan Digital Sky Survey data release 6 (SDSS DR6).
2 Radio identification of elliptical galaxies
2.1 Samples of elliptical galaxies
On the basis of the SDSS DR6, Wen et al. (2009) obtained a large volume-complete sample of 1209 pairs of luminous elliptical galaxies by applying the following criteria:
1. Each galaxy has an extinction-corrected Petrosian magnitude of and a rest-frame absolute magnitude of .
2. Rest-frame colors of galaxies satisfy and .
3. Close pairs have a projected separation of 7 kpc 50 kpc and a redshift of .
Wen et al. (2009) fitted each pair of galaxies with a smooth surface-brightness profile. Residual images of close pairs were obtained by subtracting the smoothed profiles from the original observational images. Interaction features (e.g., tails, bridges and plumes) in these pairs were identified based on an image analysis. Galaxies in 249 close pairs which display distinct interaction features in the residual images are classified as merging galaxies. Galaxies in 960 close pairs which do not have distinct interaction features are classified as non-merging ones. In this work, we only consider the paired galaxies with a fitting magnitude of , which corresponds to 475 merging galaxies and 1828 non-merging galaxies.
To access the influence of interactions on the radio emission of elliptical galaxies, we define a control sample of 2000 isolated field elliptical galaxies, by selecting these galaxies without bright nearby companions within a radius of 500 kpc and a velocity of 700 km s-1. This sample of isolated galaxies has similar distributions of color, luminosity, and redshift as those of the paired galaxies.
2.2 Radio emission from ellipticals
As done by Best et al. (2005a), we verify our detection of radio emission from those merging, non-merging, and isolated elliptical galaxies using the data from the FIRST and NVSS surveys. The FIRST survey was carried out at a wavelength of 20 cm, which covers 9900 deg2 of the northern sky (Becker et al. 1995) and overlaps with most of the sky area of the SDSS DR6. The FIRST survey has a resolution of 5 arcsec and a flux density limit of 1 mJy for point sources. Radio galaxies often have widely separated double lobes or many resolved components. The FIRST survey was often able to resolve galaxies into several components because of its high resolution, so that the source flux usually refers to that of each component. To get the total flux of a radio source, we supplementarily use the data from the NVSS survey, which has a lower resolution of 45 arcsec at 1.4 GHz and covers the entire northern sky of declination 40 (Condon et al. 1998). The NVSS data is complete to a flux limit of 2.5 mJy for point sources. Not all the close pairs identified from the SDSS DR6 are located at the sky area of the FIRST survey. Forty-five pairs are outside the FIRST survey area but within the NVSS region. All isolated galaxies are selected from the common area of the FIRST and NVSS surveys.
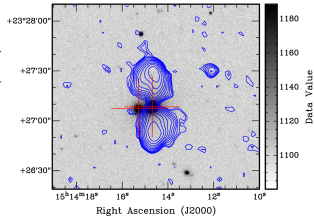
We superimpose the NVSS contour maps on the SDSS images of pairs. We identify the radio emission from galaxies based on positional coincidence. Owing to the low resolution of NVSS, radio sources within 10 arcsec of the SDSS paired galaxies are considered good matches. Galaxies usually have radio jets or lobes that extend to hundreds of kpc. Some have weak radio emission at the optical position. Visual inspection of the superimposed optical and radio images enables us to readily identify a counterpart galaxy even if jet-like sources are outside the optical image. We also superimpose the FIRST contour maps on the SDSS images. The FIRST sources within 2 arcsec of the SDSS galaxies are considered as radio detections. Figure 1 shows an example of radio lobes originating from a galaxy by visual inspection. The same procedures are applied to 2000 isolated field galaxies.
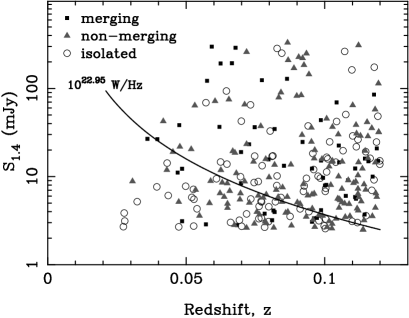


To be able to access most effectively the radio emission properties of merging or non-merging galaxies, we should set a radio power cutoff rather than use the flux limit of the radio surveys. Because the close pairs are a volume-limited complete sample at . The radio power of an elliptical galaxy is calculated to be , where refers to NVSS radio flux in 1.4 GHz and is luminosity distance from the galaxy. The radio power cutoff is set to be W Hz-1, above which radio sources of for the volume-limited complete sample have a flux limit of 2.5 mJy. If we consider the radio sources with a flux limit of 5 mJy, the sample is complete for the radio sources of W Hz-1. Figure 2 shows the radio flux against redshift for galaxies, with a flux limit of 2.5 mJy.
Figure 3 shows the radio power and the ratio of radio power to optical luminosity (i.e., radio-to-luminosity ratio) against the optical luminosity for the three samples. The radio emission tends to be stronger for galaxies with higher optical luminosities, which is very consistent with the conclusions obtained by Calvani et al. (1989) and Best et al. (2005b). The radio emission of galaxies have two morphology types, compact sources, and jet-like sources. Galaxies with jet-like radio emission tend to have a stronger radio power than those with compact radio sources.
2.3 Fraction of radio detections and interactions
The fraction of radio detections is defined as the number of galaxies with radio emission above a threshold divided by the total number of galaxies in the sample. If we take a radio power of W Hz-1 as the threshold, we get 154 radio detections of galaxies in close pairs, of which 42 are merging galaxies and 112 are non-merging galaxies. Similarly, we find 59 radio detections out of 2000 isolated field elliptical galaxies. The fractions of radio detections are 8.8%1.4% for the merging galaxies, 6.1%0.6% for the non-merging galaxies, and 3.0%0.4% for the isolated galaxies. If we take the threshold of W Hz-1, the fractions become 7.4%1.2%, 4.2%0.5%, and 2.3%0.3% for the three samples, respectively.
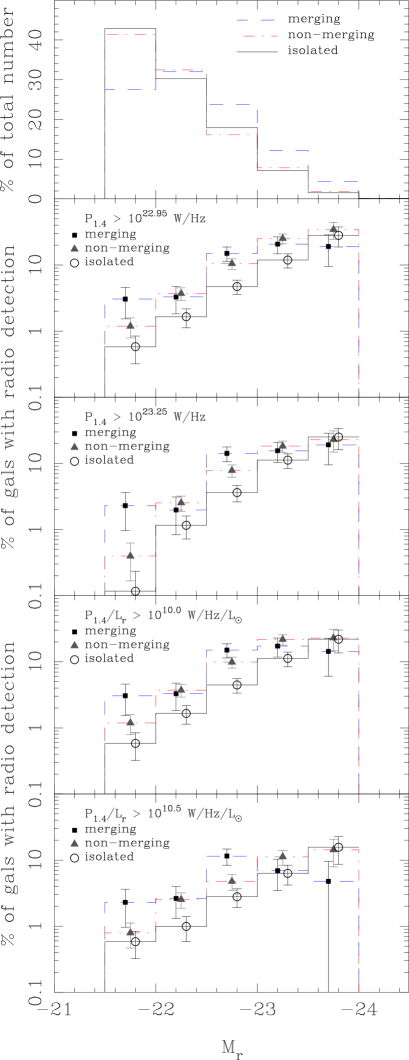
Figure 4 shows the dependence of the fraction of radio detections on optical absolute magnitude for both radio power thresholds (the second and third panels). More luminous galaxies are clearly more likely to be radio sources for all three samples. Owing to the dependence on luminosity, i.e., absolute magnitude, we should be very careful to compare the radio fractions of these samples with different absolute magnitude distributions (see the top panel of Figure 4). To minimize the luminosity effect, we calculate the fractions (or the numbers) of radio detections within five absolute magnitude bins. We then normalize the percentage of total galaxy number within each absolute magnitude bin for merging and non-merging galaxies to ensure that they are the same as that of isolated galaxies (solid line of Figure 4) by multiplying by a factor. Both the total numbers of galaxies and radio detections within each absolute magnitude bin are then multiplied by the factor. Finally, all these numbers are added together within the absolute magnitude range of to give the normalized total numbers of galaxies and radio detections. We finally get the normalized fraction for the three samples for comparison. As listed in Table 1, the radio fraction of merging galaxies is about 6%, which is slightly higher than the value of about 5% for non-merging galaxies, but not significantly so owing to the error bars. These values are twice as large as that of isolated galaxies, which is less than 3%.
It is necessary to test whether the above results depend on the definition of the radio detection threshold. Best et al. (2005b) suggests that the radio-to-luminosity ratio is a more appropriate definition of radio detection. As shown in Figure 4 (the fourth and fifth panels), the fractions of radio detections also strongly depend on absolute magnitude when the radio detection is defined in terms of the radio-to-luminosity ratio. Again, after normalizing the distribution of absolute magnitude, we get the fraction of radio detections for three samples by applying the thresholds of the radio-to-luminosity ratio, as listed in Table 1. The fraction of merging galaxies is 1% higher than but still consistent with that of non-merging galaxies. The fraction of radio detections of merging or non-merging galaxies is almost double that of isolated galaxies, but just with a significance of .
| Threshold of | Radio fraction (%) | ||
|---|---|---|---|
| radio detection | Merging | Non-merging | Isolated |
| W/Hz | 6.81.5 | 5.80.6 | 2.90.4 |
| W/Hz | 5.51.3 | 4.00.5 | 2.30.3 |
| W/Hz/L⊙ | 6.51.5 | 5.30.5 | 2.70.4 |
| W/Hz/L⊙ | 4.41.2 | 3.00.4 | 1.80.3 |
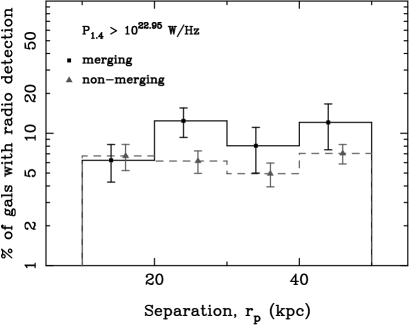
Our results suggest that the radio emission of elliptical galaxies is slightly affected by galaxy interactions. The radio emission predominantly depends on galaxy luminosity. This conclusion is consistent with previous investigations (Auriemma et al. 1977; Hummel et al. 1983; Heckman 1983b; Feretti et al. 1984; Wilkinson et al. 1987; Calvani et al. 1989; Tal et al. 2009; Brown et al. 2011). We also check whether the radio detection depends on the separation of close pairs. As shown in Figure 5, there is no significant dependence of radio fraction of paired galaxies on separation. The merging ellipticals are slightly more likely to be radio sources than non-merging ellipticals for all separations, but the uncertainties are large owing to the small number of merging galaxies.
3 Conclusions
We have compared the radio emission of 475 merging galaxies and 1828 non-merging galaxies in close pairs and a sample of 2000 isolated field galaxies. A cross-identification of these galaxies with the FIRST and NVSS radio data shows that 154 galaxies have radio detections, of which 42 are merging galaxies, 112 are non-merging galaxies. In addition, 59 isolated galaxies have radio detections. The fraction of radio detections depends strongly on optical luminosity. The fraction of radio detections of merging galaxies is about 6%, which is about 1% higher than that of non-merging galaxies and twice as that of isolated galaxies. Our results indicate that merging is not important in triggering the radio emission of elliptical galaxies. This is consistent with the conclusions of Schawinski et al. (2011) and Kocevski et al. (2012).
Acknowledgements.
We thank the referee for valuable comments that helped to improve the paper. We are grateful to Jun Xu, Wei Cai, and Dr. YuanJie Du for helps. The authors are supported by the National Natural Science Foundation of China (10833003 and 11103032).References
- Altschuler & Pantoja (1984) Altschuler, D. R. & Pantoja, C. A. 1984, AJ, 89, 1531
- Auriemma et al. (1977) Auriemma, C., Perola, G. C., Ekers, R. D., et al. 1977, A&A, 57, 41
- Barton et al. (2000) Barton, E. J., Geller, M. J., & Kenyon, S. J. 2000, ApJ, 530, 660
- Becker et al. (1995) Becker, R. H., White, R. L., & Helfand, D. J. 1995, ApJ, 450, 559
- Best et al. (2005a) Best, P. N., Kauffmann, G., Heckman, T. M., et al. 2005a, MNRAS, 362, 9
- Best et al. (2005b) Best, P. N., Kauffmann, G., Heckman, T. M., et al. 2005b, MNRAS, 362, 25
- Brown et al. (2011) Brown, M. J. I., Jannuzi, B. T., Floyd, D. J. E., et al. 2011, ApJ, 731, L41
- Calvani et al. (1989) Calvani, M., Fasano, G., & Franceschini, A. 1989, AJ, 97, 1319
- Condon et al. (1982) Condon, J. J., Condon, M. A., Gisler, G., et al. 1982, ApJ, 252, 102
- Condon et al. (1998) Condon, J. J., Cotton, W. D., Greisen, E. W., et al. 1998, AJ, 115, 1693
- Feretti et al. (1984) Feretti, L., Giovannini, G., Gregorini, L., et al. 1984, A&A, 139, 55
- Giuricin et al. (1990) Giuricin, G., Bertotti, G., Mardirossian, F., et al. 1990, MNRAS, 247, 444
- González Delgado et al. (2006) González Delgado, R. M., Tadhunter, C. N., Pérez, E., et al. 2006, Astronomische Nachrichten, 327, 159
- Govoni et al. (2000) Govoni, F., Falomo, R., Fasano, G., et al. 2000, A&A, 353, 507
- Heckman (1983a) Heckman, T. M. 1983a, ApJ, 268, 628
- Heckman (1983b) —. 1983b, ApJ, 273, 505
- Heckman et al. (1986) Heckman, T. M., Smith, E. P., Baum, S. A., et al. 1986, ApJ, 311, 526
- Hummel (1981) Hummel, E. 1981, A&A, 93, 93
- Hummel et al. (1983) Hummel, E., Kotanyi, C. G., & Ekers, R. D. 1983, A&A, 127, 205
- Jogee et al. (2008) Jogee, S., et al. 2008, in Astronomical Society of the Pacific Conference Series, Vol. 396, Formation and Evolution of Galaxy Disks, ed. J. G. Funes & E. M. Corsini, 337
- Keel et al. (1985) Keel, W. C., Kennicutt, Jr., R. C., Hummel, E., et al. 1985, AJ, 90, 708
- Kocevski et al. (2012) Kocevski, D. D., Faber, S. M., Mozena, M., et al. 2012, ApJ, 744, 148
- Lambas et al. (2003) Lambas, D. G., Tissera, P. B., Alonso, M. S., et al. 2003, MNRAS, 346, 1189
- McCarthy et al. (1987) McCarthy, P. J., van Breugel, W., Spinrad, H., et al. 1987, ApJ, 321, L29
- Ramos Almeida et al. (2011) Ramos Almeida, C., et al. 2011, MNRAS, 1702
- Robaina et al. (2009) Robaina, A. R., et al. 2009, ApJ, 704, 324
- Sanders et al. (1988) Sanders, D. B., Soifer, B. T., Elias, J. H., et al. 1988, ApJ, 325, 74
- Schawinski et al. (2007) Schawinski, K., Thomas, D., Sarzi, M., et al. 2007, MNRAS, 382, 1415
- Schawinski et al. (2011) Schawinski, K., Treister, E., Urry, C. M., et al. 2011, ApJ, 727, L31
- Stocke (1978) Stocke, J. T. 1978, AJ, 83, 348
- Tadhunter et al. (2011) Tadhunter, C., et al. 2011, MNRAS, 412, 960
- Tal et al. (2009) Tal, T., van Dokkum, P. G., Nelan, J., et al. 2009, AJ, 138, 1417
- Wen et al. (2009) Wen, Z. L., Liu, F. S., & Han, J. L. 2009, ApJ, 692, 511
- White & Rees (1978) White, S. D. M. & Rees, M. J. 1978, MNRAS, 183, 341
- Wilkinson et al. (1987) Wilkinson, A., Browne, I. W. A., Kotanyi, C., et al. 1987, MNRAS, 224, 895