A WISE View of a Nearby Supercluster A2199
Abstract
We use Wide-field Infrared Survey Explorer (WISE) data covering the entire region ( deg2) of the A2199 supercluster at to study the mid-infrared (MIR) properties of supercluster galaxies. We identify a ‘MIR star-forming sequence’ in the WISE color-12 m luminosity diagram, consisting of late-type, star-forming galaxies. At a fixed star formation rate (SFR), the MIR-detected galaxies at 22 m or 12 m tend to be more metal rich and to have higher surface brightness than those without MIR detection. Using these MIR-detected galaxies, we construct the IR luminosity function (LF) and investigate its environmental dependence. Both total IR (TIR) and 12 m LFs are dominated by late-type, star-forming galaxies. The contribution of active galactic nuclei (AGN)-host galaxies increases with both TIR and 12 m luminosities. The contribution of early-type galaxies to the 12 m LFs increases with decreasing luminosity. The faint-end slope of the TIR LFs does not change with environment, but the change of faint-end slope in the 12 m LFs with the environment is significant: there is a steeper faint-end slope in the cluster core than in the cluster outskirts. This steepening results primarily from the increasing contribution of early-type galaxies toward the cluster. These galaxies are passively evolving, and contain old stellar populations with weak MIR emission from the circumstellar dust around asymptotic giant branch stars.
Subject headings:
galaxies: clusters: individual (Abell 2199) – galaxies: evolution – galaxies: formation – galaxies: luminosity function, mass function – infrared: galaxies1. Introduction
Galaxy properties including morphology, star formation rate (SFR), color, and activity in galactic nuclei are strongly affected by the environment (see Blanton & Moustakas 2009 for a review). The galaxy cluster environment is special because it contains the intracluster medium (ICM), galaxies, and dark matter that affect galaxy properties gravitationally and/or hydrodynamically over several billion years. For example, the typical morphology (also SFR, color, and activity in galactic nuclei) of galaxies changes with both local density and clustercentric radius (e.g., Oemler 1974; Davis & Geller 1976; Dressler 1980; Park & Hwang 2009; Hwang et al. 2012). This environmental dependence of galaxy properties in galaxy clusters may result from a host of physical mechanisms including ram pressure (Gunn & Gott, 1972), cumulative galaxy-galaxy hydrodynamic/gravitational interactions (Park & Hwang, 2009), strangulation (Larson et al., 1980), and galaxy harassment (Moore et al., 1996) (see Boselli & Gavazzi 2006; Park & Hwang 2009 for a review).
One of the fundamental tools for understanding the physics of morphological transformation and the quenching of star formation activity (SFA) is the galaxy luminosity function (LF; Blanton et al. 2001; Benson et al. 2003; Park et al. 2007; Rines & Geller 2008; Geller et al. 2012). LFs in infrared (IR) bands can provide an unbiased view of SFA in cluster galaxies because they are insensitive to dust extinction (e.g., Gallazzi et al. 2009; Haines et al. 2011).
Since the pioneering work on IR observations of cluster galaxies with Infrared Astronomical Satellite (IRAS) and Infrared Space Observatory (ISO) (see Metcalfe et al. 2005 for a review), there have been several determinations of the IR LFs for cluster galaxies with recent IR satellites including the Spitzer Space Telescope (Werner et al., 2004), AKARI (Murakami et al., 2007), and the Herschel Space Observatory (Pilbratt et al., 2010). For example, Bai et al. (2006, 2009) use extensive Spitzer observations of local galaxy clusters including Coma and A3266 to conclude that IR LFs are well fit with the Schechter (1976) function. They suggest that the bright end of IR LFs for local rich clusters has a universal form, similar to the LFs for nearby field galaxies. Tran et al. (2009) confirmed this universal form of IR LFs in Cl1358 at ; other studies confirmed it in A2255 at (Shim et al., 2011) and in the Shapley supercluster (Haines et al., 2011).
Studies of other clusters yield surprisingly different results : there is an excess of bright IR sources in the bullet cluster at (Chung et al., 2010) and an excess of faint IR sources in the A1763 supercluster at (Biviano et al., 2011).
The environmental dependence of IR LFs remains an open question. For example, Bai et al. (2009) suggest that the cluster and field IR LFs do not seem to differ significantly from one another (see also Finn et al. 2010; Haines et al. 2011). However, Bai et al. (2006) found a hint of a steeper faint-end slope toward the outer region of the Coma cluster. Tran et al. (2009) also found an excess of bright IR sources in their LF of the super group (SG1120) at compared to that of field galaxies at similar redshift (see also Atlee & Martini 2012). Biviano et al. (2011) found that the slopes of IR LFs in three different regions in the A1763 supercluster (i.e. the cluster core, the large-scale filament, and the cluster outskirts) are similar, but the filament appears to have a flatter LF than both the outskirts and the core.
Here, we discuss the IR LFs for galaxies in the A2199 supercluster. This supercluster is one of the best targets for the study of IR LFs and their environmental dependence because the entire supercluster region ( Mpc) is uniformly covered by the Wide-field Infrared Survey Explorer (WISE; Wright et al. 2010) with excellent sensitivity at mid-IR (MIR) wavelengths. This region is also fully covered by the Sloan Digital Sky Survey (SDSS; York et al. 2000) as well as by other large spectroscopic surveys. Thus, ambiguity in determining cluster membership is vastly reduced. To understand the behavior of the LFs in the supercluster, we also explore the MIR colors of galaxies focusing on the connection to IR luminosities and their environmental dependence.
A2199 is a regular, X-ray bright, rich galaxy cluster at , and forms a supercluster with several nearby groups in the infall region including A2197W and A2197E (Rines et al., 2001). The center of the cluster is dominated by a massive cD galaxy, NGC 6166 (Kelson et al., 2002), and the cluster hosts a cooling flow (Johnstone et al., 2002).
Section 2 describes the observational data we use. We construct total IR (TIR; 81000 m) and 12 m LFs for several subsamples in §3. We discuss the results and conclude in §4 and §5, respectively. Throughout we adopt, unless explicitly mentioned otherwise, flat CDM cosmological parameters of km s-1 Mpc-1, and . One arcmin corresponds to 26.2 kpc at the redshift of A2199.
2. The Data
2.1. Galaxy Catalog
We first constructed a master catalog containing a photometric sample of galaxies with (down to the magnitude where the spectroscopic samples exist) in the SDSS data release 7 (DR7, Abazajian et al. 2009). We selected galaxies within 6.7°(10 Mpc) of the A2199 center (, ; Böhringer et al. 2000).
Spectroscopic data for galaxies with are available in the SDSS database. However, the spectroscopic completeness of the SDSS data is poor for bright galaxies with and for galaxies in high-density regions. Thus, we supplement the galaxy data to reduce the effects of incompleteness. We compiled redshifts for the photometric sample of galaxies in the master catalog from the literature (see Hwang et al. 2010 for details). We also included the data from extensive spectroscopic survey programs in the field of A2199 (Rines et al., 2002; Rines & Geller, 2008) which include galaxies fainter than the SDSS limit.
Figure 1 shows the spectroscopic completeness of the galaxy sample as a function of apparent magnitude and of clustercentric radius. The spectroscopic completeness of our sample brighter than the SDSS limit is at all magnitudes and clustercentric radii. Galaxies fainter than the SDSS limit are not completely covered by the spectroscopic observations, but there are useful data within the virial radius of A2199 (; to be defined in §2.4).

We also use several value-added galaxy catalogs (VAGCs) drawn from SDSS data. We adopt the photometric parameters from the SDSS pipeline (Stoughton et al., 2002). We take the spectroscopic parameters including SFRs (Brinchmann et al., 2004) and oxygen abundance (Tremonti et al., 2004) from the MPA/JHU DR7 VAGC111http://www.mpa-garching.mpg.de/SDSS/DR7/.
We adopt galaxy morphology data from the Korea Institute for Advanced Study (KIAS) DR7 VAGC222http://astro.kias.re.kr/vagc/dr7/ (Choi et al., 2010). In this catalog, galaxies are divided into early (ellipticals and lenticulars) and late (spirals and irregulars) morphological types based on their locations in the () color versus () color gradient space and in the -band concentration index space (Park & Choi, 2005). The resulting morphological classification has completeness and reliability reaching 90%. We performed an additional visual check of the color images of the galaxies misclassified by the automated scheme, and of the galaxies that are not included in the KIAS DR7 VAGC. In this procedure, we revised the types of blended or merging galaxies, blue but elliptical-shaped galaxies, and dusty edge-on spirals.
2.2. WISE
We use the new wide-field MIR data obtained by the WISE satellite, which covers all the sky at four MIR bands (3.4, 4.6, 12 and 22 m). The WISE all-sky source catalog333http://wise2.ipac.caltech.edu/docs/release/allsky/ contains photometric data for over 563 million objects. WISE covers the entire region of the A2199 supercluster to a homogeneous depth and detects galaxies in this supercluster down to L L⊙.
We identified WISE counterparts of the galaxies in our master catalog by cross-correlating them with the sources in the WISE All-sky data release with a matching tolerance of 3″( 0.5FWHM of the PSF at 3.4 m). We use the point source profile-fitting magnitudes, and restrict our analysis to the sources with S/N at each WISE band. WISE 5 photometric sensitivity is estimated to be better than 0.08, 0.11, 1 and 6 mJy at 3.4, 4.6, 12 and 22 m in unconfused regions on the ecliptic plane (Wright et al., 2010).
Because 22 m WISE data are closer to the peak of IR emission than other bands and because they are less affected by polycyclic aromatic hydrocarbon (PAH) emission features, we computed the TIR luminosity () from the 22 m flux density using the spectral energy distribution (SED) templates of Chary & Elbaz (2001, CE01). CE01 contains 105 SED templates with different TIR luminosities (). The templates provide () as a function of wavelength. For the observed 22 m flux density, we choose the closest template to obtain the appropriate TIR luminosity. We interpolate between the two closest templates to reach the observed 22 m flux density. TIR luminosities extrapolated from a single passband have been examined in many papers. They agree very well with those based on all far-IR (FIR) bands; the uncertainty is (e.g., Elbaz et al. 2010, 2011). Therefore, this procedure does not introduce any bias in our results. We reexamine it in §2.5.1.
2.3. Completeness
To construct IR LFs for galaxies in the supercluster (§3), it is necessary to correct for the spectroscopic and photometric incompleteness of our sample. We first compute the spectroscopic completeness of WISE -detected sources in the supercluster. At the end of this section we determine the photometric completeness. Because we are only interested in the sources in the supercluster, we compute the spectroscopic completeness for supercluster galaxies. To do that, we select tentative member galaxies from the photometric sample based on the photometric redshift (photo-), and compute the spectroscopic completeness for these galaxies.
Among several photo- measurements provided by the SDSS database, we adopt the photometric redshift data based on the Artificial Neural Network technique (Oyaizu et al., 2008). This approach gives the tightest correlation between spectroscopic and photometric redshifts for galaxies at the redshift of A2199 (see also the application to the A1763 supercluster by Biviano et al. 2011). Following Knobel et al. (2009) and Biviano et al. (2011), we determine the optimal photometric redshift range for selecting tentative member galaxies by minimizing . is the purity of the sample, defined by the ratio of the number of spectroscopically confirmed member galaxies in the optimal photometric redshift range to the number of galaxies with any spectroscopic redshifts in the optimal photometric redshift range. is the completeness of the sample, the ratio of the number of spectroscopically confirmed member galaxies in the optimal photometric redshift range to the number of spectroscopically confirmed member galaxies with any photometric redshifts. From a simple experiment adjusting the redshift range, we found the optimal photometric redshift range for tentative members : .
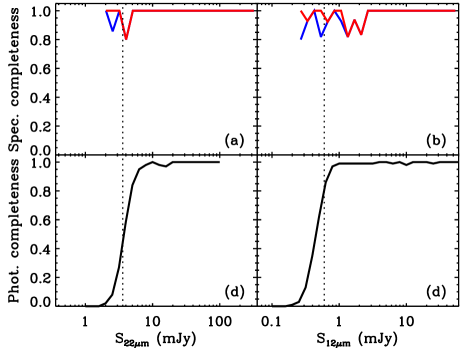
Using these photo- selected member galaxies, we compute the spectroscopic completeness for the WISE -detected sources at 22 m and 12 m, and show the results in Figure 2 (a-b). Red solid lines are based on all the spectroscopic sample of galaxies compiled in the master catalog. There are many galaxies fainter than the SDSS limit (i.e. ) only in the central region (), but not in the outer region (see Fig. 3b). To check any bias introduced by the variation in the depth of the spectroscopic catalog with clustercentric radius, we also plot the spectroscopic completeness based only on the galaxies brighter than the SDSS limit (i.e. ) as blue solid lines. Because the two curves are very similar, the LFs based on these two curves should not differ significantly (see §3).
We take the photometric completeness for WISE sources from the Explanatory Supplement to the WISE all-sky data release products, which gives completeness curves for several (, the effective number of times that point on the sky was visited by a “good” detector frame pixel444The exposure time for a single visit corresponds to 7.7 sec (3.4 and 4.6 m) and 8.8 sec (12 and 22 m).) coverage depth555http://wise2.ipac.caltech.edu/docs/release/allsky/expsup/sec6_5.html. By interpolating the curves in the Explanatory Supplement, we show the photometric completeness curves at 22 m and 12 m for the A2199 supercluster region with a coverage depth of 21 (Figure 2cd).
When we compute the IR LFs using WISE-detected galaxies, we weight each galaxy by the inverse of the photometric and spectroscopic completeness as a function of WISE flux density.
| Wavelength | Early types | Late types | ||||
|---|---|---|---|---|---|---|
| (m) | AGN | non-AGN | AGN | non-AGN | Total | |
| Spectroscopic sample of galaxies at arcmin | ||||||
| All | 334 | 4322 | 1242 | 5580 | 11478 | |
| 3.4 | 332 | 4259 | 1237 | 5381 | 11209 | |
| 4.6 | 332 | 4259 | 1231 | 5346 | 11168 | |
| 12 | 289 | 2130 | 1198 | 4741 | 8358 | |
| 22 | 118 | 271 | 892 | 2403 | 3684 | |
| Member galaxies at arcmin | ||||||
| All | 39 | 531 | 135 | 1031 | 1736 | |
| 3.4 | 39 | 522 | 135 | 948 | 1644 | |
| 4.6 | 39 | 522 | 131 | 922 | 1614 | |
| 12 | 37 | 309 | 116 | 693 | 1155 | |
| 22 | 16 | 70 | 92 | 372 | 550 | |
2.4. Supercluster Membership
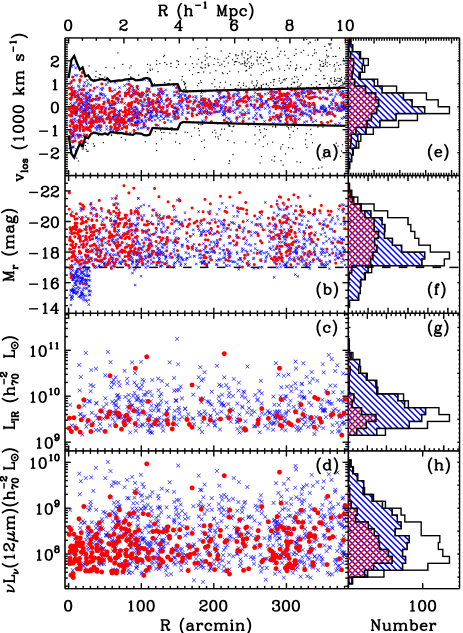
To determine the membership of galaxies in the A2199 supercluster, we used the caustic method (Diaferio & Geller, 1997; Diaferio, 1999; Serra et al., 2011). The technique locates two curves, the caustics, in the cluster redshift diagram (Figure 3a) that shows the line-of-sight velocities of galaxies as a function of distance from the center of the supercluster.
The caustics measure the escape velocity from the system of galaxies and provide a basis for measurement of the mass of the system (Rines et al., 2002). The caustics are also a useful tool for defining supercluster membership. Samples identified with the caustic technique are at least 95% complete. At most 10% of the galaxies projected within the caustics are interlopers. Most of these are well within the caustics (i.e. they are not velocity outliers) (Serra et al. 2010; 2012, in prep.).
We applied the technique to a sample of 11,478 spectroscopic redshifts in the field of the A2199 supercluster. The technique identifies 1736 members within Mpc of the supercluster center. Among these, 550 and 1155 galaxies are detected () at WISE 22 m and 12 m, respectively. The cluster center determined from this technique is consistent with the X-ray center used in this study (see Appendix A of Diaferio 1999 for more details). Table 1 summarizes the statistics for the number of galaxies in our sample.
In Figure 3, we plot several physical parameters of the member galaxies as a function of clustercentric radius and morphology. Thanks to the deep spectroscopic survey in Rines & Geller (2008), many faint galaxies with at are included as members (b). Few luminous infrared galaxies (LIRGs, L⊙) reside in this supercluster (c), consistent with expectation ( LIRGs in the supurcluster volume) from the field IR luminosity density at this epoch (Goto et al., 2011a).
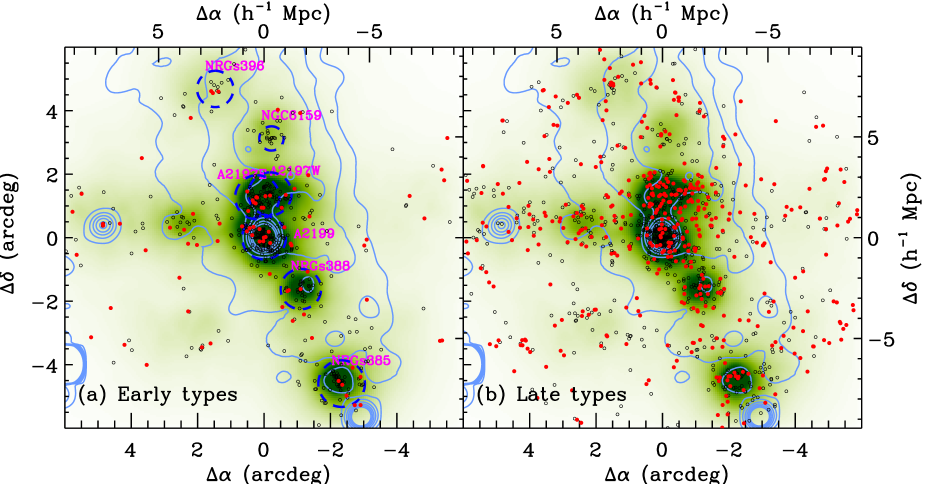
Figure 4 shows the spatial distribution of the member galaxies segregated by their morphologies. The galaxy number density map constructed using the member galaxies with mag and the X-ray intensity contours from ROSAT All-Sky Survey are overlaid.
The galaxy density peaks match several known galaxy groups with X-ray emission shown by blue dashed circles (Rines et al., 2001, 2002). The radius of the circle indicates r200 of each group (approximately the virial radius). Within this radius, the mean overdensity is 200 times the critical density of the universe . We compute r200 from the formula given by Carlberg et al. (1997):
| (1) |
where is a velocity dispersion of the cluster from Rines et al. (2002), and the Hubble parameter at is (Peebles, 1993). , , and are the dimensionless density parameters. Because the observed velocity dispersions of the groups in the infall region could be increased by the supercluster dynamics (e.g., see Table 8 in Rines et al. 2002), the r200 of each group shown in Figure 4 should be considered only as a rough estimate of the group size.
2.5. Comparison between WISE and SDSS data
2.5.1 Star Formation Rate
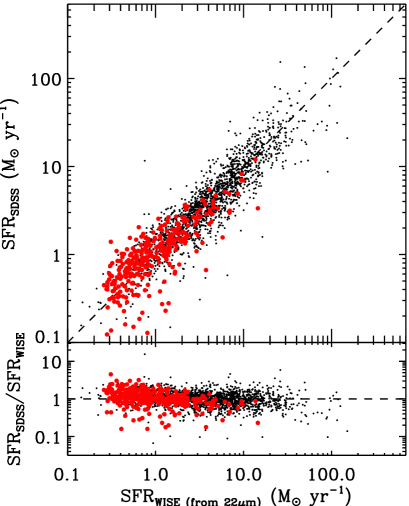
Because we have SFRWISE from the WISE 22 m flux density and SFRSDSS measured from the SDSS optical spectra, the comparison between the two measurements is an important sanity check for the new WISE data (see also Donoso et al. 2012). Among 1736 member galaxies in the A2199 supercluster, there are 1468 and 550 galaxies with SFRSDSS and SFRWISE, respectively.
The SFRSDSS is from the MPA/JHU DR7 VAGC (Brinchmann et al., 2004), which provides extinction and aperture corrected SFR estimates of star-forming galaxies as well as other types of galaxies (e.g., AGN, Composite, low S/N SF, low S/N LINER, and unclassifiable). They correct the extinction following the dust treatment of Charlot & Fall (2000), which compares the observed line ratios with those expected from models with different dust attenuations. For those galaxies where they can not directly measure SFRs from the emission lines such as AGN and composite galaxies, they use the 4000- break (D4000) to estimate SFRs (see Brinchmann et al. 2004 and http://www.mpa-garching.mpg.de/SDSS/DR7/sfrs.html for more details). SFRWISE is converted from the TIR luminosity using the relation in Kennicutt (1998) with the assumption of a Salpeter IMF (Salpeter, 1955): SFRWISE ( yr-1) .
We show the comparison between SFRSDSS and SFRWISE in Figure 5 based only on the galaxies with star-forming spectral type (see §2.5.2). The figure shows that SFRWISE agrees well with SFRSDSS, demonstrating consistency between the two measurements.
2.5.2 AGN Selection
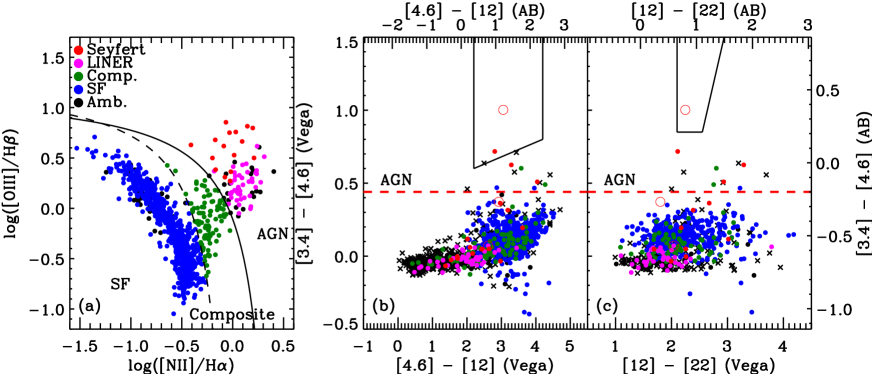
We determined the spectral types of emission-line galaxies using the criteria of Kewley et al. (2006) based on the Baldwin-Phillips-Terlevich (BPT) emission-line ratio diagrams (Baldwin et al., 1981; Veilleux & Osterbrock, 1987). For galaxies with signal-to-noise ratio (S/N)3 in the strong emission-lines H, [OIII] 5007, H, [NII] 6584, and [SII]6717,6731, we determined the spectral types based on their positions in the line ratio diagrams with [OIII]/H plotted against [NII]/H, [SII]/H, and [OI]/H. These types are star-forming galaxies, Seyferts, low-ionization nuclear emission-line regions (LINERs), composite galaxies, and ambiguous galaxies (see Kewley et al. 2006 for more details).
Composite galaxies host a mixture of star formation and AGN, and lie between the extreme starburst line (Kewley et al., 2001) and the pure star formation line (Kauffmann et al., 2003) in the [OIII]/H vs. [NII]/H line ratio diagram (see Fig. 6a). Ambiguous galaxies are those classified as one type in one or two diagrams, but as another type in the other diagrams (see Kewley et al. 2006 for more details). We assign ‘undetermined’ type to those that do not satisfy the S/N criteria.
These AGN criteria select only Type II AGNs with narrow emission lines, and miss Type I AGNs with broad Balmer lines. To identify Type I AGNs missed in this method, we included galaxies with a quasar spectral classifications provided by the SDSS pipeline (i.e. specClass = SPECQSO or SPECHIZQSO; see Stoughton et al. 2002 for more details). Among 1736 member galaxies, three galaxies are Type I AGNs.
There could be still unidentified AGNs in our sample. There are some galaxies without an SDSS spectrum because their redshifts are from the literature. In some galaxies, the AGN signature may be hidden by dust (e.g., Lee et al. 2011). To identify additional AGNs, we plot WISE color-color diagrams in Figure 6 (b-c). Interestingly, the main locus of optically-selected AGN-host galaxies is not clearly distinguishable from the loci of other non-AGN galaxies. If the dust is heated by AGN, the color should be red (see Assef et al. 2010). Therefore, we use the criterion (Vega) to select AGNs at the redshift of A2199. Among eight galaxies satisfying this criterion with known spectral types, six are AGN-host galaxies. This criterion is slightly bluer than the AGN selection criteria used in Assef et al. (2010) and Jarrett et al. (2011), but is similar to the one in Chung et al. (2011). In summary, we classify AGN-host galaxies as objects with either a Type I or Type II (Seyferts, LINERs and composites) AGN optical spectrum, and we classify MIR AGNs from the WISE color-color diagram.
2.5.3 Metallicity and surface brightness
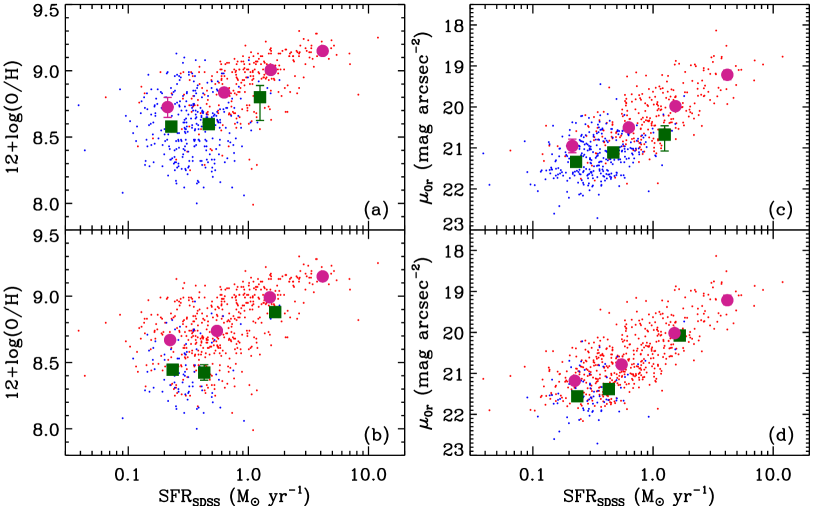
To understand possible systematics in the samples of WISE detected and undetected galaxies, we plot the oxygen abundance log(O/H) and the central surface brightness of the member galaxies in the A2199 supercluster as a function of SFR in Figure 7. Following Rines & Geller (2008), we compute the central surface brightness (in unit of mag arcsec-2) from the SDSS fiber magnitudes using the equation of assuming constant surface brightness within the fiber.
Because of increasing dust obscuration (also increasing dust-to-gas ratio) with gas-phase metallicity (e.g., Heckman et al. 1998; Leroy et al. 2011; Magdis et al. 2011), WISE detected galaxies that have IR emission from dust should be more metal rich than undetected galaxies. If we focus on a range 0.1 M⊙ yr-11 M⊙ yr-1 where both WISE detected and undetected galaxies exist, we can clearly see at both 22 and 12 m that the oxygen abundance of WISE detected galaxies is always higher than that of undetected galaxies. Similarly, the right panels show that WISE detected galaxies tend to have higher surface brightness than undetected galaxies at a fixed SFR. Because the metallicity and the surface brightness are strongly coupled (Ryder, 1995; Simon et al., 2006), it is difficult to conclude which is a more fundamental parameter. In any case, we conclude that MIR-detected galaxies tend to be more metal rich and to have higher surface brightness than those without an MIR detection. If we use all the galaxies in the redshift range of the A2199 supercluster regardless of supercluster membership, the results do not change. Thus these results are not biased by the supercluster environment.
3. Luminosity Functions
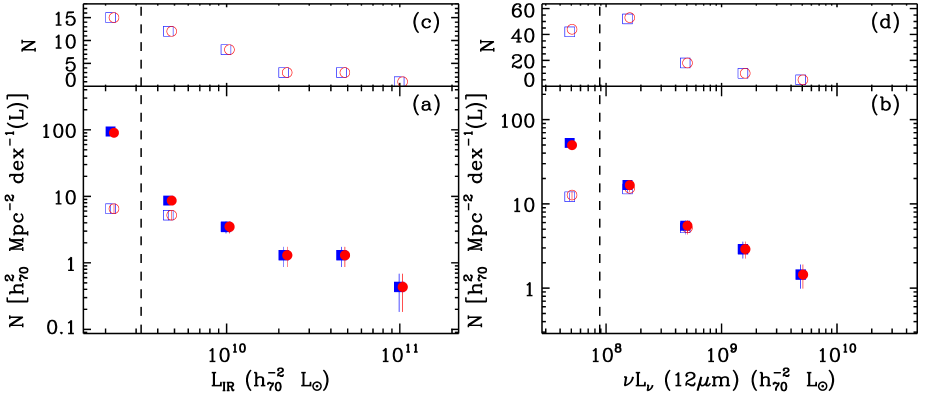
Here we compute the projected TIR and 12 m LFs for galaxies in the A2199 supercluster. Because the depth of the spectroscopic survey is not the same in the central region of A2199 and in the outer regions (see Fig. 3b), we first start with the LFs in the central region to check for bias introduced by the variation in the depth of the spectroscopic survey as a function of clustercentric radius. We construct the LFs by first counting the number of member galaxies. We then divide by the survey area in physical size and by the bin size (log ). Then we correct the counts for spectroscopic and photometric incompleteness by weighting each galaxy with the inverse of each completeness as a function of its WISE flux density (§2.2).
Figure 8 shows TIR and 12 m LFs for galaxies in the central cluster A2199 (i.e. ). Open squares show the raw LFs without the completeness correction using the galaxies brighter than the SDSS limit. The filled squares indicate the corrected LFs. As expected, the correction only affects the faint end of the LFs.
To check the effect of the galaxies fainter than the SDSS limit on the derived LFs, we recompute the LFs again including these galaxies. We show the results in the figure with circle symbols (open for raw LFs and filled for corrected LFs). The two corrected LFs based on bright (squares) and total (circles) samples agree well. The TIR LF (left panel) based on the total sample is not shown because there are no 22 m detected galaxies fainter than the SDSS limit in this central cluster A2199. The agreement of two corrected LFs occurs mainly because the spectroscopic completeness for the WISE sources in this supercluster region is high even when we restrict our analysis to galaxies brighter than the SDSS limit (see Figure 2). This result suggests that the corrected LFs based only on the bright sample are robust. Because the entire region of the supercluster is covered uniformly by the SDSS data, we restrict the following analysis to the galaxies brighter than the SDSS limit for consistency.
| Sampleaafootnotemark: | Totalbbfootnotemark: | AGNs | non-AGNs | ETGs | LTGs |
|---|---|---|---|---|---|
| TIR LFs | |||||
| Entire region | … | ||||
| Inner region | … | … | … | ||
| Outer region | … | … | … | ||
| 12 m LFs | |||||
| Entire region | |||||
| Inner region | … | … | |||
| Outer region | … | … | |||
3.1. LFs for subsamples
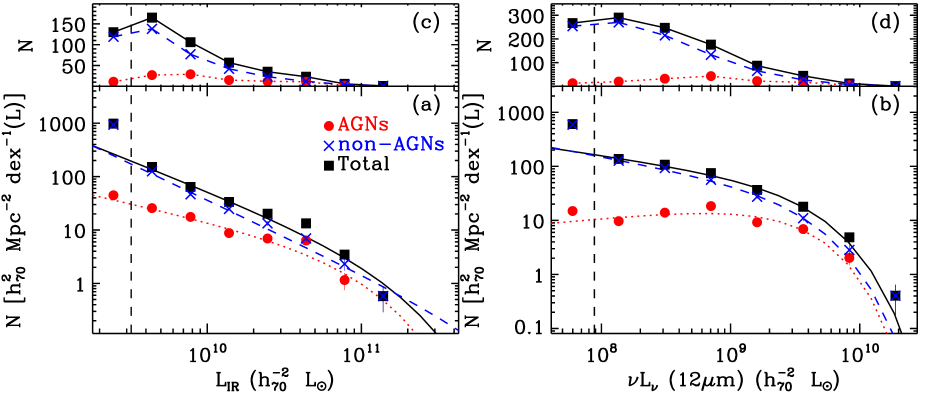
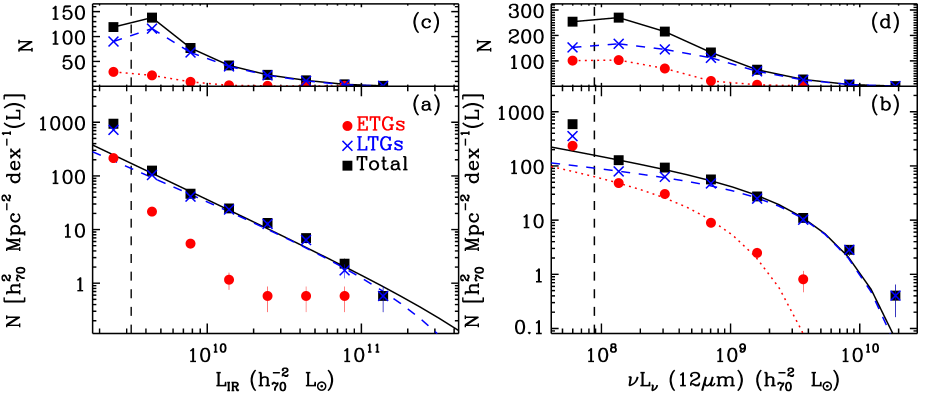
We next explore TIR and 12 m LFs for galaxies in the A2199 supercluster as a whole (Figure 9). We fit the LFs with a classical Schechter (1976) function :
| (2) |
We fit the data above the flux limit (3.6 mJy and 0.6 mJy for 22 m and 12 m, respectively), shown as a vertical dashed line in each panel. We use the MPFIT package in IDL (Markwardt, 2009, an implementation of the Levenberg-Marquardt minimization), and compute the uncertainty of the faint-end slope by repeating the fitting procedure 1000 times for random perturbations of the fitted data points within their errors (following a normal distribution).
Because the bright end of the LFs is not well constrained due to the small number of IR bright galaxies in this supercluster, we focus mainly on the faint-end slope of the LFs. The faint-end slope of the TIR LF for the total sample is . The slope of the TIR LF for AGN-host galaxies is , shallower than that for non-AGN galaxies (), indicating an increasing contribution of AGN-host galaxies to the TIR LFs with increasing IR luminosity as seen in previous studies (e.g., Goto et al. 2011a, b). Because the slopes of the LFs do not seem to change with TIR luminosity, we also fit the LFs with a power-law function (see also Biviano et al. 2011 for the case of the A1763 supercluster). We obtain similar values of , , and for the total sample, AGN-host and non-AGN galaxies, respectively.
The faint-end slope for non-AGN galaxies (i.e. SF galaxies) is steeper than the slope based on IRAS photometry () for the IRAS revised bright galaxy sample (RBGS; Sanders et al. 2003) and the slope () found for cluster galaxies (Bai et al., 2006, 2009; Haines et al., 2011). The steeper slopes probably result partly from the very high spectroscopic completeness in this study. However, it is only slightly steeper than the slope based on recent AKARI photometry for RBGS ( and for SF galaxies and for the total sample, respectively; Goto et al. 2011b) and the slope for the AKARI-detected SDSS galaxies ( and for SF galaxies and total sample, respectively; Goto et al. 2011a). In addition, it is broadly consistent with the faint-end slopes based on all the galaxies in the A1763 supercluster (Biviano et al., 2011).
In Figure 9b, the AGN contribution again increases with 12 m luminosity (Spinoglio & Malkan, 1989). The faint-end slope is and for the total sample and for the non-AGN galaxies, respectively. These slopes are consistent with those based on IRAS galaxy samples (Fang et al., 1998) and those based on the local sample of Spitzer-detected galaxies (Pérez-González et al., 2005).
When we decompose the LFs based on galaxy morphology by rejecting AGN-host galaxies (see Figure 10), the contribution of early-type galaxies to the TIR LFs is very small as expected (left panels). The faint-end slope for late-type galaxies in TIR LFs is , again consistent with the slope from the power-law function (). For the 12 m LFs, the faint-end slopes are and for early- and late-type galaxies, respectively, suggesting that the contribution of early-type galaxies increases with decreasing luminosity (see the right panel of Fig. 10 and §4.2). We list the faint-end slopes for several subsamples in Table 2.
3.2. Environmental dependence of LFs
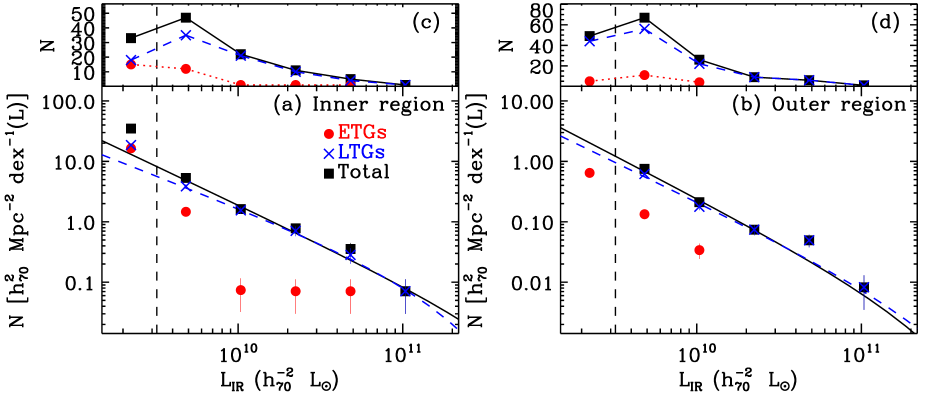
3.2.1 TIR LFs : No Environmental Dependence
To study the environmental dependence of the LFs, we divide the galaxies into three radial ranges Mpc, , and Mpc so that each range contains a similar number of galaxies. Then we plot TIR LFs for galaxies only in the inner and outer regions (to emphasize the difference if any) in Figure 11. We reject AGN-host galaxies in each sample. The faint-end slope changes from (inner region) to (outer region) for the total sample, and (inner region) to (outer region) for late-type galaxies. These results indicate no difference in the faint-end slope. The faint-end slopes of the LFs in the intermediate region is similar.
Consistent with previous studies (Bai et al., 2009; Finn et al., 2010; Haines et al., 2011), our results show that the cluster and field IR LFs do not differ significantly. Biviano et al. (2011) also found similar slopes for three different regions in the A1763 supercluster (i.e. the cluster core, the large-scale filament, and the cluster outskirts). However, they also reported that the filament apparently has a flatter LF than both the outskirts and the core (note that their LFs are complete only down to L⊙). Interestingly, in the Coma cluster, Bai et al. (2006) suggested a hint of a steeper slope toward the outer region of the cluster. Considering the large uncertainty in the determination of the faint-end slope (strongly affected by the spectroscopic and photometric incompleteness), a detailed analysis with a more comprehensive data set of cluster galaxies including Coma is necessary to draw a strong conclusion.
Comparison of our LFs with other LFs based on different SF tracers is also interesting. For example, Cortese et al. (2005, 2008) found a steeper faint-end slope and a brighter in GALEX UV LFs for nearby clusters including Virgo, Coma and A1367 (also for Shapley supercluster in Haines et al. 2011) than for the field UV LFs. They argued that the steep faint-end slope observed in clusters results from a significant contribution of non-SF galaxies at faint UV magnitudes. If they only consider SF galaxies, the cluster faint-end slope is consistent with the field. Intriguingly, the comparison of H LFs between cluster (Coma, A1367 and Virgo) and field galaxies suggests a shallower faint-end slope in clusters than in the field (e.g., Iglesias-Páramo et al. 2002; Shioya et al. 2008; Westra et al. 2010). However, the comparison between the two at high- () suggests similar slopes (Koyama et al., 2010).
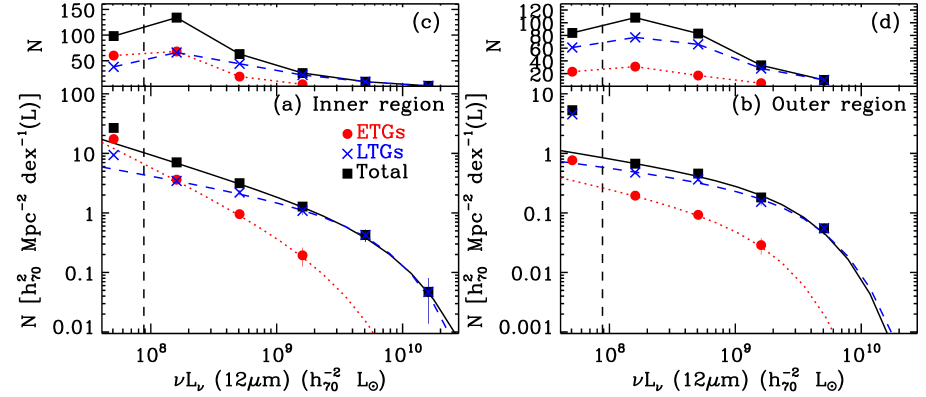
3.2.2 12 m LFs : Strong Environmental Dependence
Unlike the case of TIR LFs, the change of faint-end slopes in 12 m LFs with the clustercentric radius in the A2199 supercluster appears significant (see Figure 12): we find (inner region) and (outer region) for the total sample after rejecting AGN-host galaxies. This change could result from a different morphological mix and/or an intrinsically different slope of the LF with clustercentric radius. Thus we plot the LFs for early and late types separately in the figure.
The most striking feature in Figure 12 is that the contribution of early types to the faint-end LF is comparable to that of late types in the inner region (a). The faint-end slope of the LFs for early-type galaxies changes from (inner region) to (outer region), and from (inner region) to (outer region) for late-type galaxies.
These results suggest that the slope of 12 m LFs changes with the clustercentric radius only for early-type galaxies, and therefore the change of faint-end slope for the total sample results primarily from the different morphological mix depending on the clustercentric radius (i.e. the increasing contribution of early-type galaxies to the faint end of 12 m LFs toward the cluster center). If we divide the galaxies based on local density instead of clustercentric radius, the results for both TIR and 12 m LFs do not change.
4. Discussion
4.1. MIR Star-Forming Sequence in the MIR color-luminosity diagram
12m LFs are very interesting because a variety of mechanisms in galaxies contribute to the SED at this wavelength (Draine & Li, 2007) : SF driven dust continuum and PAH emission features (Smith et al., 2007; Rieke et al., 2009), hot dust component heated by AGN (Netzer et al., 2007; Mullaney et al., 2011), and dusty circumstellar envelopes of asymptotic giant branch (AGB) stars (Bressan et al. 1998; Piovan et al. 2003; see also Kelson & Holden 2010).
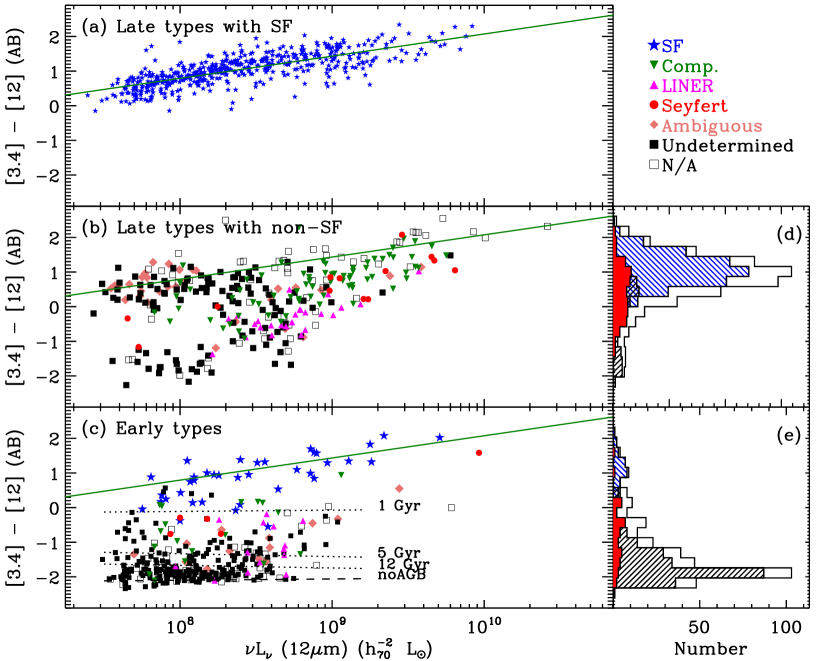
To investigate the galaxy population responsible for the change of faint-end slopes in the 12 m LFs with environment, we plot a MIR color-luminosity diagram for the supercluster member galaxies in Figure 13. MIR colors such as WISE , , or AKARI are useful indicators of the specific SFR and of the presence of intermediate age stellar populations (e.g., Ko et al. 2009, 2012; Shim et al. 2011; Donoso et al. 2012). Figure 13a (top panel) clearly shows that there is a ‘MIR star-forming sequence’ of late-type, SF galaxies ; there is a very good correlation between and 12 m luminosity. The sequence here does not extend to LIRGs because they are absent in this A2199 supercluster. The linear fit to the data gives a relation with an rms ,
| (3) |
The luminosities at 12 m and at 3.4 m show strong correlations with SFRs and stellar masses, respectively (Donoso et al., 2012; Li et al., 2007). The SFR is also correlated with stellar mass (Noeske et al., 2007; Elbaz et al., 2007). Thus the MIR color, , can be written as a function of SFR (or stellar mass). Therefore, the color increases with 12 m luminosity as a result of the underlying correlations.
In Figure 13b, the distribution of most AGN-host galaxies are distinct from the locus of SF galaxies. Their colors are slightly bluer than the SF sequence and their 12 m luminosities are relatively high (i.e. (12 m) ). There are some galaxies with ‘undetermined’ spectral types in the faint end of the SF sequence (i.e. (12 m) ). They are probably dusty star-forming galaxies without emission lines in their optical spectra because of strong dust extinction.
4.2. Environmental dependence of the 12 m LF : Early-type galaxies with MIR emission
In Figure 13c, the early-type galaxies also show a ‘MIR star-forming sequence’ consisting of SF galaxies, known as star-forming (or blue), early-type galaxies (e.g., Fukugita et al. 2004; Lee et al. 2006, 2010). We check their optical color images and their positions in the optical color-magnitude diagrams. This inspection confirms that they are indeed morphologically early-type galaxies with blue colors. However, most early-type galaxies form a ‘MIR blue cloud’ in the low luminosity regime (i.e. (12 m) ); this cloud is mainly responsible for the faint-end slope of 12 m LFs. Most of the spectral types for these galaxies are ‘undetermined’ because there are no emission lines in the optical spectra, and they show a wide spread in MIR colors at . Their SEDs are consistent with passively evolving, old stellar populations with weak MIR emission (weak MIR-excess galaxies) resulting from the circumstellar dust envelopes around AGB stars (Ko et al. 2009, 2012; see Fig. 4 in Shim et al. 2011). These galaxies usually form a tight red sequence in the optical color-magnitude diagram, indicating a homogeneous population, but they show a wide spread in MIR colors depending on their stellar age. In panel (c), we overplot the predictions from Single Stellar Population (SSP) models with different ages, which include the MIR emission from the AGB dust (Piovan et al., 2003). Model predictions with mean stellar ages greater than Gyr are consistent with the colors of these weak MIR-excess galaxies.
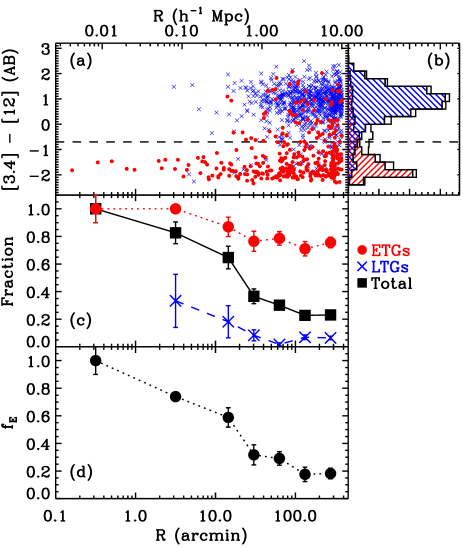
To check the radial distribution of these early-type galaxies, we plot colors and the fraction of these weak MIR-excess galaxies among 12 m emitters as a function of clustercentric radius in Figure 14. Panels (a-b) show a clear color segregation depending on galaxy morphology at all the clustercentric radii. There is a concentration of early-type galaxies with weak MIR emission in the inner region of the cluster ( Mpc ). Panel (c) shows that the fraction of these weak MIR-excess galaxies among 12 m emitters starts to increase with decreasing clustercentric radius at both for early types and for the total sample (see also Haines et al. 2006 based on the optical spectral analysis). This trend is similar to the radial variation of the early-type fraction shown in panel (d). These results suggest that the weak MIR-excess galaxies (mostly early types) that are within the virial radius of A2199 as well as at the infall region (i.e. ), are responsible for the steep faint-end slope of 12 m LFs in the inner region.
Cluster, early-type galaxies with MIR emission were found in other studies (e.g., Ko et al. 2009; Shim et al. 2011; Clemens et al. 2011). For example, Bressan et al. (2006) observed 17 Virgo early-type galaxies with the Spitzer Infrared Spectrograph, and suggested that 76% of their sample are passively evolving galaxies with a broad silicate feature, consistent with the emission from dusty circumstellar envelopes of mass-losing, evolved stars. In the Coma cluster, Clemens et al. (2009) found that the majority (68%) of the early-type galaxies have MIR and optical colors consistent with SSP models with dusty AGB envelopes. Of course, there are also early-type galaxies with MIR emission in the field (Kaneda et al., 2008; Panuzzo et al., 2011). These studies provide a hint that the fraction of weak MIR-excess galaxies is lower in the field than in cluster regions (Figure 13b), but an extensive comparison with a larger sample is important.
Interestingly, the fraction of weak MIR-excess galaxies for late types in panel (c) of Figure 14, increases only in the very inner region of the cluster ( Mpc ). These late-type, weak MIR-excess galaxies are similar to “passive spirals” that are also observed in other clusters at intermediate redshifts. These galaxies may be progenitors of S0 galaxies (e.g., Couch et al. 1998; Moran et al. 2007). The existence of these late-type, weak MIR-excess galaxies in the central cluster region means that their SFA is suppressed, but their morphologies remain late types. This result indicates an important role for hydrodynamic processes (that are not effective in changing galaxy structure) including ram pressure (Gunn & Gott, 1972), strangulation (Larson et al., 1980), and galaxy-galaxy hydrodynamic interactions (Park & Hwang, 2009) in the quenching of SFA in these central regions of clusters. On the other hand, the physical processes related to the quenching of SFA and the morphological transformation of cluster galaxies may work over different timescales (i.e. there may be faster changes in SFA than the morphological transformation) (e.g., Poggianti et al. 1999; Moran et al. 2007; Sánchez-Blázquez et al. 2009).
5. Conclusions
Using the homogeneous data set of WISE and SDSS that cover the entire supercluster region, we examine the MIR properties of supercluster galaxies. Our primary results are
-
1.
The MIR colors () of late-type, star-forming galaxies correlate strongly with 12 m luminosity. These galaxies trace out a star-forming sequence in the MIR color-luminosity diagram.
-
2.
MIR-detected (i.e. WISE 22 m or 12 m) galaxies tend to be more metal rich and to have higher surface brightness than non-MIR detections at a fixed SFR.
Using these MIR-detected galaxies at 22 m or 12 m, we investigate the IR LFs and their environmental dependence in the supercluster. The main results are
-
1.
The TIR LFs are dominated by late-type, star-forming galaxies. The contribution of AGN hosts increases with increasing IR luminosity. Similarly, late-type, non-AGN galaxies dominate 12m LFs; the contribution of early-type galaxies increases with decreasing 12 m luminosity.
-
2.
The faint-end slope of TIR LFs does not change with environment. However, the faint-end slope in the 12 m LFs varies with the environment. The faint-end slope in the dense inner cluster region is steeper than that in the less dense outer region. This behavior results primarily from the increasing contribution of early-type galaxies to the faint end of 12 m LFs with decreasing clustercentric radius. These early-type galaxies contain passively evolving, old stellar populations with weak MIR emission from AGB dust.
The combination of the wide-field survey data set of WISE and spectroscopic surveys covering the entire region of the A2199 supercluster provides a unique opportunity to study the MIR properties of supercluster galaxies and their environmental dependence. A detailed view of SF and nuclear activity for these supercluster galaxies will be studied in a forthcoming paper (Lee et al. in prep.). The combination of WISE all-sky survey data and the Hectospec Cluster Survey data (Rines et al. in prep.) will provide data for extending this study to other cluster systems.
2008NR3EBK_003
“Matter-antimatter asymmetry, dark matter and dark energy in the LHC era”.
KR was funded in part by a Cottrell College Science Award from the Research Corporation.
This publication makes use of data products from the Wide-field Infrared Survey Explorer,
which is a joint project of the University of California, Los Angeles,
and the Jet Propulsion Laboratory/California Institute of Technology,
funded by the National Aeronautics and Space Administration.
References
- Abazajian et al. (2009) Abazajian, K. N., Adelman-McCarthy, J. K., Agüeros, M. A., et al. 2009, ApJS, 182, 543
- Assef et al. (2010) Assef, R. J., Kochanek, C. S., Brodwin, M., et al. 2010, ApJ, 713, 970
- Atlee & Martini (2012) Atlee, D. W., & Martini, P. 2012, ApJ, submitted (arXiv:1201.2957)
- Bai et al. (2009) Bai, L., Rieke, G. H., Rieke, M. J., Christlein, D., & Zabludoff, A. I. 2009, ApJ, 693, 1840
- Bai et al. (2006) Bai, L., Rieke, G. H., Rieke, M. J., et al. 2006, ApJ, 639, 827
- Baldwin et al. (1981) Baldwin, J. A., Phillips, M. M., & Terlevich, R. 1981, PASP, 93, 5
- Benson et al. (2003) Benson, A. J., Bower, R. G., Frenk, C. S., et al. 2003, ApJ, 599, 38
- Biviano et al. (2011) Biviano, A., Fadda, D., Durret, F., Edwards, L. O. V., & Marleau, F. 2011, A&A, 532, A77
- Blanton & Moustakas (2009) Blanton, M. R., & Moustakas, J. 2009, ARA&A, 47, 159
- Blanton et al. (2001) Blanton, M. R., Dalcanton, J., Eisenstein, D., et al. 2001, AJ, 121, 2358
- Böhringer et al. (2000) Böhringer, H., Voges, W., Huchra, J. P., et al. 2000, ApJS, 129, 435
- Boselli & Gavazzi (2006) Boselli, A., & Gavazzi, G. 2006, PASP, 118, 517
- Bressan et al. (1998) Bressan, A., Granato, G. L., & Silva, L. 1998, A&A, 332, 135
- Bressan et al. (2006) Bressan, A., Panuzzo, P., Buson, L., et al. 2006, ApJ, 639, L55
- Brinchmann et al. (2004) Brinchmann, J., Charlot, S., White, S. D. M., et al. 2004, MNRAS, 351, 1151
- Carlberg et al. (1997) Carlberg, R. G., Yee, H. K. C., & Ellingson, E. 1997, ApJ, 478, 462
- Charlot & Fall (2000) Charlot, S., & Fall, S. M. 2000, ApJ, 539, 718
- Chary & Elbaz (2001) Chary, R., & Elbaz, D. 2001, ApJ, 556, 562
- Choi et al. (2010) Choi, Y., Han, D., & Kim, S. S. 2010, Journal of Korean Astronomical Society, 43, 191
- Chung et al. (2011) Chung, S. M., Eisenhardt, P. R., Gonzalez, A. H., et al. 2011, ApJ, 743, 34
- Chung et al. (2010) Chung, S. M., Gonzalez, A. H., Clowe, D., Markevitch, M., & Zaritsky, D. 2010, ApJ, 725, 1536
- Clemens et al. (2009) Clemens, M. S., Bressan, A., Panuzzo, P., et al. 2009, MNRAS, 392, 982
- Clemens et al. (2011) Clemens, M. S., Panuzzo, P., Rampazzo, R., Vega, O., & Bressan, A. 2011, MNRAS, 412, 2063
- Cortese et al. (2008) Cortese, L., Gavazzi, G., & Boselli, A. 2008, MNRAS, 390, 1282
- Cortese et al. (2005) Cortese, L., Boselli, A., Gavazzi, G., et al. 2005, ApJ, 623, L17
- Couch et al. (1998) Couch, W. J., Barger, A. J., Smail, I., Ellis, R. S., & Sharples, R. M. 1998, ApJ, 497, 188
- Davis & Geller (1976) Davis, M., & Geller, M. J. 1976, ApJ, 208, 13
- Diaferio (1999) Diaferio, A. 1999, MNRAS, 309, 610
- Diaferio & Geller (1997) Diaferio, A., & Geller, M. J. 1997, ApJ, 481, 633
- Donoso et al. (2012) Donoso, E., Yan, L., Tsai, C., et al. 2012, ApJ, 748, 80
- Draine & Li (2007) Draine, B. T., & Li, A. 2007, ApJ, 657, 810
- Dressler (1980) Dressler, A. 1980, ApJ, 236, 351
- Elbaz et al. (2007) Elbaz, D., Daddi, E., Le Borgne, D., et al. 2007, A&A, 468, 33
- Elbaz et al. (2010) Elbaz, D., Hwang, H. S., Magnelli, B., et al. 2010, A&A, 518, L29
- Elbaz et al. (2011) Elbaz, D., Dickinson, M., Hwang, H. S., et al. 2011, A&A, 533, A119
- Fang et al. (1998) Fang, F., Shupe, D. L., Xu, C., & Hacking, P. B. 1998, ApJ, 500, 693
- Finn et al. (2010) Finn, R. A., Desai, V., Rudnick, G., et al. 2010, ApJ, 720, 87
- Fukugita et al. (2004) Fukugita, M., Nakamura, O., Turner, E. L., Helmboldt, J., & Nichol, R. C. 2004, ApJ, 601, L127
- Gallazzi et al. (2009) Gallazzi, A., Bell, E. F., Wolf, C., et al. 2009, ApJ, 690, 1883
- Geller et al. (2012) Geller, M. J., Diaferio, A., Kurtz, M. J., Dell’Antonio, I. P., & Fabricant, D. G. 2012, AJ, 143, 102
- Goto et al. (2011a) Goto, T., Arnouts, S., Malkan, M., et al. 2011a, MNRAS, 414, 1903
- Goto et al. (2011b) Goto, T., Arnouts, S., Inami, H., et al. 2011b, MNRAS, 410, 573
- Gunn & Gott (1972) Gunn, J. E., & Gott, III, J. R. 1972, ApJ, 176, 1
- Haines et al. (2011) Haines, C. P., Busarello, G., Merluzzi, P., et al. 2011, MNRAS, 412, 127
- Haines et al. (2006) Haines, C. P., La Barbera, F., Mercurio, A., Merluzzi, P., & Busarello, G. 2006, ApJ, 647, L21
- Heckman et al. (1998) Heckman, T. M., Robert, C., Leitherer, C., Garnett, D. R., & van der Rydt, F. 1998, ApJ, 503, 646
- Hwang et al. (2010) Hwang, H. S., Elbaz, D., Lee, J. C., et al. 2010, A&A, 522, A33
- Hwang et al. (2012) Hwang, H. S., Park, C., Elbaz, D., & Choi, Y.-Y. 2012, A&A, 538, A15
- Iglesias-Páramo et al. (2002) Iglesias-Páramo, J., Boselli, A., Cortese, L., Vílchez, J. M., & Gavazzi, G. 2002, A&A, 384, 383
- Jarrett et al. (2011) Jarrett, T. H., Cohen, M., Masci, F., et al. 2011, ApJ, 735, 112
- Johnstone et al. (2002) Johnstone, R. M., Allen, S. W., Fabian, A. C., & Sanders, J. S. 2002, MNRAS, 336, 299
- Kaneda et al. (2008) Kaneda, H., Onaka, T., Sakon, I., et al. 2008, ApJ, 684, 270
- Kauffmann et al. (2003) Kauffmann, G., Heckman, T. M., Tremonti, C., et al. 2003, MNRAS, 346, 1055
- Kelson & Holden (2010) Kelson, D. D., & Holden, B. P. 2010, ApJ, 713, L28
- Kelson et al. (2002) Kelson, D. D., Zabludoff, A. I., Williams, K. A., et al. 2002, ApJ, 576, 720
- Kennicutt (1998) Kennicutt, Jr., R. C. 1998, ARA&A, 36, 189
- Kewley et al. (2001) Kewley, L. J., Dopita, M. A., Sutherland, R. S., Heisler, C. A., & Trevena, J. 2001, ApJ, 556, 121
- Kewley et al. (2006) Kewley, L. J., Groves, B., Kauffmann, G., & Heckman, T. 2006, MNRAS, 372, 961
- Knobel et al. (2009) Knobel, C., Lilly, S. J., Iovino, A., et al. 2009, ApJ, 697, 1842
- Ko et al. (2009) Ko, J., Im, M., Lee, H. M., et al. 2009, ApJ, 695, L198
- Ko et al. (2012) —. 2012, ApJ, 745, 181
- Koyama et al. (2010) Koyama, Y., Kodama, T., Shimasaku, K., et al. 2010, MNRAS, 403, 1611
- Larson et al. (1980) Larson, R. B., Tinsley, B. M., & Caldwell, C. N. 1980, ApJ, 237, 692
- Lee et al. (2011) Lee, J. C., et al. 2011, ApJ, submitted
- Lee et al. (2010) Lee, J. H., Hwang, H. S., Lee, M. G., Lee, J. C., & Matsuhara, H. 2010, ApJ, 719, 1946
- Lee et al. (2006) Lee, J. H., Lee, M. G., & Hwang, H. S. 2006, ApJ, 650, 148
- Leroy et al. (2011) Leroy, A. K., Bolatto, A., Gordon, K., et al. 2011, ApJ, 737, 12
- Li et al. (2007) Li, H.-N., Wu, H., Cao, C., & Zhu, Y.-N. 2007, AJ, 134, 1315
- Magdis et al. (2011) Magdis, G. E., Daddi, E., Elbaz, D., et al. 2011, ApJ, 740, L15
- Markwardt (2009) Markwardt, C. B. 2009, in Astronomical Society of the Pacific Conference Series, Vol. 411, Astronomical Data Analysis Software and Systems XVIII, ed. D. A. Bohlender, D. Durand, & P. Dowler, 251
- Metcalfe et al. (2005) Metcalfe, L., Fadda, D., & Biviano, A. 2005, Space Sci. Rev., 119, 425
- Moore et al. (1996) Moore, B., Katz, N., Lake, G., Dressler, A., & Oemler, A. 1996, Nature, 379, 613
- Moran et al. (2007) Moran, S. M., Ellis, R. S., Treu, T., et al. 2007, ApJ, 671, 1503
- Mullaney et al. (2011) Mullaney, J. R., Alexander, D. M., Goulding, A. D., & Hickox, R. C. 2011, MNRAS, 414, 1082
- Murakami et al. (2007) Murakami, H., Baba, H., Barthel, P., et al. 2007, PASJ, 59, 369
- Netzer et al. (2007) Netzer, H., Lutz, D., Schweitzer, M., et al. 2007, ApJ, 666, 806
- Noeske et al. (2007) Noeske, K. G., Weiner, B. J., Faber, S. M., et al. 2007, ApJ, 660, L43
- Oemler (1974) Oemler, Jr., A. 1974, ApJ, 194, 1
- Oyaizu et al. (2008) Oyaizu, H., Lima, M., Cunha, C. E., et al. 2008, ApJ, 674, 768
- Panuzzo et al. (2011) Panuzzo, P., Rampazzo, R., Bressan, A., et al. 2011, A&A, 528, A10+
- Park & Choi (2005) Park, C., & Choi, Y. 2005, ApJ, 635, L29
- Park et al. (2007) Park, C., Choi, Y., Vogeley, M. S., Gott, J. R. I., & Blanton, M. R. 2007, ApJ, 658, 898
- Park & Hwang (2009) Park, C., & Hwang, H. S. 2009, ApJ, 699, 1595
- Peebles (1993) Peebles, P. J. E. 1993, Principles of physical cosmology, ed. P. J. E. Peebles
- Pérez-González et al. (2005) Pérez-González, P. G., Rieke, G. H., Egami, E., et al. 2005, ApJ, 630, 82
- Pilbratt et al. (2010) Pilbratt, G. L., Riedinger, J. R., Passvogel, T., et al. 2010, A&A, 518, L1
- Piovan et al. (2003) Piovan, L., Tantalo, R., & Chiosi, C. 2003, A&A, 408, 559
- Poggianti et al. (1999) Poggianti, B. M., Smail, I., Dressler, A., et al. 1999, ApJ, 518, 576
- Rieke et al. (2009) Rieke, G. H., Alonso-Herrero, A., Weiner, B. J., et al. 2009, ApJ, 692, 556
- Rines & Geller (2008) Rines, K., & Geller, M. J. 2008, AJ, 135, 1837
- Rines et al. (2002) Rines, K., Geller, M. J., Diaferio, A., et al. 2002, AJ, 124, 1266
- Rines et al. (2001) Rines, K., Mahdavi, A., Geller, M. J., et al. 2001, ApJ, 555, 558
- Ryder (1995) Ryder, S. D. 1995, ApJ, 444, 610
- Salpeter (1955) Salpeter, E. E. 1955, ApJ, 121, 161
- Sánchez-Blázquez et al. (2009) Sánchez-Blázquez, P., Jablonka, P., Noll, S., et al. 2009, A&A, 499, 47
- Sanders et al. (2003) Sanders, D. B., Mazzarella, J. M., Kim, D., Surace, J. A., & Soifer, B. T. 2003, AJ, 126, 1607
- Schechter (1976) Schechter, P. 1976, ApJ, 203, 297
- Serra et al. (2010) Serra, A. L., Angus, G. W., & Diaferio, A. 2010, A&A, 524, A16
- Serra et al. (2011) Serra, A. L., Diaferio, A., Murante, G., & Borgani, S. 2011, MNRAS, 412, 800
- Shim et al. (2011) Shim, H., Im, M., Lee, H. M., et al. 2011, ApJ, 727, 14
- Shioya et al. (2008) Shioya, Y., Taniguchi, Y., Sasaki, S. S., et al. 2008, ApJS, 175, 128
- Simon et al. (2006) Simon, J. D., Prada, F., Vílchez, J. M., Blitz, L., & Robertson, B. 2006, ApJ, 649, 709
- Smith et al. (2007) Smith, J. D. T., Draine, B. T., Dale, D. A., et al. 2007, ApJ, 656, 770
- Spinoglio & Malkan (1989) Spinoglio, L., & Malkan, M. A. 1989, ApJ, 342, 83
- Stoughton et al. (2002) Stoughton, C., Lupton, R. H., Bernardi, M., et al. 2002, AJ, 123, 485
- Tran et al. (2009) Tran, K.-V. H., Saintonge, A., Moustakas, J., et al. 2009, ApJ, 705, 809
- Tremonti et al. (2004) Tremonti, C. A., Heckman, T. M., Kauffmann, G., et al. 2004, ApJ, 613, 898
- Veilleux & Osterbrock (1987) Veilleux, S., & Osterbrock, D. E. 1987, ApJS, 63, 295
- Werner et al. (2004) Werner, M. W., Roellig, T. L., Low, F. J., et al. 2004, ApJS, 154, 1
- Westra et al. (2010) Westra, E., Geller, M. J., Kurtz, M. J., Fabricant, D. G., & Dell’Antonio, I. 2010, ApJ, 708, 534
- Wright et al. (2010) Wright, E. L., Eisenhardt, P. R. M., Mainzer, A. K., et al. 2010, AJ, 140, 1868
- York et al. (2000) York, D. G., Adelman, J., Anderson, Jr., J. E., et al. 2000, AJ, 120, 1579