A Correlation Between the Eclipse Depths of Kepler Gas Giant Candidates and the Metallicities of their Parent Stars
Abstract
Previous studies of the interior structure of transiting exoplanets have shown that the heavy element content of gas giants increases with host star metallicity. Since metal-poor planets are less dense and have larger radii than metal-rich planets of the same mass, one might expect that metal-poor stars host a higher proportion of gas giants with large radii than metal-rich stars. Here I present evidence for a negative correlation at the level between eclipse depth and stellar metallicity in the Kepler gas giant candidates. Based on Kendall’s statistics, the probability that eclipse depth depends on star metallicity is . The correlation is consistent with planets orbiting low-metallicity stars being, on average, larger in comparison with their host stars than planets orbiting metal-rich stars. Furthermore, since metal-rich stars have smaller radii than metal-poor stars of the same mass and age, a uniform population of planets should show a rise in median eclipse depth with [M/H]. The fact that I find the opposite trend indicates that substantial changes in gas giant interior structure must accompany increasing [M/H]. I investigate whether the known scarcity of giant planets orbiting low-mass stars could masquerade as an eclipse depth-metallicity correlation, given the degeneracy between metallicity and temperature for cool stars in the Kepler Input Catalog. While the eclise depth-metallicity correlation is not yet on firm statistical footing and will require spectroscopic [Fe/H] measurements for validation, it is an intriguing window into how the interior structure of planets and even the planet formation mechanism may be changing with Galactic chemical evolution.
Subject headings:
Stars: planetary systems — Planets and satellites: formation — Planets and satellites: fundamental parameters — Planets and satellites: composition1. Introduction
Since 1958, astronomers have known that Jupiter and Saturn are smaller than they would be if they were made of pure hydrogen and helium (Demarcus, 1958). Even though planetary radii depend on complex equations of state, the simple principle that metal-rich planets are more dense than their metal-poor counterparts of the same mass holds for a wide range of planetary radii (e.g. Fortney & Nettelmann, 2011). Since the heavy-element content of transiting gas giants increases with host star metallicity (Guillot et al., 2006; Miller & Fortney, 2011), one may make a simple prediction: the gas giants orbiting metal-poor stars should have higher radii, on average, than the gas giants orbiting metal-rich stars. Just as the planet detection rate depends on star metallicity (Gonzalez, 1998; Santos et al., 2004; Fischer & Valenti, 2005), the typical giant planet interior structure also should change according to the metal content of the host star.
Before the advent of the Kepler mission, there was no large, uniform sample of gas giants available to search for a relationship between stellar metallicity and gas giant size. The surveys of transiting gas giants were heterogeneous and mostly insensitive to planets smaller than (0.7 Jupiter radii). One notable exception was GJ 436 b at , which orbits an M2.5 star of radius (Gillon et al., 2007b). The Kepler spacecraft, launched in March of 2009, is monitoring about 150,000 mostly Solar-type stars, primarily searching for transits of Earthlike planets in the habitable zone (Batalha et al., 2010). Yet the Kepler mission is also extraordinarily useful for studies of gas giants, for the first time providing a sample of candidate giant planet hosts observed under uniform conditions and with the sensitivity to detect all of the Neptune-like objects of and below.
Here, then, is the opportunity to investigate the dependence of planetary interior structure on host star metallicity. Of course, one expects to see gas giants with a range of sizes orbiting all types of Population 1 stars—after all, Jupiter and Neptune orbit the same star but have radii that differ by almost a factor of three. However, the ensemble of planet radii should show some dependence on stellar metallicity if the heavy element contents of planets and their parent stars are truly connected, as suggested by Guillot et al. (2006) and Miller & Fortney (2011). Likewise, since the Kepler mission is surveying primarily similar, Sunlike stars, one also expects a negative correlation between gas giant eclipse depth and star metallicity. In this article I present the first evidence that such a trend exists—though at this time the eclipse depth-metallicity trend is on tenuous statistical footing and will require follow-up spectroscopic observations for verification.
This article is organized as follows: In §2 I outline my gas giant selection criteria. In §3 I present statistical support for a negative correlation between eclipse depth and star metallicity. I discuss possible selection biases that could masquerade as an eclipse depth-metallicity trend in §4. Finally, I examine physical mechanisms besides the simple density effect that could lead to an eclipse depth-metallicity correlation and speculate about the implications for planet formation theory in §5.
2. Sample selection
In February 2011, the Kepler team released data for 1235 planet candidates (Borucki et al., 2011a). While the planet/star radius ratios were directly measured from eclipse depths, the values of were based on measurements from the Kepler Input Catalog (KIC; Brown et al., 2011). The KIC stellar parameters were computed using photometry in the Sloan u, g, r, i, z filters, the intermediate-bandwidth filter, and the 2MASS filters (Skrutskie et al., 2006). Brown et al. (2011) quote a 0.4-dex error bar on , which translates into a +58%/-37% radius error for a planet transiting a Sunlike star. Hotter, early- to mid-F stars have higher errors, while subgiants tend to have systematically high estimates. Furthermore, Chaplin et al. (2010) performed a detailed asteroseismic follow-up study of three Sunlike stars and found that the KIC estimates were systematically low. Pinsonneault et al. (2012) also found that temperatures derived from KIC photometry were systematically lower than temperatures computed by applying the infrared flux method (Casagrande et al., 2010) to 2MASS photometry (Skrutskie et al., 2006). The problems with for hot stars may therefore apply to stars that have apparently Sunlike temperatures according to the KIC. Quoted planet candidate radii from the Kepler data release are subject to significant uncertainties.
However, the Kepler planet candidate radii can still be used to identify a set of likely gaseous, giant planet candidates. Here I define giant planets as objects with bulk density g cm-3, for which % or more of the planetary volume is due to the H/He atmosphere. According to the planetary interior models of Helled et al. (2011), this volume-based definition of giant planet would include Uranus and Neptune, which are about 65% H/He by volume. Rogers & Seager (2010) show that HAT-P-11b (Bakos et al., 2010) and GJ 436b (Gillon et al., 2007a; Torres, 2007) must also have gas mass and volume fractions similar to Uranus and Neptune. HAT-P-11b, GJ 436b, Uranus and Neptune have radii of , , , and , respectively, suggesting that gas giants in general have radii . To be conservative, I follow Schlaufman & Laughlin (2011) and set the minimum planet candidate radius for this study at . For a candidate with a +58% measurement error on planet size, the true size would be , still within the size range where a gaseous atmosphere is likely (Rogers & Seager, 2010).
The basic sample consists (1) of candidate giant planets with radius that (2) also have metallicity measurements from the KIC. Of the candidates that satisfy criteria (1) and (2), 28 have estimated sizes larger than the “styrofoam planet” Kepler-7b (; Latham et al., 2010), the lowest-density transiting planet yet known. Given that theoretical mass-radius relations predict that Jupiter-mass () planets, brown dwarfs and stars have radii that vary by less than 5% (Chabrier et al., 2009), it is unfortunately very easy for eclipsing low-mass companion stars to masquerade as giant planets. I therefore carefully scrutinized the light curves of the largest planet candidates for signs of (a) planet radius mismeasurement due to V-shaped eclipses, (b) odd/even eclipse depth differences that indicate eclipsing binaries (either in the target itself or a background object), and (c) pulsations that suggest the Scuti-like variability of early- to mid-F stars, for which the uncertainties are high.
Among the 23 candidates with metallicities from KIC and , I find 7 objects for which the reported ratio was mis-fit by the Kepler data analysis pipeline. All such light curves show V-shaped eclipses rather than flat-bottomed eclipses, which drives the fitting algorithm toward artificially low impact parameters and high values of (B. Cochran, private communication). Two objects, KIC 5649956 and KIC 1432214, show the odd/even differences in eclipse depth that indicate an eclipsing binary system. KIC 5649956 pulsates at the 3-4% level, making the odd/even effect difficult to identify. KIC 6470149 and KIC 7449844, which do not have odd/even eclipse patterns, have been shown to host eclipsing M dwarfs by follow-up RV observations taken since the release of the Kepler planet candidate list. Meanwhile, follow-up spectra of KIC 5356593 have raised its value from the 3.8 dex listed in the KIC to 4.5 dex, correspondingly shrinking the computed planet radius from to 13-14 (B. Cochran, private communication).
Furthering the list of suspicious objects, six other stars have no obvious mismeasurement of eclipse depth, but their eclipses are V-shaped, which is more consistent with a companion star than a planet. One star, KIC 10616571, pulsates at the 3% level on three frequencies, while one or two small peaks occur at the minimum of each eclipse, suggesting a hierarchical triple system. Finally, five stars that do not have V-shaped eclipses or odd/even effects pulsate with similar amplitude to the transit signal. One such pulsator, KIC 11818800, will have its planet candidate radius revised from to in the upcoming re-release of the Kepler planet candidate list (B. Cochran, private communication). The preponderance of problems among the largest planet candidates suggest that one should exercise caution when selecting a sample of inflated giant planets.
In a planet candidate list ordered according to , I found that pulsations, odd/even effects and mismeasured and/or V-shaped eclipses accounted for fully 100% of the objects with . Below , light curves that have no obvious problems begin to dominate. The confirmed planet Kepler-12b has (Fortney et al., 2011) and a similar density to Kepler-7b, validating the idea that such inflated planets can exist. I therefore set an upper limit of to the planet candidates in this study. The basic sample consists of 213 giant planet candidates with whose host stars also have metallicities from the Kepler Input Catalog (KIC). All planet candidates used in this study are listed in Table 1.
While Morton & Johnson (2011) argue for a false positive rate of 5%-10% among the Kepler planet candidates, Borucki et al. (2011a) are more cautious and quote % reliability for rank 2 KOIs (Kepler Objects of Interest) and % reliability for rank 3 and 4 KOIs. Despite the scrutiny of planet candidates, there is therefore still the possibility that the sample is contaminated by as much as 40% eclipsing binaries, background eclipsing binaries and hierarchical triples. I discuss the possible consequences of such contamination in §4.
3. Statistical evidence for deep eclipses of low-metallicity stars
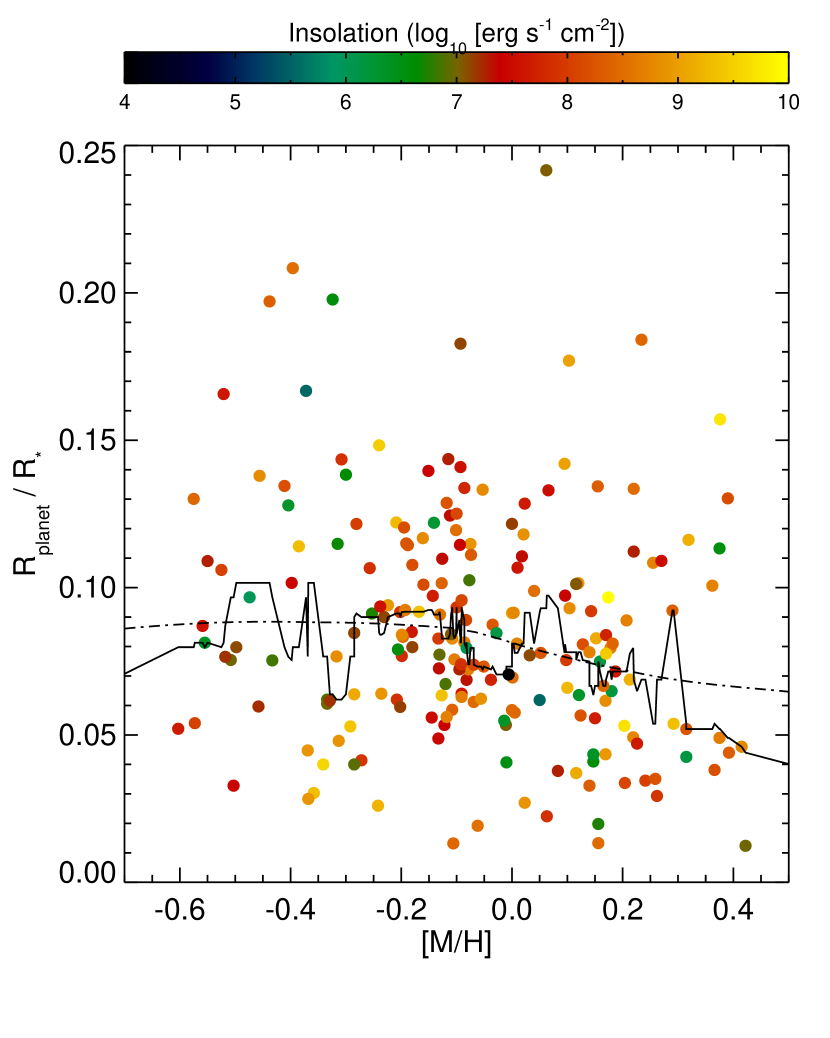
With a sample of gas giant candidates in hand, I now present the first statistical evidence that Galactic chemical evolution affects the internal structure of giant planets as well as the frequency with which they form. Figure 1 shows as a function of host star [M/H] for the stars in my sample. Planet candidates are color-coded according to the irradiation they receive from their host stars, which I discuss further in §5. Although I used the Kepler estimates of to select my sample of gas giant candidates (see §2 for selection criteria), for the purposes of statistical analysis I have cast the trend in terms of rather than because planet radii tend to change substantially between inclusion in the Kepler planet candidate list and eventual confirmation and publication. , by contrast, is a simple observable whose accuracy I have verified by examining the light curves of the largest planet candidates. The question I am asking is—are Kepler candidate giant planets orbiting low-metallicity stars larger in comparison to their host stars than candidate planets orbiting high-metallicity stars?
Figure 1 shows eclipse depth as a function of [M/H] for the candidate giant planet hosts in the selected sample. Scanning from left to right, notice the knot of small planet candidates with that appears at [M/H] without a commensurate increase in large planet candidates with . To quantify the trend in decreasing eclipse depth with metallicity, I have computed a running median (Härdle & Steiger, 1995) with a 21-point window (solid black) and a local polynomial regression (Cleveland et al., 1992) with span 0.75 and degree 1 (dash-dot black). Notice the decreasing nature of both manifestations of the trend in the range . While planets of all radii can appear around stars of all metallicities, there is a hint that eclipses may be deepest, on average, for low-metallicity stars. This possible trend is as predicted—planets orbiting low-metallicity hosts should have the lowest solid/gas ratios, making them the least dense and therefore biggest of planets.
Given that the running median is noisy and the slope of the local polynomial regression is small, is the trend statistically significant? The Kendall rank coefficient for mapping [M/H] onto is . The associated probability that the null hypothesis—that is unrelated to star metallicity—is correct is , a significance level at which the R statistical suite recommends adoption of the alternative hypothesis. For more information on Kendall’s coefficient, see Abdi (2007). Using the large-sample Gaussian approximation to the variance of the sampling distribution,
| (1) |
where is the number of stars in the sample (Abdi, 2007), I find that the standard deviation of the sampling distribution is 0.046. The computed value of differs from the expected in the case of the null hypothesis by . I therefore consider the eclipse depth-metallicity trend interesting and suggestive, but not conclusive—especially since so little is known about the true distribution of giant planet eclipse depths that the Gaussian approximation to the distribution may not be appropriate. My main goal in writing this article is to motivate spectroscopic follow-up of the Kepler giant planet candidates. More precise metallicities and star radii will place our understanding of how planet structure evolves with star metallicity on much firmer statistical footing.
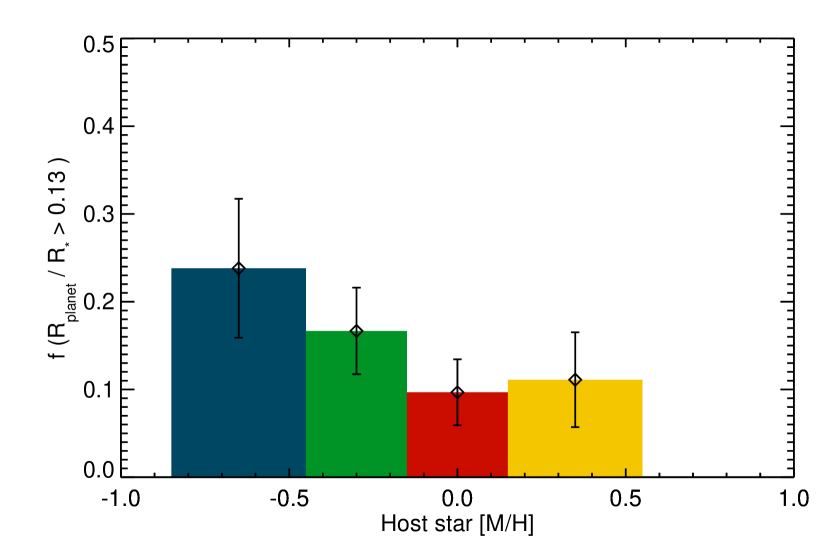
Besides the robust measures of center polotted in Figure 1 and the non-parametric Kendall’s coefficient discussed above, there is another way to visualize the eclipse depth-metallicity trend. In Figure 2, I have divided the data into four broad metallicity bins and plotted the fraction of planet candidates for which in each bin. I chose as the cutoff because it is a roughly typical eclipse depth of well-studied inflated planets such as HD 209458 b (; Charbonneau et al., 2000) and HAT-P-19 b (; Hartman et al., 2011). What Figure 2 also hints at, then, is that stars in the lowest-metallicity bin tend to host a higher fraction of planets that are large in comparison to their host stars than the stars in the higher-metallicity bins. Notice, however, that the Poisson error bars on the fraction of high eclipse depths in the lowest-metallicity bin overlap with the error bars on two of the other three bins. Furthermore, note that in binning the data and setting a threshold value of , I have made the threshold and the bins parameters that affect any statistical inferences made from Figure 2 (though slightly different cutoff values yield a similar trend). Figure 2 is intended more as a visualization of the data than as a statistical tool.
There is one more potential pitfall left to examine, the accuracy of the KIC [M/H] estimates. Already the planet size-metallicity trend is on marginal footing—could [M/H] inaccuracies wipe it out entirely? Figure 3 shows KIC [M/H] as a function of spectroscopically determined [Fe/H]111Host star metallicities for Kepler discoveries were collected from the Extrasolar Planets Encyclopaedia, http://exoplanet.eu. for confirmed, published Kepler discoveries. From Figure 3, one can see that the KIC metallicities are systematically lower than the spectroscopic values. The best-fit line relating KIC [M/H] to spectroscopic [Fe/H] is
| (2) |
This result agrees with the analysis of Brown et al. (2011), whose comparison of KIC metallicities with [Fe/H] derived from Keck/HIRES spectra uncovered a systematic 0.17-dex underestimate in the KIC values. The Spearman rank correlation coefficient relating and is 0.76, which has a two-sided significance of its deviation from zero of . In contrast, Brown et al. (2011) found a Spearman rank correlation coefficient of only 0.42, with a significance of 0.02, for a subset of stars in the KIC observed with Keck/HIRES. My analysis indicates that, despite the differences in absolute scale between spectroscopic and KIC metallicities, the two are nevertheless closely related. Note, however, the two outliers, Kepler-10 and Kepler-19. Kepler-10 is a Solar-radius, Solar-temperature star with G spectral type (Batalha et al., 2011), while Kepler-19 is a slightly smaller star (, Ballard et al., 2011) with K and a possibly later spectral type. Neither star falls into a known problem category for the KIC—F stars, subgiants and stars with K—so there is no clear reason why their KIC metallicities are so low. Published planet candidates used in the [M/H] accuracy analysis are listed in Table 2.
Knowing that KIC metallicities do track spectroscopic metallicities, albeit with some scatter, the relevant question for the purposes of this study is whether or not one can place the Kepler candidate planet hosts in the correct order on some metallicity scale. Keeping in mind the warnings about how binning introduces extra parameters into the statistical analysis whose effects may not be well understood, I still wish to know how often measurement error will cause a candidate planet host to cross over into a neighboring bin in Figure 2. The scatter of the KIC [M/H] values around the best-fit line in equation 2 is dex, indicated by dash-dotted lines in the left-hand panel of Figure 3. (The right-hand panel of Figure 3 shows KIC [M/H] as a function of , a correlation I will discuss further in §4.) I modeled the probability distribution of each star’s true metallicity using a Gaussian distribution with dex centered on that star’s KIC [M/H] value. These Gaussian distributions of probable metallicity formed the basis of a Monte Carlo simulation, in which I randomly sampled each star’s [M/H] distribution 20,000 times, divided the random samples into the same [M/H] bins as in Figure 2 and counted the fraction of planet candidates in each bin with .
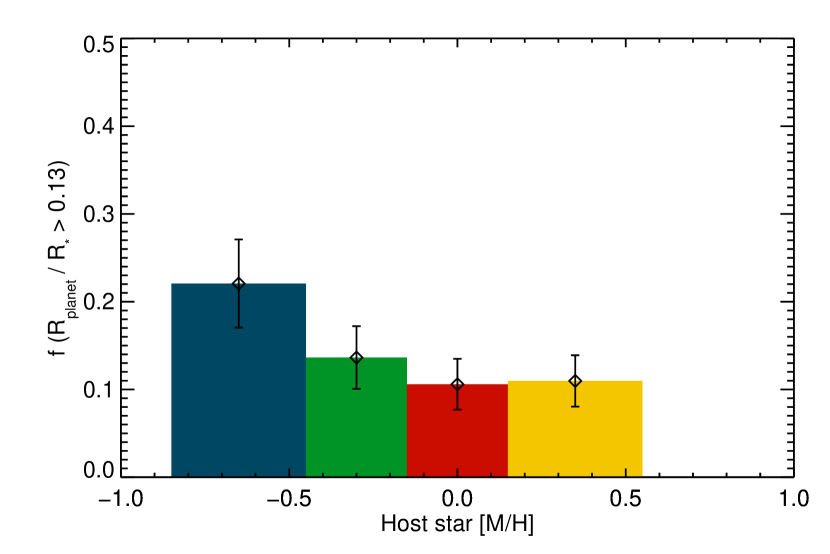
Figure 5 shows the results of the Monte Carlo simulation. Here the story from the error bars is slightly more promising. Candidate planet hosts with dex show significantly more deep eclipses for which than stars with dex. Once again, though, the error bars barely miss overlapping, so that the statistical significance of the trend is about —suggestive, but not definitive. Confirming that gas giants orbiting low-metallicity stars really tend to have larger radii than gas giants orbiting high-metallicity stars will require extensive follow-up spectroscopy of the Kepler candidate planet hosts. The California-Kepler survey is already underway and will significantly improve stellar , [Fe/H] and planet radius estimates (Howard et al., 2012). With spectroscopic observations of a large fraction of the giant planet candidates, it should even be possible to cast the size-metallicity trend in terms of rather than .
4. Statistical biases
In this section I discuss possible statistical biases that could masquerade as a size-metallicity trend. The first possible bias I wish to examine is whether or not the Kepler mission is equally sensitive to planets with minimum radius in each metallicity bin. Given its ability to detect Earthlike planets transiting Sunlike stars, Kepler has at least 25 times the sensitivity required to detect planets with orbiting Solar-type stars, which produce eclipse depths of two parts per thousand. Planets with only become undetectable when the star radius approaches . Since the largest star radius in the selected sample is and only five stars have , there should be no systematic trend that prevents detection of the smaller, giant planets at low metallicity.
Another possible bias arises from the interaction of two effects: the scarcity of gas giants orbiting low-mass stars (e.g. Bonfils et al., 2011) and the red colors of late K- and M-type stars. Among stars of a constant color, those that are most metal-rich tend to have the highest color because of the wealth of iron absorption lines in the blue part of the spectrum (Schlaufman & Laughlin, 2011). Red optical color is therefore an important metallicity indicator for stars in the KIC, but its usefulness breaks down for late-type stars that are naturally red, whatever their metallicity. Brown et al. (2011) show that the coolest stars, those with K, tend to be artificially classified with super-Solar metallicity. Above K, the metallicity distribution is a well-behaved Gaussian that is not a function of temperature. One might worry that the low proportion of inflated giant planets orbiting the most metal-rich stars could be an artifact of the known scarcity of gas giants orbiting low-mass stars (Endl et al., 2006; Cumming et al., 2008; Bonfils et al., 2011). Perhaps low-mass stars whose metallicities are artificially high account for much of the apparently metal-rich part of the selected sample. Fortunately, only four stars in the sample have , so the most problematic KIC metallicities have largely been avoided.
Although the analysis of KIC atmospheric parameters by Brown et al. (2011) does not show any obvious correlation between KIC [M/H] and for stars with (see their Figure 11), I wish to independently verify the lack of a temperature-metallicity relationship. The right-hand panel of Figure 3 shows [M/H] as a function of for stars in the selected sample. The solid line indicates the mean [M/H] value and the dash-dot line gives the best linear fit. The Spearman rank correlation coefficient is -0.19, with a significance of 0.0049—three orders of magnitude higher than the significance of the - relationship (a high significance value indicates a weak correlation). While the correlation analysis shows some evidence for a metallicity-temperature relationship, KIC metallicity estimates appear to be much more related to true star metallicities than temperatures. It is likely that the eclipse depth-[M/H] correlation heralds a change in planet structure with host star [M/H] rather than with host star mass and temperature, but I am unwilling to completely rule out the possibility that dearth of gas giants orbiting low-mass stars is affecting the results.
Although the Kepler planet radii used to select the sample show no correlation with (Figure 4, left panel), a possible degeneracy between [M/H] and in the KIC could affect the results of this study. Red optical color is an indicator of both high and high metallicity, and the only intermediate-bandwidth filter used for KIC photometry—the filter—is sensitive to both and [M/H]. Fortunately, the correlation between and [M/H] is much weaker than the correlation between and [M/H]. For [M/H] as a function of (Figure 4, right panel), I find a Spearman rank correlation coefficient of -0.13, with a significance of 0.05. Furthermore, the subgiant problem discussed earlier in this section should apply to a small fraction of the stars in the sample: only seven stars of 213, or 3%, have . As with temperature, I am unwilling to definitively state that the weak degeneracy between KIC and [M/H] plays no part in creating the eclipse depth-metallicity correlation. However, I think it likely that declining eclipse depths with metallicity are related to giant planet interior structure rather than -[M/H] degeneracies.
The final possible source of bias comes from the possible 5%-40% contamination of the sample with eclipsing binaries, background eclipsing binaries, and hierarchical triples. This bias arises because stellar multiplicity rates depend on star mass. From , the binary fraction is an increasing function of star mass (e.g. Clark et al., 2012), with about 20% of stars in binaries and 40% of stars in binaries. The increasing binary fraction with may mean that the planet candidates orbiting stars with the largest radii have the highest contamination rate. Since the tendency in the KIC is for low-mass, low-temperature stars to have artificially high metallicity values, it is possible for background eclipsing binaries to produce an eclipse depth-metallicity trend. However, the binary fraction is only a source of bias if [M/H] is related to star temperature in the candidate giant planet sample. Given that my analysis indicates that KIC metallicity is more related to spectroscopic metallicity than any other stellar parameter, I do not think the multiple-star contamination is the source of the possible eclipse depth-metallicity trend—but, again, more follow-up is necessary to rule out multiple stars as a source of bias.
5. Physical explanations for the eclipse depth-metallicity correlation
Assuming that the tentative correlation between planet candidate eclipse depth and metallicity (1) is real, and (2) is not a manifestation of the dependence of planet occurrence rate on stellar mass—both of which are assumptions that require further investigation—what is the physical reason for the correlation? First, it is important to point out that for stars of a given mass and age, star radius decreases with increasing metallicity (e.g. Marigo et al., 2008)—so the fall in median with [M/H] means gas giant interior structure must change substantially to counteract the fact that eclipse depth should tend to rise with star metallicity for a uniform population of planets. To the extent that the KIC [M/H] values track spectroscopic [Fe/H], the eclipse depth-metallicity correlation reflects real changes in the population of giant planets as a function of star metallicity.
One possibility is that irradiation from the central star depends on metallicity. Irradiation provides the energy required to inflate hot Jupiters either through Ohmic dissipation (which depends on the star’s ability to ionize the upper atmosphere; Batygin et al., 2011) or simply by forcing a shallow atmospheric temperature gradient that slows planetary contraction (e.g. Guillot & Showman, 2002; Baraffe et al., 2003; Burrows et al., 2003; Fortney & Nettelmann, 2011). At a given mass, a star of low metallicity will be slightly bluer and hotter than its counterpart at high metallicity, so metal-poor stars might tend to host larger-radius planets if the orbital distribution does not depend on metallicity. The points in Figure 1 are color-coded according to average stellar insolation. Although there is a visible tendency for least-irradiated planets to have the smallest eclipse depths (note the cluster of green points toward the bottom of the plot), there is no obvious tendency for the planets orbiting the lowest-metallicity hosts to be the most irradiated. I therefore tentatively rule out differences in irradiation levels as the reason for the eclipse depth-metallicity correlation.
Other planetary inflation mechanisms that have been proposed include tidal heating (Jackson et al., 2008), thermal tides (Arras & Socrates, 2010) and double-diffusive convection (Chabrier & Baraffe, 2007). Of these alternative inflation mechanisms, double-diffusive convection—in which composition gradients create multiple, semi-detached convective layers between which energy transport is inefficient—is the most likely to be related to star metallicity. In their models of the interior structures of uninflated hot Jupiters, Miller & Fortney (2011) found a positive correlation between stellar metallicity and heavy-element mass in planetary envelopes (see their Figure 2). A metal-rich planetary envelope would likely have a steeper composition gradient than a metal-poor envelope. It is therefore possible that double-diffusive convection provides the required connection between giant planet structure and stellar metallicity.
The most straightforward explanation for the eclipse depth-metallicity trend, however, is that metal-rich planets of a given mass are denser than their metal-poor counterparts, leading to smaller radii (e.g. Fortney & Nettelmann, 2011). Transit searches have for some time provided hints that heavily metal-enriched, dense planets tend to orbit metal-rich stars such as HD 149026 (Sato et al., 2005) and HAT-P-2 (Bakos et al., 2007; Leconte et al., 2009), and the connection between heavy-element mass and host star metallicity—the crucial ingredient behind any eclipse depth-[M/H] correlation—has also been statistically established (Guillot et al., 2006; Miller & Fortney, 2011). Given that Jupiter, Saturn, Uranus and Neptune all orbit the same star but have radii ranging from to , one expects to see gas giants with a range of radii orbiting stars of all metallicities yet probed (whether or not giant planets should form around Population II stars is an interesting question). However, if Jupiter, Saturn, Uranus and Neptune were all twice as metal-rich as they are, the average radius of the entire ensemble of Solar System planets would decline. I favor a simple density effect as the reason behind the increased eclipse depths of planet candidates orbiting low-metallicity stars.
I now make a speculative proposition, which is that low-metallicity stars may host a higher proportion of planets that formed by gravitational instability than high-metallicity stars. While dust is the necessary raw ingredient for the protoplanetary cores that nucleate the growth of massive gaseous atmospheres in the core accretion scenario, dust is the enemy of planet formation by gravitational instability because it increases disk opacity, reducing the disk’s ability to cool (Cai et al., 2006). Though planets that form by core accretion tend to be metal-rich even relative to their host stars and by necessity have solid cores (Miller & Fortney, 2011), planets that form by gravitational instability most likely have the stellar composition and tend to be less dense (see, however, Helled & Bodenheimer, 2010). The idea that the giant planets orbiting low-metallicity stars predominantly formed by gravitational instability is interesting and warrants further thought. The theory that high-metallicity stars and low-metallicity stars form their gas giants by different mechanisms is consistent with the results of Santos et al. (2004) and Udry & Santos (2007), who found that the frequency of giant planets as a function of [Fe/H] is flat at subsolar metallicities. If the dominant planet formation mechanism were not changing with metallicity, one would expect a monotonically increasing planet detection rate with [Fe/H] for the entire metallicity range surveyed.
While the eclipse depth-metallicity trend is not yet on firm statistical footing, it is an intriguing possibility that may provide insight into the Galactic history of planet formation. This work provides the first piece of evidence that giant planet structure, not just detection rate, depends on stellar metallicity. The planet populations of metal-rich stars and metal-poor stars may be very different. It is even possible that differences in planetary structure with host star metallicity could indicate not only changes in the raw ingredients available for planet formation as the Galaxy becomes chemically enriched, but changes in the planet formation mechanism itself—planetary evolution across cosmic time.
Funding for this work was provided by the National Science Foundation through the Faculty Early Career Development (CAREER) program, award AST-1055910, to S. Dodson-Robinson. I thank Bill Cochran for input his extensive help with weeding out suspicious giant planet candidates from the Kepler database, Eric Feigelson for advice on nonparametric, robust statistical methods, and the anonymous referee for a thorough critique of the manuscript. This research has made use of the NASA Exoplanet Archive, the Exoplanet Encyclopedia and the SIMBAD database, operated at CDS, Strasbourg, France.
References
- Abdi (2007) Abdi, H. 2007, in Encyclopedia of Measurement and Statistics, ed. N. J. Salkind (Thousand Oaks, CA: Sage), 508
- Arras & Socrates (2010) Arras, P., & Socrates, A. 2010, ApJ, 714, 1
- Bakos et al. (2007) Bakos, G. Á., Kovács, G., Torres, G., et al. 2007, ApJ, 670, 826
- Bakos et al. (2010) Bakos, G. Á., Torres, G., Pál, A., et al. 2010, ApJ, 710, 1724
- Ballard et al. (2011) Ballard, S., Fabrycky, D., Fressin, F., et al. 2011, ApJ, 743, 200
- Baraffe et al. (2003) Baraffe, I., Chabrier, G., Barman, T. S., Allard, F., & Hauschildt, P. H. 2003, A&A, 402, 701
- Batalha et al. (2011) Batalha, N. M., Borucki, W. J., Bryson, S. T., et al. 2011, ApJ, 729, 27
- Batalha et al. (2010) Batalha, N. M., Borucki, W. J., Koch, D. G., et al. 2010, ApJ, 713, L109
- Batygin et al. (2011) Batygin, K., Stevenson, D. J., & Bodenheimer, P. 2011, ApJ, 738, 1
- Bonfils et al. (2011) Bonfils, X., Delfosse, X., Udry, S., et al. 2011, A&A, submitted (arXiv:1111.5019)
- Bonomo et al. (2011) Bonomo, A. S., Hébrard, G., Santerne, A., Santos, N. C., Deleuil, M., Almenara, J., Bouchy, F., Díaz, R. F., Montou, C., & Vanhuysse, M. 2011, arXiv:1110.5462
- Borucki et al. (2011a) Borucki, W. J., Koch, D. G., Basri, G., et al. 2011, ApJ, 736, 19
- Borucki et al. (2012b) Borucki, W. J., Koch, D. G., Batalha, N., et al. 2012, ApJ, 745, 120
- Borucki et al. (2010) Borucki, W. J., Koch, D. G., Brown, T. M., et al. 2010, ApJ, 713, L126
- Bouchy et al. (2011) Bouchy, F., Bonomo, A. S., Santerne, A., et al. 2011, A&A, 533, 83
- Brown et al. (2011) Brown, T. M., Latham, D. W., Everett, M. E., & Esquerdo, G. A. 2011, ApJ, 142, 112
- Buchhave et al. (2011) Buchhave, L. A., Latham, D. W., Carter, J. A., et al. 2011, ApJS, 197, 3
- Burrows et al. (2003) Burrows, A., Sudarsky, D., & Hubbard, W. B. 2003, ApJ, 594, 545
- Cai et al. (2006) Cai, K., Durisen, R. H., Michael, S., Boley, A. C., Mejía, A. C., Pickett, M. K., & D’Alessio, P. 2006, ApJ, 636, 149
- Casagrande et al. (2010) Casagrande, L., Ramírez, I., Meléndez, J., Bessell, M., & Asplund, M. 2010, A&A, 512, 54
- Chabrier & Baraffe (2007) Chabrier, G., & Baraffe, I. 2007, ApJ, 661, L81
- Chabrier et al. (2009) Chabrier, G., Baraffe, I., Leconte, J., Gallardo, J., & Barman, T. 2009, American Institute of Physics Conference Series, 1094, 102
- Chaplin et al. (2010) Chaplin, W. J., Appourchaux, T., Elsworth, Y., et al. 2010, ApJ, 713, L169
- Charbonneau et al. (2000) Charbonneau, D., Brown, T. M., Latham, D. W., & Mayor, M. 2000, ApJ, 529, L45
- Clark et al. (2012) Clark, B. M., Blake, C. H., & Knapp, G. R. 2012, ApJ, 744, 119
- Cleveland et al. (1992) Cleveland, W. S., Grosse, E., & Shyu, M. 1992, in Statistical Models in S, ed. J. Chambers & T. Hastie (London: Chapman & Hall), 309
- Cochran et al. (2011) Cochran, W. D., Fabrycky, D. C., Torres, G., et al. 2011, ApJS, 197, 7
- Cumming et al. (2008) Cumming, A., Butler, R. P., Marcy, G. W., Vogt, S. S., Wright, J. T., & Fischer, D. A. 2008, PASP, 120, 531
- Demarcus (1958) Demarcus, W. C. 1958, AJ, 62, 3
- Doyle et al. (2011) Doyle, L. R., Carter, J. A., Fabrycky, D. C., et al. 2011, Science, 333, 1602
- Endl et al. (2006) Endl, M., Cochran, W. D., Kürster, M., Paulson, D. B., Wittenmyer, R. A., MacQueen, P. J., & Tull, R. G. 2006, ApJ, 649, 436
- Endl et al. (2011) Endl, M., MacQueen, P. J., Cochran, W. D., et al. 2011, ApJS, 197, 13
- Fabrycky et al. (2012) Fabrycky, D. C., Ford, E. B., Steffen, J. H., et al. 2012, arXiv:1201.5415
- Fischer et al. (2012) Fischer, D. A., Schwamb, M. E., Schawinski, K., et al. 2012, MNRAS, 419, 2900
- Fischer & Valenti (2005) Fischer, D. A., & Valenti, J. 2005, ApJ, 622, 1102
- Ford et al. (2012) Ford, E. B., Fabrycky, D. C., Steffen, J. H., et al. 2012, arXiv:1201.5409
- Fortney et al. (2011) Fortney, J. J., Demory, B.-O., Désert, J.-M., et al. 2011, ApJS, 197, 9
- Fortney & Nettelmann (2011) Fortney, J. J., & Nettelmann, N. 2010, Space Science Reviews, 152, 423
- Fressin et al. (2011) Fressin, F., Torres, G., Rowe, J. F., et al. 2011, Nature, online (doi:10.1038/nature10780)
- Gillon et al. (2007a) Gillon, M., Demory, B.-O., Barman, T., Bonfils, X., Mazeh, T., Pont, F., Udry, S., Mayor, M., & Queloz, D. 2007, A&A, 471, L51
- Gillon et al. (2007b) Gillon, M., Pont, F., Demory, B.-O., Mallmann, F., Mayor, M., Mazeh, T., Queloz, D., Shporer, A., Udry, S., & Vuissoz, C. 2007, A&A, 472, 13
- Gonzalez (1998) Gonzalez, G. 1998, A&A, 334, 221
- Guillot & Showman (2002) Guillot, T., & Showman, A. P. 2002, A&A, 385, 156
- Guillot et al. (2006) Guillot, T., Santos, N. C., Pont, F., Iro, N., Melo, C., & Ribas, I. 2006, A&A, 423, L21
- Härdle & Steiger (1995) Härdle, W., & Steiger, W. 1995, Applied Statistics, 44, 258
- Hartman et al. (2011) Hartman, J. D., Bakos, G. Á., Sato, B., et al. 2011, ApJ, 726, 52
- Helled et al. (2011) Helled, R., Anderson, J. D., Podolak, M., & Schubert, G. 2011, ApJ, 726, 15
- Helled & Bodenheimer (2010) Helled, R., & Bodenheimer, P. 2010, Icarus, 207, 503
- Holman et al. (2010) Holman, M. J., Fabrycky, D. C., Ragozzine, D., et al. 2010, Science, 330, 51
- Howard et al. (2012) Howard, A., Marcy, G. W., Johnson, J. A., Morton, T. D., & Isaacson, H. 2012, American Astronomical Society Meeting Abstracts 219, #405.01
- Jackson et al. (2008) Jackson, B., Greenberg, R., & Barnes, R. 2008, ApJ, 681, 1631
- Jenkins et al. (2010) Jenkins, J. M., Borucki, W. J., Koch, D. G., et al. 2010, ApJ, 724, 1108
- Johnson et al. (2011) Johnson, J. A., Gazak, J. Z., Apps, K., et al. 2011, arXiv:1112.0017
- Latham et al. (2010) Latham, D., Borucki, W., Koch, D., et al. 2010, ApJ, 713, L140
- Leconte et al. (2009) Leconte, J., Baraffe, I., Chabrier, G., Barman, T., & Levrard, B. 2009, A&A, 506, 385
- Lissauer et al. (2011) Lissauer, J. J., Fabrycky, D. C., Ford, E. B., et al. 2011, Nature, 470, 53
- Marigo et al. (2008) Marigo, P., Girardi, L., Bressan, A., Groenewegen, M. A. T., Silva, L., & Granato, G. L. 2008, A&A, 482, 883
- Miller & Fortney (2011) Miller, N., & Fortney, J. J. 2011, ApJ, 736, L29
- Morton & Johnson (2011) Morton, T. D., & Johnson, J. A. 2011, ApJ, 738, 170
- Nordström et al. (2004) Nordström, B., Mayor, M., Andersen, J., Holmberg, J., Pont, F., Jørgensen, B. R., Olsen, E. H., Udry, S., & Mowlavi, N. 2004, A&A, 418, 989
- Pinsonneault et al. (2012) Pinsonneault, M. H., An, D., Molenda-Żakowicz, J., Chaplin, W. J., Metcalfe, T. S., & Bruntt, H. 2012, ApJS, 199, 30
- Rogers & Seager (2010) Rogers, L. A., & Seager, S. 2010, ApJ, 712, 974
- Santerne et al. (2011) Santerne, A., Bonomo, A. S., Hébrard, G., Deleuil, M., Moutou, C., Almenara, J.-M., Bouchy, F., & Díaz, R. F. 2011, A&A, 536, 70
- Santos et al. (2004) Santos, N. C., Israelian, G., & Mayor, M. 2004, A&A, 415, 1153
- Schlaufman & Laughlin (2011) Schlaufman, K. C., & Laughlin, G. 2011, ApJ, 738, 177
- Skrutskie et al. (2006) Skrutskie, M. F., Cutri, R. M., Stiening, R, et al. 2006, AJ, 131, 1163
- Steffen et al. (2012) Steffen, J. H., Fabrycky, D. C., Ford, E. B., et al. 2012, arXiv:1201.5412
- Sato et al. (2005) Sato, B., Fischer, D. A., Henry, G. W., et al. 2005, ApJ, 633, 465
- Torres (2007) Torres, G. 2007, ApJ, 671, L65
- Torres et al. (2008) Torres, G., Winn, J. N., & Holman, M. J. 2008, ApJ, 677, 1324
- Udry & Santos (2007) Udry, S., & Santos, N. C. 2007, Annual Review of Astronomy and Astrophysics, 45, 397
- Welsh et al. (2012) Welsh, W. F., Orosz, J. A., Carter, J. A., et al. 2012, Nature, online (doi:10.1038/nature10768)


| KOI number111Kepler Object of Interest number | KIC number | error | KIC [M/H] | |
|---|---|---|---|---|
| K00005.01 | 8554498 | 0.037 | 0.0002 | 0.12 |
| K00010.01 | 6922244 | 0.091 | 0.0007 | 0.00 |
| K00012.01 | 5812701 | 0.087 | 0.0001 | -0.04 |
| K00020.01 | 11804465 | 0.117 | 0.0000 | -0.16 |
| K00022.01 | 9631995 | 0.092 | 0.0001 | 0.29 |
| K00063.01 | 11554435 | 0.057 | 0.0010 | 0.12 |
| K00064.01 | 7051180 | 0.040 | 0.0003 | -0.34 |
| K00082.01 | 10187017 | 0.034 | 0.0025 | 0.20 |
| K00089.02 | 8056665 | 0.022 | 0.0006 | 0.06 |
| K00094.01 | 6462863 | 0.070 | 0.0024 | -0.76 |
| K00094.03 | 6462863 | 0.038 | 0.0016 | -0.76 |
| K00097.01 | 5780885 | 0.078 | 0.0001 | 0.05 |
| K00098.01 | 10264660 | 0.053 | 0.0094 | -0.12 |
| K00100.01 | 4055765 | 0.045 | 0.0005 | -0.37 |
| K00102.01 | 8456679 | 0.030 | 0.0024 | -0.36 |
| K00105.01 | 8711794 | 0.039 | 0.0006 | -1.08 |
| K00113.01 | 2306756 | 0.066 | 0.0210 | 0.10 |
| K00127.01 | 8359498 | 0.097 | 0.0001 | 0.17 |
| K00128.01 | 11359879 | 0.101 | 0.0005 | 0.36 |
| K00131.01 | 7778437 | 0.075 | 0.0001 | 0.16 |
| K00135.01 | 9818381 | 0.080 | 0.0074 | 0.18 |
| K00137.01 | 8644288 | 0.043 | 0.0002 | 0.17 |
| K00137.02 | 8644288 | 0.062 | 0.0013 | 0.17 |
| K00138.01 | 8506766 | 0.094 | 0.0006 | -0.22 |
| K00139.01 | 8559644 | 0.058 | 0.0022 | 0.01 |
| K00144.01 | 4180280 | 0.035 | 0.0047 | 0.24 |
| K00161.01 | 5084942 | 0.029 | 0.0068 | 0.26 |
| K00183.01 | 9651668 | 0.122 | 0.0190 | -0.14 |
| K00186.01 | 12019440 | 0.118 | 0.0001 | 0.02 |
| K00187.01 | 7023960 | 0.142 | 0.0130 | 0.10 |
| K00188.01 | 5357901 | 0.108 | 0.0001 | 0.26 |
| K00189.01 | 11391018 | 0.133 | 0.0008 | -0.05 |
| K00190.01 | 5771719 | 0.112 | 0.0006 | 0.22 |
| K00191.01 | 5972334 | 0.115 | 0.0011 | -0.19 |
| K00192.01 | 7950644 | 0.090 | 0.0210 | -0.23 |
| K00193.01 | 10799735 | 0.129 | 0.0002 | -0.12 |
| K00194.01 | 10904857 | 0.134 | 0.0037 | -0.09 |
| K00195.01 | 11502867 | 0.114 | 0.0019 | -0.19 |
| K00196.01 | 9410930 | 0.097 | 0.0009 | 0.10 |
| K00197.01 | 2987027 | 0.091 | 0.0001 | 0.00 |
| K00199.01 | 10019708 | 0.093 | 0.0170 | 0.10 |
| K00200.01 | 6046540 | 0.083 | 0.0001 | 0.15 |
| K00201.01 | 6849046 | 0.072 | 0.0001 | 0.19 |
| K00202.01 | 7877496 | 0.102 | 0.0005 | 0.12 |
| K00203.01 | 10619192 | 0.130 | 0.0002 | 0.39 |
| K00204.01 | 9305831 | 0.076 | 0.0001 | -0.10 |
| K00205.01 | 7046804 | 0.092 | 0.0020 | -0.17 |
| K00206.01 | 5728139 | 0.063 | 0.0001 | -0.13 |
| K00208.01 | 3762468 | 0.089 | 0.0007 | 0.21 |
| K00209.01 | 10723750 | 0.069 | 0.0002 | -0.04 |
| K00211.01 | 10656508 | 0.081 | 0.0960 | 0.01 |
| K00212.01 | 6300348 | 0.064 | 0.0140 | -0.24 |
| K00214.01 | 11046458 | 0.111 | 0.0035 | 0.02 |
| K00216.01 | 6152974 | 0.065 | 0.0004 | 0.18 |
| K00217.01 | 9595827 | 0.134 | 0.0001 | 0.22 |
| K00229.01 | 3847907 | 0.049 | 0.0002 | 0.22 |
| K00242.01 | 3642741 | 0.056 | 0.0002 | 0.15 |
| K00254.01 | 5794240 | 0.184 | 0.0012 | 0.23 |
| K00256.01 | 11548140 | 0.123 | 0.0023 | 0.58 |
| K00261.01 | 5383248 | 0.027 | 0.0067 | 0.02 |
| K00345.01 | 11074541 | 0.035 | 0.0063 | 0.26 |
| K00348.01 | 11194032 | 0.038 | 0.0003 | 0.37 |
| K00351.01 | 11442793 | 0.083 | 0.0064 | -0.11 |
| K00351.02 | 11442793 | 0.059 | 0.0006 | -0.11 |
| K00353.01 | 11566064 | 0.064 | 0.0012 | -0.09 |
| K00356.01 | 11624249 | 0.033 | 0.0071 | -0.50 |
| K00367.01 | 4815520 | 0.044 | 0.0085 | -1.53 |
| K00368.01 | 6603043 | 0.085 | 0.0001 | -0.03 |
| K00372.01 | 6471021 | 0.081 | 0.0093 | -0.56 |
| K00375.01 | 12356617 | 0.077 | -0.13 | |
| K00377.01 | 3323887 | 0.078 | 0.0030 | 0.17 |
| K00377.02 | 3323887 | 0.084 | 0.0017 | 0.17 |
| K00398.01 | 9946525 | 0.092 | 0.0036 | 0.14 |
| K00401.01 | 3217264 | 0.041 | 0.0003 | 0.15 |
| K00401.02 | 3217264 | 0.043 | 0.0034 | 0.15 |
| K00410.01 | 5449777 | 0.102 | 0.0050 | -0.40 |
| K00412.01 | 5683743 | 0.053 | 0.0002 | -0.01 |
| K00415.01 | 6289650 | 0.062 | 0.0630 | -0.33 |
| K00417.01 | 6879865 | 0.097 | 0.0017 | -0.14 |
| K00418.01 | 7975727 | 0.115 | 0.0004 | -0.32 |
| K00419.01 | 8219673 | 0.091 | 0.0004 | -0.13 |
| K00421.01 | 9115800 | 0.115 | 0.0002 | -0.07 |
| K00422.01 | 9214713 | 0.138 | -0.30 | |
| K00423.01 | 9478990 | 0.085 | 0.0003 | -0.18 |
| K00425.01 | 9967884 | 0.133 | 0.0140 | 0.07 |
| K00428.01 | 10418224 | 0.056 | 0.0001 | -0.14 |
| K00433.01 | 10937029 | 0.049 | 0.0180 | 0.38 |
| K00433.02 | 10937029 | 0.113 | 0.0013 | 0.38 |
| K00458.01 | 7504328 | 0.077 | 0.0062 | -0.20 |
| K00464.01 | 8890783 | 0.067 | 0.0003 | 0.17 |
| K00469.01 | 9703198 | 0.061 | 0.0029 | -0.07 |
| K00523.01 | 8806123 | 0.063 | 0.0015 | -0.09 |
| K00552.01 | 5122112 | 0.097 | 0.0013 | -0.47 |
| K00554.01 | 5443837 | 0.069 | 0.0034 | -0.08 |
| K00607.01 | 5441980 | 0.075 | 0.0009 | -0.51 |
| K00609.01 | 5608566 | 0.089 | 0.0110 | -0.08 |
| K00611.01 | 6309763 | 0.073 | 0.0004 | -0.13 |
| K00617.01 | 9846086 | 0.177 | 0.0210 | 0.10 |
| K00620.01 | 11773022 | 0.072 | 0.0009 | -0.08 |
| K00622.01 | 12417486 | 0.073 | 0.0025 | -0.05 |
| K00625.01 | 4449034 | 0.062 | 0.0097 | -0.06 |
| K00633.01 | 4841374 | 0.028 | 0.0023 | -0.37 |
| K00674.01 | 7277317 | 0.038 | 0.0042 | 0.08 |
| K00680.01 | 7529266 | 0.060 | 0.0001 | -0.46 |
| K00684.01 | 7730747 | 0.041 | 0.0042 | -0.01 |
| K00686.01 | 7906882 | 0.108 | 0.0032 | -0.18 |
| K00716.01 | 9846348 | 0.061 | 0.0027 | -0.33 |
| K00725.01 | 10068383 | 0.083 | 0.0024 | -0.20 |
| K00728.01 | 10221013 | 0.099 | 0.0010 | 0.04 |
| K00737.01 | 10345478 | 0.064 | 0.0020 | -0.28 |
| K00741.01 | 10418797 | 0.242 | 0.0062 | 0.06 |
| K00743.01 | 10464078 | 0.087 | 0.0210 | -0.56 |
| K00745.01 | 10485250 | 0.092 | 0.0006 | -0.20 |
| K00753.01 | 10811496 | 0.102 | 0.0072 | -0.13 |
| K00760.01 | 11138155 | 0.107 | 0.0008 | 0.01 |
| K00763.01 | 11242721 | 0.110 | 0.0009 | -0.13 |
| K00764.01 | 11304958 | 0.047 | 0.0004 | 0.23 |
| K00767.01 | 11414511 | 0.128 | 0.0008 | 0.02 |
| K00771.01 | 11465813 | 0.124 | -0.11 | |
| K00772.01 | 11493732 | 0.070 | 0.0044 | 0.00 |
| K00774.01 | 11656840 | 0.143 | 0.0004 | -0.31 |
| K00779.01 | 11909839 | 0.109 | 0.0210 | -0.55 |
| K00782.01 | 11960862 | 0.048 | 0.0930 | -0.31 |
| K00791.01 | 12644822 | 0.071 | 0.0003 | -0.01 |
| K00797.01 | 3115833 | 0.077 | 0.0007 | -0.52 |
| K00801.01 | 3351888 | 0.081 | 0.0130 | 0.18 |
| K00802.01 | 3453214 | 0.135 | 0.0049 | -0.41 |
| K00805.01 | 3734868 | 0.119 | 0.0095 | -0.10 |
| K00806.01 | 3832474 | 0.093 | 0.0073 | -0.10 |
| K00806.02 | 3832474 | 0.125 | 0.0005 | -0.10 |
| K00809.01 | 3935914 | 0.114 | 0.0650 | -0.39 |
| K00813.01 | 4275191 | 0.085 | 0.0003 | -0.28 |
| K00815.01 | 4544670 | 0.101 | 0.0130 | -0.16 |
| K00822.01 | 5077629 | 0.128 | 0.0015 | -0.40 |
| K00823.01 | 5115978 | 0.075 | 0.0015 | -0.43 |
| K00824.01 | 5164255 | 0.122 | 0.0013 | -0.21 |
| K00830.01 | 5358624 | 0.134 | 0.0001 | 0.15 |
| K00838.01 | 5534814 | 0.072 | 0.0010 | -0.10 |
| K00840.01 | 5651104 | 0.096 | 0.0031 | -0.09 |
| K00843.01 | 5881688 | 0.053 | 0.0049 | 0.20 |
| K00846.01 | 6061119 | 0.166 | 0.0008 | -0.52 |
| K00847.01 | 6191521 | 0.054 | 0.0330 | -0.57 |
| K00850.01 | 6291653 | 0.092 | 0.0042 | -0.19 |
| K00851.01 | 6392727 | 0.056 | 0.0007 | -0.12 |
| K00855.01 | 6522242 | 0.138 | 0.0002 | -0.46 |
| K00856.01 | 6526710 | 0.140 | 0.0025 | -0.15 |
| K00858.01 | 6599919 | 0.091 | 0.0027 | -0.25 |
| K00865.01 | 6862328 | 0.074 | 0.0360 | -0.09 |
| K00868.01 | 6867155 | 0.161 | 0.0025 | -0.71 |
| K00871.01 | 7031517 | 0.208 | 0.0044 | -0.40 |
| K00872.01 | 7109675 | 0.084 | 0.0027 | -0.11 |
| K00876.01 | 7270230 | 0.144 | 0.0066 | -0.12 |
| K00878.01 | 7303253 | 0.041 | 0.0031 | -0.27 |
| K00880.02 | 7366258 | 0.055 | 0.0004 | -0.01 |
| K00882.01 | 7377033 | 0.151 | 0.0015 | -1.24 |
| K00883.01 | 7380537 | 0.167 | 0.0005 | -0.37 |
| K00889.01 | 757450 | 0.114 | 0.0003 | -0.09 |
| K00890.01 | 7585481 | 0.077 | 0.0003 | 0.03 |
| K00895.01 | 7767559 | 0.107 | 0.0011 | -0.26 |
| K00897.01 | 7849854 | 0.109 | 0.0001 | 0.27 |
| K00902.01 | 8018547 | 0.080 | 0.0007 | -0.50 |
| K00903.01 | 8039892 | 0.077 | 0.0002 | -0.32 |
| K00908.01 | 8255887 | 0.081 | 0.0002 | 0.13 |
| K00913.01 | 8544996 | 0.122 | 0.0049 | -0.28 |
| K00918.01 | 8672910 | 0.111 | 0.0003 | -0.07 |
| K00929.01 | 9141746 | 0.078 | 0.0002 | 0.14 |
| K00931.01 | 9166862 | 0.116 | 0.0075 | 0.32 |
| K00941.01 | 9480189 | 0.043 | 0.0005 | 0.32 |
| K00941.03 | 9480189 | 0.052 | 0.0120 | 0.32 |
| K00951.01 | 9775938 | 0.046 | 0.0120 | 0.41 |
| K00956.01 | 9875711 | 0.044 | 0.0170 | 0.39 |
| K00960.01 | 8176650 | 0.183 | 0.0005 | -0.09 |
| K00972.01 | 11013201 | 0.019 | 0.0025 | -0.06 |
| K00981.01 | 8607720 | 0.013 | 0.0012 | -0.11 |
| K00988.01 | 2302548 | 0.033 | 0.0021 | 0.14 |
| K01003.01 | 2438502 | 0.141 | 0.0007 | -0.09 |
| K01005.01 | 5780460 | 0.062 | 0.0430 | -0.21 |
| K01089.01 | 3247268 | 0.083 | 0.0003 | -0.13 |
| K01089.02 | 3247268 | 0.049 | 0.0060 | -0.13 |
| K01159.01 | 10354039 | 0.054 | 0.0039 | 0.29 |
| K01176.01 | 3749365 | 0.157 | 0.0003 | 0.38 |
| K01177.01 | 3547091 | 0.130 | 0.0030 | -0.57 |
| K01193.01 | 3942446 | 0.106 | 0.0380 | -0.53 |
| K01208.01 | 3962440 | 0.060 | -0.20 | |
| K01221.02 | 3640905 | 0.012 | 0.0059 | 0.42 |
| K01227.01 | 6629332 | 0.120 | 0.0013 | -0.20 |
| K01241.01 | 6448890 | 0.020 | 0.0039 | 0.16 |
| K01241.02 | 6448890 | 0.013 | 0.0051 | 0.16 |
| K01242.01 | 6607447 | 0.058 | 0.0006 | 0.00 |
| K01257.01 | 8751933 | 0.080 | 0.0005 | -0.18 |
| K01261.01 | 8678594 | 0.064 | 0.0005 | 0.12 |
| K01268.01 | 8813698 | 0.074 | -0.07 | |
| K01285.01 | 10599397 | 0.081 | 0.0029 | -0.09 |
| K01288.01 | 10790387 | 0.084 | 0.0005 | -0.20 |
| K01299.01 | 10864656 | 0.026 | 0.0002 | -0.24 |
| K01335.01 | 4155328 | 0.040 | 0.0210 | -0.28 |
| K01353.01 | 7303287 | 0.102 | 0.0011 | -0.08 |
| K01385.01 | 9278553 | 0.198 | 0.0003 | -0.32 |
| K01391.01 | 8958035 | 0.079 | 0.0016 | -0.21 |
| K01419.01 | 11125936 | 0.053 | 0.0035 | -0.29 |
| K01426.02 | 11122894 | 0.067 | 0.0028 | -0.12 |
| K01459.01 | 9761199 | 0.075 | 0.0010 | 0.10 |
| K01474.01 | 12365184 | 0.062 | 0.0005 | -0.33 |
| K01477.01 | 7811397 | 0.122 | 0.00 | |
| K01486.01 | 7898352 | 0.094 | -0.24 | |
| K01540.01 | 5649956 | 0.197 | 0.0011 | -0.44 |
| K01543.01 | 5270698 | 0.148 | 0.0003 | -0.24 |
| K01546.01 | 5475431 | 0.101 | 0.0008 | 0.12 |
| K01553.01 | 7951018 | 0.069 | 0.0006 | 0.21 |
| K01557.01 | 5371776 | 0.039 | 0.0350 | 0.52 |
| K01561.01 | 4940438 | 0.052 | 0.0016 | -0.60 |
| K01574.01 | 10028792 | 0.062 | 0.0003 | 0.05 |
| K01587.01 | 9932970 | 0.080 | 0.0067 | -0.08 |
| Name | KIC number | Spectroscopic [Fe/H] | Reference |
|---|---|---|---|
| TrES-2 host star | 11446443 | Torres et al. (2008) | |
| Kepler-4 | 11853905 | Borucki et al. (2010) | |
| Kepler-7 | 5780885 | Latham et al. (2010) | |
| Kepler-8 | 6922244 | Jenkins et al. (2010) | |
| Kepler-9 | 3323887 | Holman et al. (2010) | |
| Kepler-10 | 11904151 | Batalha et al. (2011) | |
| Kepler-11 | 6541920 | Lissauer et al. (2011) | |
| Kepler-12 | 11804465 | Fortney et al. (2011) | |
| Kepler-14 | 10264660 | Buchhave et al. (2011) | |
| Kepler-15 | 11359879 | Endl et al. (2011) | |
| Kepler-16AB | 12644769 | Doyle et al. (2011) | |
| Kepler-17 | 10619192 | Bonomo et al. (2011) | |
| Kepler-18 | 8644288 | Cochran et al. (2011) | |
| Kepler-19 | 2571238 | Ballard et al. (2011) | |
| Kepler-20 | 6850504 | Fressin et al. (2011) | |
| Kepler-22 | 10593626 | Borucki et al. (2012b) | |
| Kepler-23 | 11512246 | Ford et al. (2012) | |
| Kepler-26 | 9757613 | Steffen et al. (2012) | |
| Kepler-27 | 5792202 | Steffen et al. (2012) | |
| Kepler-30 | 3832474 | Fabrycky et al. (2012) | |
| Kepler-34AB | 8572936 | Welsh et al. (2012) | |
| Kepler-35AB | 9837578 | Welsh et al. (2012) | |
| KOI-135 | 9818381 | Bonomo et al. (2011) | |
| KOI-196 | 9410930 | Santerne et al. (2011) | |
| KOI-204 | 9305831 | Bonomo et al. (2011) | |
| KOI-254 | 5794249 | Johnson et al. (2011) | |
| KOI-423 | 9478990 | Bouchy et al. (2011) | |
| 6185331 | Fischer et al. (2012) |