Growing transverse oscillations of a multistranded loop observed by SDO/AIA
Abstract
The first evidence of transverse oscillations of a multistranded loop with growing amplitudes and internal coupling observed by the Atomspheric Imaging Assembly (AIA) onboard the Solar Dynamics Observatory (SDO) is presented. The loop oscillation event occurred on 2011 March 8, triggered by a CME. The multiwavelength analysis reveals the presence of multithermal strands in the oscillating loop, whose dynamic behaviors are temperature-dependent, showing differences in their oscillation amplitudes, phases and emission evolution. The physical parameters of growing oscillations of two strands in 171 Å are measured and the 3-D loop geometry is determined using STEREO-A/EUVI data. These strands have very similar frequencies, and between two 193 Å strands a quarter-period phase delay sets up. These features suggest the coupling between kink oscillations of neighboring strands and the interpretation by the collective kink mode as predicted by some models. However, the temperature dependence of the multistarnded loop oscillations was not studied previously and needs further investigation. The transverse loop oscillations are associated with intensity and loop width variations. We suggest that the amplitude-growing kink oscillations may be a result of continuous non-periodic driving by magnetic deformation of the CME, which deposits energy into the loop system at a rate faster than its loss.
Subject headings:
Sun: Flares — Sun: corona — Sun: oscillations — waves — Sun: UV radiation1. Introduction
Transverse coronal loop oscillations have been extensively studied in both observation and theory (see recent reviews by Aschwanden, 2009; Terradas, 2009; Ruderman & Erdélyi, 2009). Observations from TRACE and STEREO/EUVI show that these oscillations are triggered by a flare or a coronal mass ejection (CME) (e.g., Aschwanden et al., 2002; Aschwanden, 2009). They have been interpreted as fast standing magnetohydrodynamic (MHD) kink modes (Aschwanden, 1999; Nakariakov et al., 1999). Transverse loop oscillations are often observed with a rapid decay within several periods (Nakariakov et al., 1999; Aschwanden et al., 2002; White & Verwichte, 2012). Sometimes the undamped oscillations are observed (Aschwanden et al., 2002; Aschwanden & Schrijver, 2011). It has been suggested that the expected damping is balanced by amplification due to cooling (Ruderman, 2011a, b, c). Moreover, transverse oscillations are observed not only in single loops but also in a bundle of loops (Verwichte et al., 2004; Ofman & Wang, 2008; Verwichte et al., 2009; Aschwanden & Schrijver, 2011). Recent theories have shown that the global kink mode still exists in models with multiple strands, but its transverse dynamics are influenced by the internal fine structure due to the coupling and phase mixing of neighboring strands in properties such as the frequency and damping (Ofman, 2005, 2009; Luna et al., 2008, 2009, 2010; Terradas et al., 2008; Van Doorsselaere et al., 2008). These studies have significantly contributed to the progress of coronal seismology, a diagnostic tool to probe the physical parameters in the corona (e.g., Nakariakov & Verwichte, 2005).
Here we present the first example of transverse oscillations of a multistranded loop observed by the Atmospheric Imaging Assembly (AIA) on the Solar Dynamics Observatory (SDO), showing the evidence for growing amplitudes and the internal coupling.
2. Observations
The oscillation event occurred on 2011 March 8, 19:4020:40 UT in AR 11165 on the limb, observed with SDO/AIA. An M1.5 GOES-class flare associated with a CME and a surge were also observed during this time. The AIA records continuous images of the full Sun with 1.5 resolution and 12 s cadence (Lemen et al., 2011). This flare-CME event was first studied by Su et al. (2012) using AIA, STEREO-A and RHESSI data. We present the analysis of loop oscillations using data from four AIA bands, 171, 193, 211, and 304 Å, as well as STEREO-A/EUVI data.
3. Results
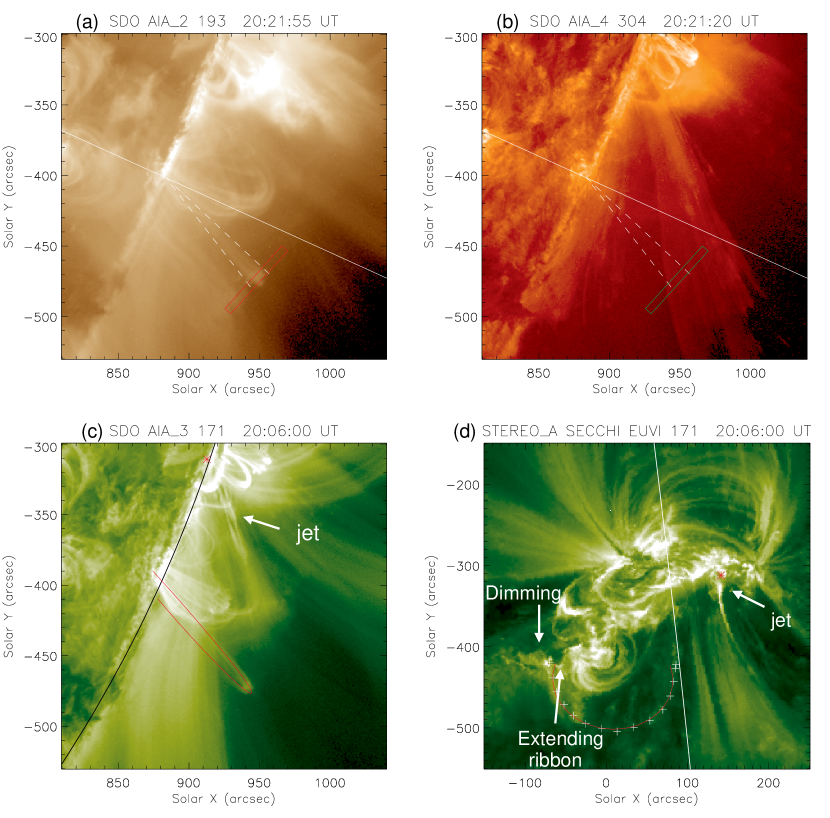
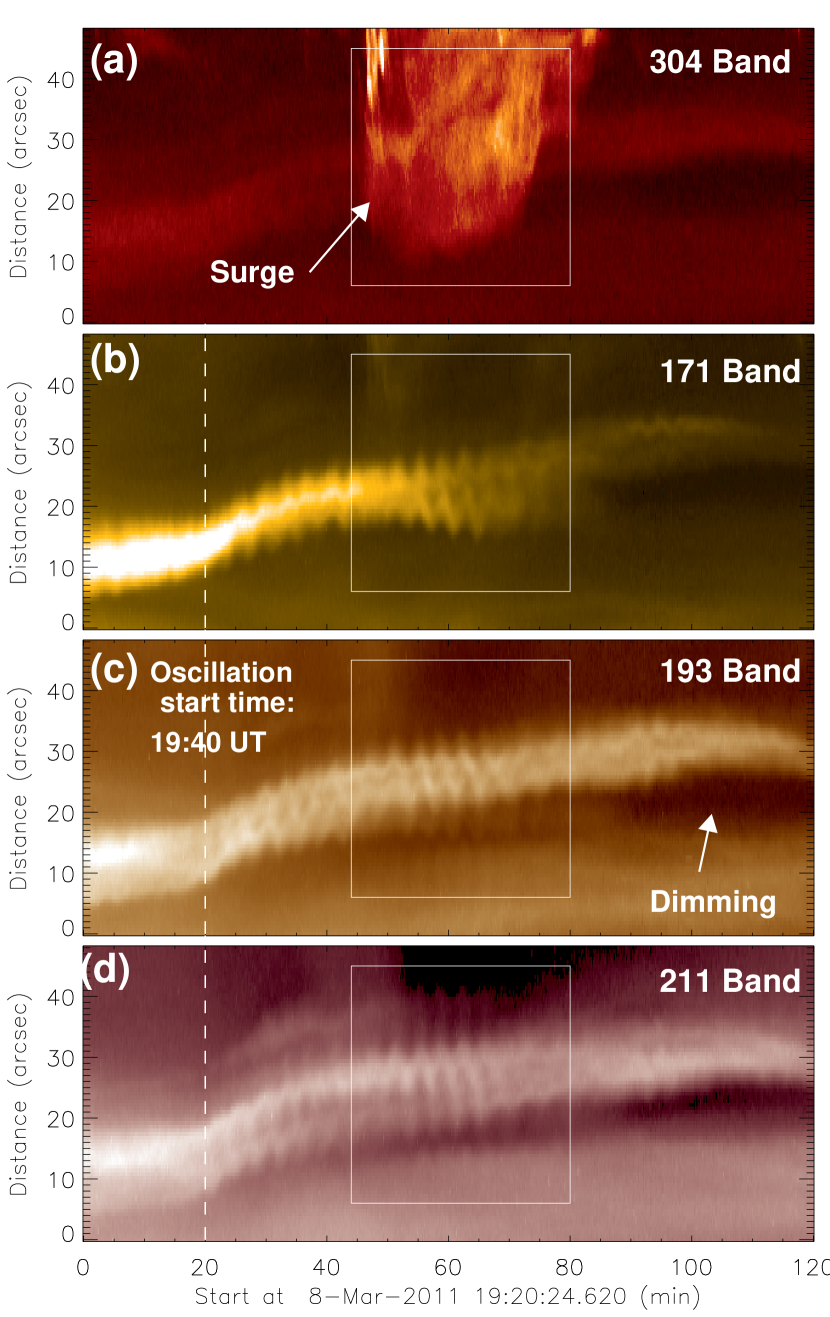
The oscillating loop is visible in AIA 171, 193 and 211 Å bands (Figure 1). The loop plane is almost parallel to the line-of-sight. In the 304 Å, a surge was observed passing by the loop, and could have triggered its oscillations (Figure 1(b)). The surge began at 19:55 UT with the velocity of 170230 km s-1, and the ejected material fell back on the Sun at 20:30 UT at about 80 km s-1. However, the STEREO-A observations viewing the AR at the disk center show that this surge was not directly related to the loop oscillation. Figure 2 shows the flux evolution of the four bands along a cut at the loop’s apex. The loop started to oscillate at about 19:40 UT with a rapid drift towards the north (flare source). The start time of oscillations is consistent with the CME acceleration time (see Su et al., 2012). The oscillations became evident during the period of the surge. In this period, the loop in 171 Å gradually split into two strands manifesting the unusual oscillations with growing amplitudes. The loop in 193 and 211 Å, composed of several close strands, shows the oscillations with no clear change in amplitude. The difference of these strands in spatial distribution and temporal evolution indicates that the loop consists of the multithermal structure. The lower 171 Å strand disappeared after the surge, while a dimming formed in 193 and 211 Å. This may suggest that parts of the loop erupted. The upper branch of the loop dimmed slowly in 171 Å, while remained bright in 193 and 211 Å, suggesting possible heating.
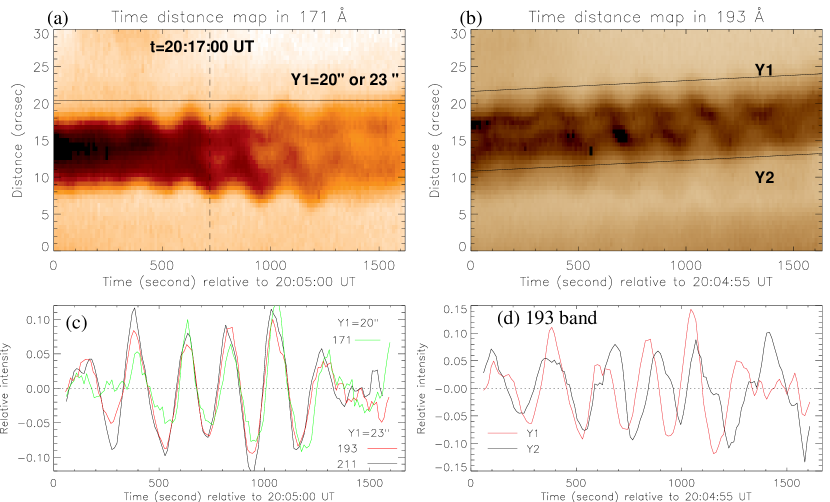
We examine the phase relation between the oscillations of different strands. Figure 3(a) shows the oscillations of two 171 Å strands almost in phase (see also Figure 4(a)). Figure 3(b) shows the oscillations of two 193 Å strands initially in phase, but becoming shifted by a quarter-period after two periods. This behavior can be clearly seen from a comparison of the intensity evolution at two locations (with a linear drift of 1 km s-1) near the displacement maxima of the strands (Figure 3(d)). For the upper strand, the oscillation period is estimated to be 25866 s for the initial phase, and 21615 s for the later phase, while for the lower strand, the period is 29422 s for the initial phase, and 21683 s for the later phase, where the periods are measured from the average of time intervals of the intensity peaks and the errors the standard deviation. This evolution suggests the setup of collective oscillation between the two neighboring strands, which has a slightly shorter period than before the coupling. Figure 3(c) compares the flux evolution in three bands at the location (Y1) near the upper strands, where Y1=20 in 171 Å and Y1=23 in 193 and 211 Å considering their slight offsets in position. It shows that the upper strands seen in the three bands oscillated with similar periods and nearly in phase. The oscillations of these strands with certain phase shifts and the similar frequencies suggest collective dynamics of a multistranded loop system (Luna et al., 2008, 2009).
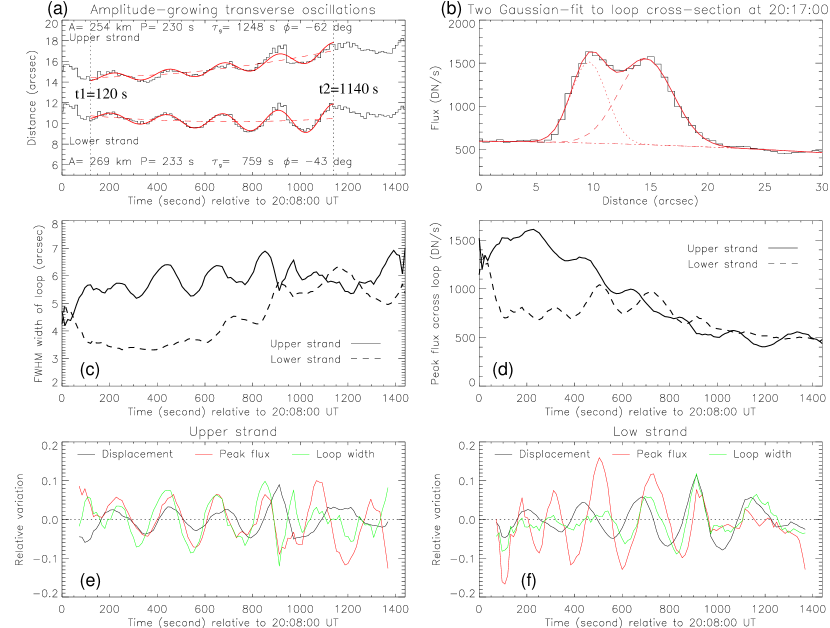
We measure the time variation of oscillation amplitudes for two 171 Å strands by locating the cross-sectional flux maxima using a double Gaussian best fit with a parabolic background. Figure 4(b) shows an example for the fitting of emission profile across the loop. The measured loop displacements, FWHM width, and cross-sectional peak flux as a function of time are shown in Figures 4 (a), (c), and (d), respectively. The upper strand has the average FWHM diameter of 4.20.4 Mm, and the lower strand has that of 3.30.7 Mm. By fitting the displacement oscillations with an amplitude-growing sine function with a parabolic drift given by,
| (1) |
we determine the parameters of the oscillation: amplitude (), period (), phase (), and amplitude growth time scale (), where is the start time of analyzed oscillations. The measured parameters are shown on the plots and listed in Table 1. The growing oscillations of the two strands started and ended almost simultaneously, lasting over four periods. The lower strand has higher growth rate of the oscillation amplitude than the upper one. We estimate the increase in their amplitudes by =3.8 for the lower strand, and =2.3 for the upper strand using = with the life time =1020 s.
| Loop | |||||||
|---|---|---|---|---|---|---|---|
| (s) | (Mm) | (s) | (∘) | (Mm) | (Mm) | ||
| upper | 230 | 0.254 | 1248 | 62 | 2.3 | 4.20.4 | 77 |
| lower | 233 | 0.269 | 759 | 43 | 3.8 | 3.30.7 | 77 |
The displacement oscillations are found in association with intensity and loop width fluctuations. Figures 4(e) and (f) show comparisons between the relative displacement, cross-sectional peak flux, and loop width time variations, where a 290 s smoothed trend for all parameters has been subtracted, the relative displacements are normalized to a scale of 7 Mm, and the relative peak flux and loop width are normalized to their smoothed trend. An inphase relationship is found between the loop width and intensity fluctuations (with relative amplitudes of 5%15%) for both strands. The phase relationship between displacement and intensity oscillations is different for the two strands, being in-phase for the upper strand and a quarter-period shift for the lower strand.
To determine the trigger of the oscillation and measure the loop geometry, we analyze the STEREO-A observations (Figure 1(d)). A jet which corresponds to the surge in AIA 304 Å band can be easily identified, whereas the direct identification of the oscillating loop in STEREO/EUVI images is not obvious due to the low (75 s) cadence. We use the following procedure to locate the oscillating loop. First we speculate that a faint loop (outlined in Figure 1(d)) is the target based on its evolutionary features. The movies (available in online version of this letter) show that this loop was apparently shrinking in STEREO/EUVI, suggesting a correspondence to the change in inclination of the oscillating loop in SDO/AIA. In addition, this STEREO loop dimmed simultaneously as the AIA loop (at about 20:40 UT). Next we model this STEREO loop with a 3D arc and map it onto the AIA view to compare with the observation. The method is similar to that used by Aschwanden et al. (2002). A circular loop model is made by optimizing two free parameters, and , where is the height of the circular loop center above the solar surface and is the inclination angle of the loop plane to vertical. The fact that the best fit loop model, when mapped to the AIA view, matches the observation confirms the initial conjecture. The calculated loop parameters are =18 Mm, =24∘, the curvature radius =59 Mm, and the loop length =212 Mm. Taking the period =230 s, we estimate the phase speed of the oscillations in the fundamental mode, =2L/P=1840 km s-1. For the kink mode (Roberts et al., 1984), we obtain the Alfvén speed =1360 km s-1 if assuming the phase speed () equal to the kink speed () and the loop density contrast of 10, and estimate the average magnetic field in the loop, =620 G, for typical coronal loop densities ( cm-3).
The STEREO-A observations suggest that the loop oscillation was triggered by the CME but not the surge/jet. The EUVI 171, 195 and 284 Å bands observed the eruption of a large flux rope at 19:40 UT, which appeared as a CME at 21:12 UT in SOHO/LASCO C2. In 171 Å a bright ribbon appeared at about 20:00 UT, and extended towards the left footpoint of the oscillating loop, followed by the formation of a dimming region (Figure 1(d), and movies in online version). The dimmings observed in the EUV and/or soft X-ray range were interpreted as the coronal plasma evacuation at the footpoints of a magnetic flux rope when it rapidly opens or expands (e.g., Sterling & Hudson, 1997; Wang et al., 2002). The presence of a bright ribbon at the boundary of the extending dimming region has not been reported previously in literature. We suggest that it could be caused by interaction (via local reconnection) between the expanding magnetic fields of the CME and the ambient closed magnetic loops. Imada et al. (2007) found the temperature-dependent strong upflows (up to 150 km s-1) at the boundary of the dimming region with Hinode/EIS, supporting this suggestion. Therefore, continuous magnetic interaction by the CME may drive the loop oscillation with growing amplitudes, and also lead to the heating (e.g. by hot outflows) and partial eruption of the oscillating loop, as observed. This scenario is also supported by a coincidence of the flux rope eruption with the excitation of the loop oscillations in time (at 19:40 UT).
4. Summary and Discussion
The SDO/AIA observations of transverse loop oscillations analyzed have revealed several interesting new features. The loop consists of multithermal strands, whose dynamical behaviors are temperature-dependent. In the 171 Å band, two strands show in-phase oscillations with growing amplitudes and a separating drift. Their displacement oscillations are associated with the intensity variations. In the 193 Å band, two close strands show the oscillations with no clear amplitude change and a quarter-period phase delay has developed between them after a time of about two periods. The oscillations of these strands have very similar periods.
The flare-excited transverse loop oscillations observed by TRACE have been interpreted as eigenmodes (mainly the fundamental kink mode) (Nakariakov et al., 1999; Aschwanden et al., 2002). These oscillations typically show the strong damping, which has been suggested due to resonant absorption or wave leakage (see reviews by Roberts, 2000; Ruderman & Erdélyi, 2009). The unusual growing oscillations reported here suggest that they may be forced kink oscillations with continuous energy input at a rate faster than the damping. The STEREO-A observations suggest that continuous interaction from the erupted flux rope in a CME may play the role of the external driver. A theoretical study by Ballai et al. (2008) showed that a harmonic driver typically excites a mixture of standing kink modes harmonics (with both the driver’s and the natural periods). The oscillations analyzed here show mostly a single frequency. This feature does not agree with the harmonic driver, and suggests the excitation by a continuous non-harmonic driver. However, we notice that the timing of the amplitude-increasing oscillations is coincident with both the CME dimming formation near the loop footpoint and the emergence of the surge. Although the flux rope eruption as the driver of the oscillations is the preferred interpretation as discussed in the last section, the possibility that the surge also could play a role in reinforcing the oscillations cannot be entirely excluded. Recently, quasi-periodic fast mode magnetosonic waves with a propagation speed of more than 2000 km s-1 and a total duration about 30 minutes were discovered by SDO/AIA (Liu et al., 2011; Ofman et al., 2011). Whether such waves were produced by the surge and could have driven the amplification of oscillations needs further investigations observationally and theoretically.
Some studies have suggested that the loop cooling can strongly affect the kink oscillations (Aschwanden & Terradas, 2008; Morton & Erdélyi, 2009). Recently, an undamped kink oscillation event was observed by SDO/AIA (Aschwanden & Schrijver, 2011), and the lack of damping has been attributed to the cooling which can amplify the oscillation (Ruderman, 2011a, b, c). Note that for an unrealistic assumption, Morton & Erdélyi (2009) obtained that cooling causes the damping of kink oscillations (Ruderman, 2011a). Our discussion below based on the models developed by Ruderman (2011a) suggests that the growing oscillations reported here cannot be explained by changes of the loop temperature with time. For the sake of present discussion, we assume that the decrease of the loop intensity in the 171 Å band is due to the cooling (although our analysis above suggests heating of the loop strands). Considering the role of wave damping, the measured amplitude growth time () should be the upper limit of the amplification time () due to the cooling. From the measured loop height (=77 Mm), we obtain the parameter, =, where is the atmospheric scale height for the initial loop plasma temperature of about 1 MK. For the loop model with =2 and 0.1 (the ratio of the loop external and internal plasma densities), we obtain from the dependence of the oscillation amplitude on time for the model of stratified loop with constant temperature of external plasma (Equation (38) and the corrected Figure 7 in Ruderman, 2011a, b), where is the loop cooling time. Since , we obtain 1.4 and 0.8 for the upper and lower threads, respectively. This means that the cooling must be very fast with the characteristic cooling time less than the oscillation period. For such a rapid cooling the oscillating loop should become completely invisible in the 171 Å band after two periods, and the oscillation should show a dramatic () decrease in period over the lifetime (Morton & Erdélyi, 2009; Ruderman, 2011a). However, neither theoretical predictions are consistent with present observations. For the same reason the undamped oscillations observed in the 193 Å band are also impossible to interpret by the cooling effect when the typical finite damping rate by resonant absorption is considered (Ruderman, 2011c). This disagreement supports our suggestion that the wave energy in the loop is supplied continuously during the oscillations in our case, in contrast with the initial impulsive excitation suggested by the typical damping scenario of resonant absorption.
The above discussions are based on the properties of monolithic tube models, whereas in our case the oscillating loop consists of multithermal strands, thus the interpretation of their dynamic behaviors may need to consider the properties of coupled multi-stranded loop models (e.g. Ofman, 2009; Luna et al., 2009). Our observations show kink oscillations of several loop strands with similar frequencies and phase shift of in-phase or quarter-period, providing the evidence for a collective kink mode (Luna et al., 2009). Luna et al. (2008) showed the simultaneous excitation of several collective normal modes can lead to a /2 phase difference between two neighboring loops and the beating of the system in some cases. The setup of a quarter-period phase shift between two 193 Å strands may belong to such a case. We notice that after the coupling the two 193 Å strands oscillate with a period slightly shorter (by 20%) than before (assumed to be the kink-mode period of the individual loops). This feature also agrees with the model-prediction (see Equation (9) in Luna et al., 2008) when the two loops are very close (with the similar separation as observed). It is unclear whether the amplitude-growing oscillations of the 171 Å strands are due to the particular combination of collective normal modes excited in certain condition as no beating behavior was found as predicted (Luna et al., 2008, 2010). In addition, our observations show the evident temperature dependence of multistanded loop oscillations, which were not studied in previous models.
The association of loop displacement oscillations with intensity and loop width variations is found in this study. However, the positive correlation between the loop width and intensity variations suggests that the loop width variations may be observational artifacts due to the line-of-sight intensity variations. Assuming the mass conservation in the loop, an anti-correlation between them (ie., , where is the loop intensity, and the loop diameter) is predicted theoretically (Aschwanden & Schrijver, 2011). The associated intensity oscillations could be due to variations in the line-of-sight column depth of the oscillating loop as suggested in some previous studies (Cooper et al., 2003; Verwichte et al., 2009, 2010; White & Verwichte, 2012), but this conjecture needs a forward modeling to confirm.
References
- Aschwanden & Terradas (2008) Aschwanden, M. J., & Terradas, J. 2008, ApJ, 686, L127
- Aschwanden (2009) Aschwanden, M. J. 2009, Space Sci. Rev. 149, 31
- Aschwanden (1999) Aschwanden, M. J., Fletcher, L., Schrijver, C. J., & Alexander, D. 1999, ApJ, 520, 880
- Aschwanden et al. (2002) Aschwanden, M. J., Pontieu, B. D., Schrijver, C. J., & Title, A. 2002, Sol. Phys., 206, 99
- Aschwanden & Schrijver (2011) Aschwanden, M. J., & Schrijver, C. J. 2011, ApJ, 736, 102
- Ballai et al. (2008) Ballai, I., Douglas, M., & Marcu, A. 2008, A&A, 488, 1125
- Cooper et al. (2003) Cooper, F. C., Nakariakov, V. M., & Tsiklauri, D. 2003, A&A, 397, 765
- Imada et al. (2007) Imada, S., Hara, H., Watanabe, T., et al. 2007, Publ. Astron. Soc. Japan, 59, S793
- Lemen et al. (2011) Lemen, J. R., Title, A. M., Akin, D. J., et al. 2011, Sol. Phys., 172
- Liu et al. (2011) Liu, W., Title, A. M., Zhao, J., et al. 2011, ApJ, 736, L13
- Luna et al. (2008) Luna, M., Terradas, J., Oliver, R., & Ballester, J. L. 2008, ApJ, 676, 717
- Luna et al. (2009) Luna, M., Terradas, J., Oliver, R., & Ballester, J. L. 2009, ApJ, 692, 1582
- Luna et al. (2010) Luna, M., Terradas, J., Oliver, R., & Ballester, J. L. 2010, ApJ, 716, 1371
- Morton & Erdélyi (2009) Morton, R. J., & Erdélyi, R. 2009, ApJ, 707, 750
- Nakariakov et al. (1999) Nakariakov, V. M., Ofman, L., DeLuca, E. E., Roberts, B., & Davila, J. M. 1999, Science, 285, 862
- Nakariakov & Verwichte (2005) Nakariakov, V. M., & Verwichte, E. 2005, Living Reviews in Solar Physics, 2, 3, (http://www.livingreviews.org/lrsp-2005-3)
- Ofman (2005) Ofman, L. 2005, Adv. Space Res., 36, 1572
- Ofman (2009) Ofman, L. 2009, ApJ, 694, 502
- Ofman & Wang (2008) Ofman, L. & Wang, T. J. 2008, A&A, 482, L9
- Ofman et al. (2011) Ofman, L., Liu, W., Title, A., & Aschwanden, M. J. 2011, ApJ, 740, L33O
- Roberts et al. (1984) Roberts, B., Edwin, P. M., & Benz, A. O. 1984, ApJ, 279, 857
- Roberts (2000) Roberts, B. 2000, Sol. Phys., 193, 139
- Ruderman & Erdélyi (2009) Ruderman, M. S., & Erdélyi, R. 2009, Space Sci. Rev. 149, 199
- Ruderman (2011a) Ruderman, M. S. 2011a, Sol. Phys., 271, 41
- Ruderman (2011b) Ruderman, M. S. 2011b, Sol. Phys., 271, 55
- Ruderman (2011c) Ruderman, M. S. 2011c, A&A, 534, A78
- Sterling & Hudson (1997) Sterling, A. C., & Hudson, H. S. 1997, ApJ, 491, L55
- Su et al. (2012) Su, Y., Dennis, B. R., Holman, G., et al. 2012, ApJ, 746, L5
- Terradas et al. (2008) Terradas, J., Arregui, I., Oliver, R., et al. 2008, ApJ, 679, 1611
- Terradas (2009) Terradas, J. 2009, Space Sci. Rev. 255, 149
- Van Doorsselaere et al. (2008) Van Doorsselaere, T., Ruderman, M. S., & Robertson, D. 2008, A&A, 485, 849
- Verwichte et al. (2004) Verwichte, E., Nakariakov, V. M., Ofman, L., & Deluca, E. E. 2004, Sol. Phys., 223, 77
- Verwichte et al. (2009) Verwichte, E., Aschwanden, M. J., Van Doorsselaere, T., Foullon, C., & Nakariakov, V. M. 2009, ApJ, 698, 397
- Verwichte et al. (2010) Verwichte, E., Foullon, C., & Van Doorsselaere, T. 2010, ApJ, 717, 458
- Wang et al. (2002) Wang, T. J., Yan, Y. Wang, J.-L., Kurokawa, H., & Shibata, K. 2002, ApJ, 572, 580
- White & Verwichte (2012) White, R. S., & Verwichte, E. 2012, A&A, 537, 49