PHENIX Collaboration
Nuclear-Modification Factor for Open-Heavy-Flavor Production at Forward Rapidity in CuCu Collisions at GeV
Abstract
Background: Heavy-flavor production in + collisions is a good test of perturbative-quantum-chromodynamics (pQCD) calculations. Modification of heavy-flavor production in heavy-ion collisions relative to binary-collision scaling from + results, quantified with the nuclear-modification factor (), provides information on both cold- and hot-nuclear-matter effects. Midrapidity heavy-flavor measurements at RHIC have challenged parton-energy-loss models and resulted in upper limits on the viscosity/entropy ratio that are near the quantum lower bound. Such measurements have not been made in the forward-rapidity region.
Purpose: Determine transverse-momentum, spectra and the corresponding for muons from heavy-flavor mesons decay in + and CuCu collisions at GeV and .
Method: Results are obtained using the semi-leptonic decay of heavy-flavor mesons into negative muons. The PHENIX muon-arm spectrometers measure the spectra of inclusive muon candidates. Backgrounds, primarily due to light hadrons, are determined with a Monte-Carlo calculation using a set of input hadron distributions tuned to match measured-hadron distributions in the same detector and statistically subtracted.
Results: The charm-production cross section in + collisions at GeV, integrated over and in the rapidity range is found to be mb. This result is consistent with a perturbative fixed-order-plus-next-to-leading-log (FONLL) calculation within scale uncertainties and is also consistent with expectations based on the corresponding midrapidity charm-production cross section measured by PHENIX. The for heavy-flavor muons in CuCu collisions is measured in three centrality intervals for GeV/. Suppression relative to binary-collision scaling () increases with centrality.
Conclusions: Within experimental and theoretical uncertainties, the measured heavy-flavor yield in + collisions is consistent with state-of-the-art pQCD calculations. Suppression in central CuCu collisions suggests the presence of significant cold-nuclear-matter effects and final-state energy loss.
pacs:
25.75.DwI Introduction
Understanding the energy loss mechanism for partons moving through the hot dense partonic matter produced in heavy-ion collisions at the Relativistic Heavy Ion Collider (RHIC) and the Large Hadron Collider (LHC) is a key priority in the field of heavy-ion collision physics Tannenbaum (2006); d’Enterria (2010). Production of heavy quarks in heavy-ion collisions can serve as an important tool for better understanding properties of the dense matter created in such collisions. In particular, because of their large mass, heavy quarks are almost exclusively produced in the early stages of heavy-ion collisions and can therefore serve as a probe of the subsequently created medium. The large mass scale associated with the production of heavy quarks also allows one to test perturbative Quantum Chromodynamics (pQCD) based theoretical models describing high energy collisions.
Recent measurements of heavy-quark production in heavy-ion collisions Adler et al. (2006); Adare et al. (2007a, 2011) exhibit a suppression, which is larger than expected and not easily reconciled with early theoretical predictions Djordjevic et al. (2005); Armesto et al. (2006). In these calculations the dominant energy loss mechanism for fast partons is gluon bremsstrahlung Gyulassy and Wang (1994); Baier et al. (1995). In this context, it was predicted that heavy quarks would lose less energy than light quarks due to the so-called dead-cone effect Dokshitzer and Kharzeev (2001). The disagreement between this prediction and experimental results led to a consideration of alternative in-medium parton energy loss mechanisms, assumed earlier to have a small effect on heavy quarks compared to radiative energy loss. In particular, it was suggested that heavy quarks can lose a significant amount of their energy through elastic collisions with in-medium partons (collisional energy loss mechanism) Mustafa (2005); Moore and Teaney (2005); van Hees et al. (2006), especially in the intermediate transverse momentum range ( GeV/) in which most of the RHIC open heavy flavor measurements are performed. Additional mechanisms for in-medium energy loss for heavy quarks have also been suggested Adil and Vitev (2007); Rapp and van Hees . Despite recent progress, still needed is a universal theoretical framework describing precisely the production of heavy quarks and their subsequent interactions with the partonic medium created in heavy-ion collisions. Also needed are accurate measurements of heavy-quark production in heavy-ion collisions, which are critical to test and constrain the theoretical predictions.
Hidden-heavy-flavor () production has also been extensively measured in heavy-ion collisions Adare et al. (2007b, 2008). The production of mesons is expected to be affected by the formation of a quark-gluon plasma due to the interplay of several competing mechanisms, including suppression due to a color screening mechanism similar to the Debye screening in QED Matsui and Satz (1986) and enhancement due to the coalescence of uncorrelated pairs from the hot medium Andronic et al. (2003); Svetitsky (1988); Thews (2005). The magnitude of such an enhancement depends strongly on the production cross section of open-heavy flavor in heavy-ion collisions, measurements of which are therefore essential to the interpretation of heavy quarkonia results.
A well-established observable for quantifying medium effects in heavy-ion collisions is the nuclear-modification factor, :
| (1) |
where and are the invariant cross sections for a given process in collisions and collisions, respectively, and is the average number of nucleon-nucleon collisions in the collision, evaluated using a simple geometrical description of the nucleus Miller et al. (2007).
For processes that are sufficiently hard (characterized by large energy transfer), is expected to be equal to unity in the absence of nuclear effects. A value smaller (larger) than unity indicates suppression (enhancement) of the observed yield in collisions relative to expectations based on collision results and binary-collision scaling.
Open-heavy-flavor production has been measured by the PHENIX experiment at midrapidity () Adler et al. (2006). This paper presents the measurement of open-heavy-flavor production at forward rapidity () in and collisions, and the resulting , using negatively-charged muons from the semi-leptonic decay of open-heavy-flavor mesons.
The paper is organized as follows: Section II presents a short overview of the PHENIX detector subsystems relevant to these measurements followed by a description of the data sets and track selection criteria. Section III presents a detailed description of the methodology for measuring the invariant cross section in collisions and in collisions for muons from heavy-flavor-meson decays. Results are presented in Section IV and compared to existing measurements as well as theoretical predictions in Section V.
II Experimental setup and data sets
II.1 The PHENIX Experiment
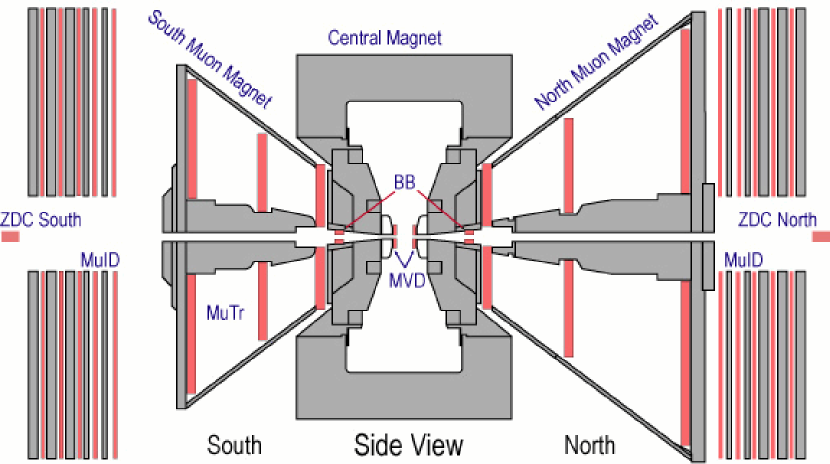
The PHENIX experiment is equipped with two muon spectrometers Adcox et al. (2003), shown in Fig. 1, that provide pion rejection at the level of in the pseudorapidity range (south muon arm) and (north muon arm) over the full azimuth. Each muon arm is located behind a thick copper and iron absorber and comprises three stations of cathode strip chambers (the Muon Tracker, or MuTr), surrounded by a radial magnetic field, and five ”gaps” (numbered 0–4) consisting of a plane of steel absorber and a plane of Iarrocci tubes (the Muon Identifier, or MuID). The MuTr measures the momentum of charged particles by tracking their motion in the surrounding magnetic field. Matching the momentum of the particles reconstructed in the MuTr to the penetration depth of the particle in the MuID (that is, the last MuID gap a given particle reaches) is the primary tool used to identify muons with respect to the residual hadronic background. Measured muons must penetrate 8 to 11 interaction lengths in total to reach the last gap of the MuID. This corresponds to a reduction of the muon longitudinal momentum (along the beam axis) of GeV/ in the south (north) muon arm. The MuID is also used in the online data acquisition to trigger on collisions that contain one or more muon candidates.
Also used in this analysis are the Beam-Beam Counters (BBC) Allen et al. (2003), which comprise two arrays of 64 quartz Čerenkov detectors that surround the beam, one on each side of the interaction point. The BBCs measure charged particles produced during the collision in the pseudorapidity range and determine the collision’s start-time, vertex longitudinal position, and centrality (in collisions). The BBCs also provide the minimum bias trigger.
II.2 Data Sets
Two data sets, recorded in 2005, are used in this analysis: collisions and collisions at a center of mass energy per nucleon-nucleon collision of GeV.
The data used for this analysis have been recorded using two muon enriched triggers, in coincidence with the Minimum Bias (MB) trigger, which requires at least one hit in each of the BBCs and covers approximately 55% of the total inelastic cross section. These two muon triggers rely on the information recorded in the MuID. The first (Deep) trigger requires one or more muon candidates to reach the last plane of the MuID (Gap4), whereas the second, less strict, (Shallow) trigger requires one or more muon candidates to reach at least the third MuID gap (Gap2). The integrated luminosity sampled with these triggers and used for this analysis is nb-1 (48.7 nb-1) for the south (north) muon arm.
All data used for this analysis have been recorded using the Minimum Bias trigger described above. For collisions, this trigger covers approximately 94 % of the total inelastic cross section. The integrated luminosity sampled with this trigger and used for this analysis is 0.13 nb-1, using a total inelastic cross section seen by the minimum bias trigger b.
II.3 Centrality Determination
The centrality of each collision is determined by the number of hits in the BBCs. Three centrality bins are used for this analysis: %, % and %, where % represents the most central 20% of the collisions. For a given centrality, the average number of nucleon-nucleon collisions () and the average number of participating nucleons () are estimated using a Glauber calculation Miller et al. (2007) coupled to a model of the BBC response. Values of and for the three centrality bins defined above are listed in Table 1.
To ensure that the centrality categories are well defined, collisions are required to be within cm of the center of the PHENIX detector along the beam axis.
| centrality | 0–20% | 20–40% | 40–94% |
|---|---|---|---|
| 151.8 17.1 | 61.6 6.6 | 11.23 1.3 | |
| 85.9 2.3 | 45.2 1.7 | 11.7 0.6 |
II.4 Track Selection
This section outlines the track-based selection variables.
-
The event vertex longitudinal position is measured by the BBC detector. For low-momentum tracks ( GeV/) reconstructed in north (south) muon arm we demand (). This arm-dependent cut improves the signal to background ratio because light hadrons produced during the collision have a probability to decay into a muon that increases with their distance from the front muon arm absorber, whereas muons from short-lived heavy-flavor hadrons have a yield that is independent of (see also Section III.3.3).
-
The vertex longitudinal position of a track evaluated using a fit of the track position and momentum measured in the MuTr and extrapolated backward through the front absorber towards the interaction point, together with the BBC vertex measurement.
-
The total number of track hits in the three MuTr stations. A given track can have up to 16 MuTr hits.
-
The total number of track hits in the five MuID gaps. A given track can have up to 2 hits in each gap (10 in total).
-
The distance to the beam axis of the track, as reconstructed in the MuID only, when extrapolated (backward) to (illustrated in Fig. 3).
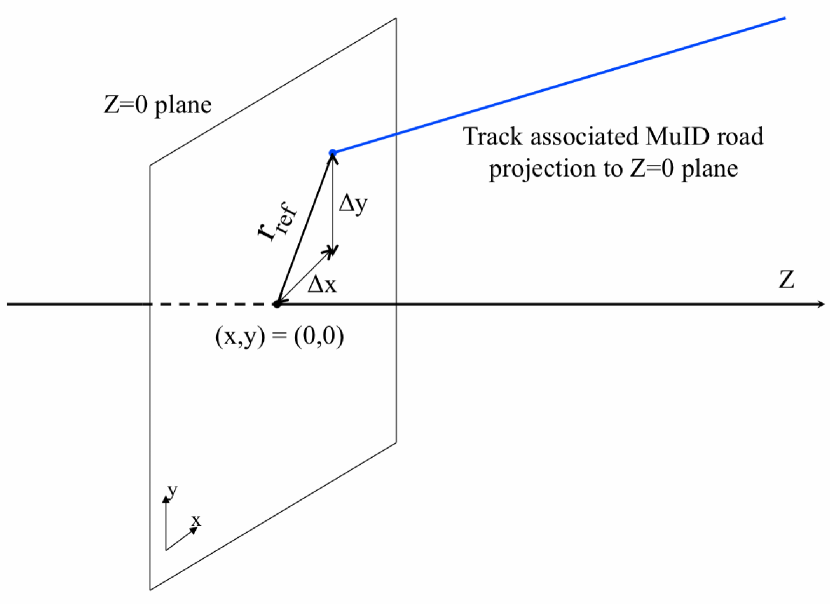
Figure 2: (color online) Schematic representation of variable. 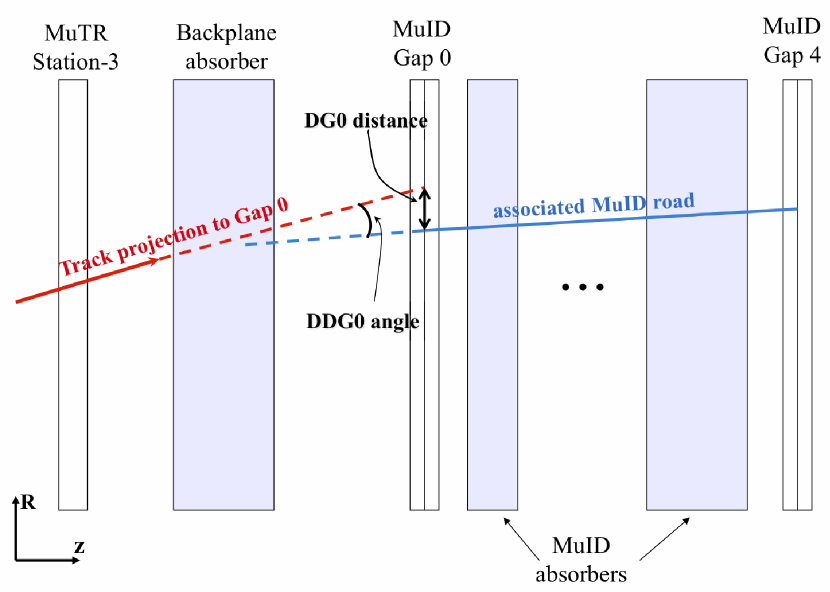
Figure 3: (color online) Schematic representation of track selection variables DG0 and DDG0. - Road Slope
-
The slope of the track, as reconstructed in the MuID only, measured at MuID Gap0: . A cut applied to this variable eliminates combinatorial background generated in the high hit-density region closest to the beam pipe.
- DG0
-
The distance between the track positions calculated in the MuTr and in the MuID, evaluated at the MuID Gap0 position (see Fig. 3).
- DDG0
-
The difference between the track angles calculated in the MuTr and in the MuID, evaluated at the MuID Gap0 position (see Fig. 3).
-
The difference between the event vertex longitudinal position reconstructed by the BBC () and the track longitudinal position provided by the track reconstruction algorithm: .
-
the effective scattering angle of the track in the front absorber, , scaled by the average of the momentum measured at the vertex and at MuTr Station 1: = , where is given by:
(2) where is the momentum vector measured at Station 1 and is the momentum vector at the vertex. For a given track, essentially measures the track deflection in the front absorber due mostly to multiple scattering and radiative energy loss, but also to the magnetic field upstream of station 1. This deflection is expected to be inversely proportional to the track total momentum. Scaling the scattering angle by the track momentum therefore ensures that the distribution is approximately Gaussian with a constant width for all bins.
Cut values applied to these variables are, in some cases, -, species- and/or centrality-dependent. Within a given , species and centrality bin, the same cut values are applied to both Monte Carlo simulations and real data.
Even after all cuts are applied to select good quality muon candidates, there remains a small contamination of misreconstructed tracks caused by:
-
•
Accidental combinations of hits in the muon tracker that do not correspond to a real particle.
-
•
Tracks arising from interactions between the beam and residual gas in the beam pipe or between the beam and beamline components.
These misreconstructed tracks, later denoted , are not completely reproduced by experimental simulations and must be estimated and properly subtracted from the inclusive muon sample to evaluate the amount of muons from heavy-flavor decay. The method by which is estimated is based on the distributions of the and variables and is described in more detail in Section III.2.
Note: positive muons are not used in this analysis due to a poorer signal/background ratio resulting from the fact that both anti-protons and negative kaons are more strongly suppressed by the MuTr front absorbers than their positive counterparts. The rapidity interval used for this measurement is smaller than the rapidity coverage of the PHENIX muon spectrometers () to reduce uncertainties in the acceptance calculation.
III Method for the Measurement of Heavy-Flavor Muons
III.1 Overview
The methodology used to measure heavy-flavor muon (i.e., muons from heavy-flavor meson decay) production in and collisions is described in this section. This analysis is a refinement of techniques originally developed in Adler et al. (2007); Garishvili (2009); Hornback (2008).
For both and collisions the double differential heavy flavor muon invariant yield is defined by:
| (3) |
where is the total number of muon candidates in the bin, consisting of the tracks that reach the last gap of the MuID (Gap4) and pass all track selection criteria; is the estimated number of misreconstructed tracks that pass the track selection cuts accidentally (Section III.2); is the number of tracks corresponding to the irreducible hadronic background, as determined using a hadron cocktail approach (Section III.3); is the number of events, is the detector acceptance and efficiency correction (Section III.5), and is the BBC trigger efficiency for events in which a heavy-flavor muon at forward rapidity is present. This efficiency amounts to 79% (100%) in () collisions.
The and invariant yields determined with Eq. 3 can be used directly to determine the heavy-flavor muon (Eq. 1). However, in order to minimize the systematic uncertainty associated with the estimate of the hadronic background by canceling the part of this uncertainty that is correlated between the and the analyses, is calculated separately for a given version of the Monte-Carlo simulation of hadron cocktail used in the estimate of :
| (4) |
The final value for is then determined by taking the mean of the values obtained for the different cocktails, each weighted by its ability to reproduce measured data, as discussed in Section III.7.
III.2 Contamination from Misreconstructed Tracks
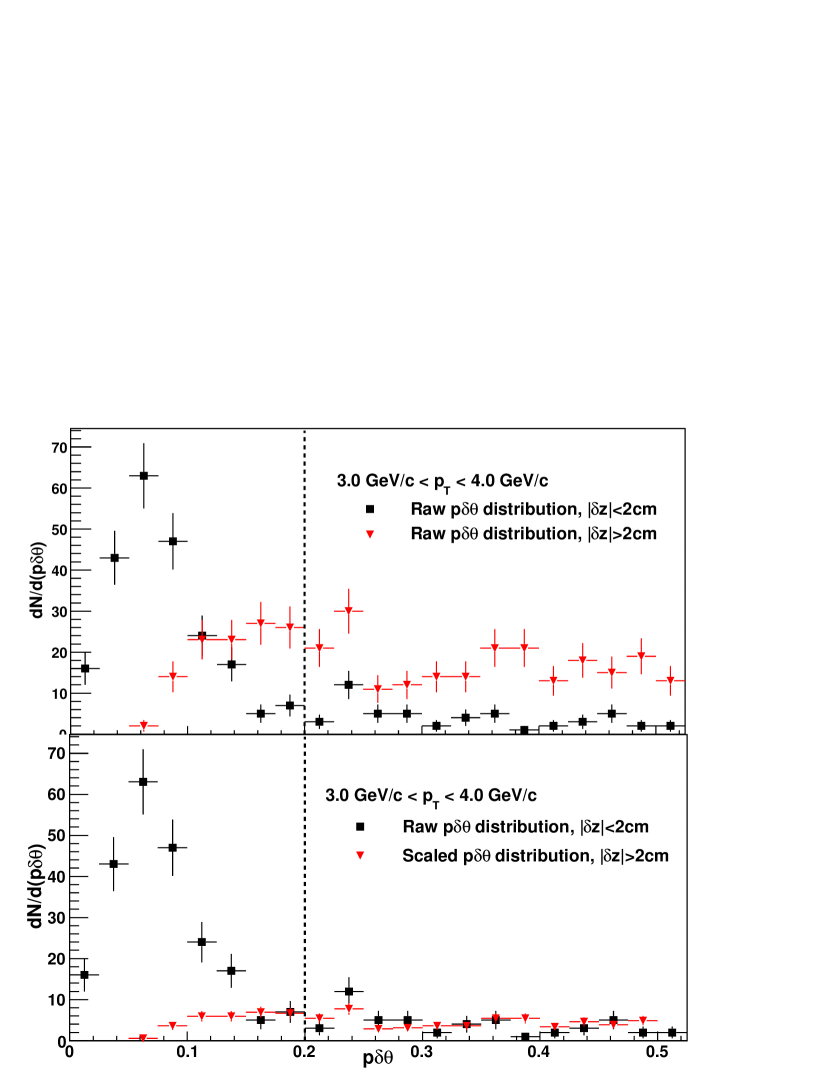
, the number of misreconstructed tracks that accidentally pass all track quality cuts, is estimated using the distribution inside and outside of the cut defined in Section II.4. These two distributions are shown in the top panel of Fig. 4. The distribution inside the cut (black squares) shows two contributions: a peak at radGeV/, corresponding to the expected multiple scattering of muons in the front absorber, and a tail out to large values of . In the distribution outside the cut (red triangles), the signal peak has disappeared, and only the tail remains. Note that the tail extends below the cut; this is the contribution. Using the fact that the shape of this tail appears to be the same on both sides of the cut, one can estimate using:
| (5) |
where is the number of tracks with but , and normalizes the tails of the two distributions above the cut:
| (6) |
III.3 Hadron Cocktail
Charged pions and kaons are the largest source of particles in the PHENIX muon arms. Other species (, , , ) have small but nonzero contributions. Altogether, these light hadrons constitute the main background source for the measurement of muons from heavy-flavor meson decay.
One can define three contributions to this background, depending on how the particles enter the muon spectrometer:
- Decay muons
-
- light hadrons that decay into muons before reaching the first absorber material. Since these particles enter the spectrometer as muons, a fraction of them also penetrate all the absorber layers of the MuID and enter the pool of inclusive muon candidates.
- Punch-through hadrons
-
- hadrons produced at the collision vertex that do not decay, but penetrate all MuID absorber layers, thus also being (incorrectly) identified as muons.
- Decay-in-MuTr
-
- hadrons produced at the collision vertex that penetrate the muon arm front absorber and decay into a muon inside the MuTr tracking volume, with the decay muon then passing through the rest of the MuTr and the MuID. Most such particles are simply not reconstructed because of the decay angle between the primary hadron and the decay muon. However, some can be reconstructed, usually with an incorrect momentum assigned to the track. Due to the exponential distribution, even a small number of such tracks can form a significant background at high , but for the range in this analysis this contribution is small.
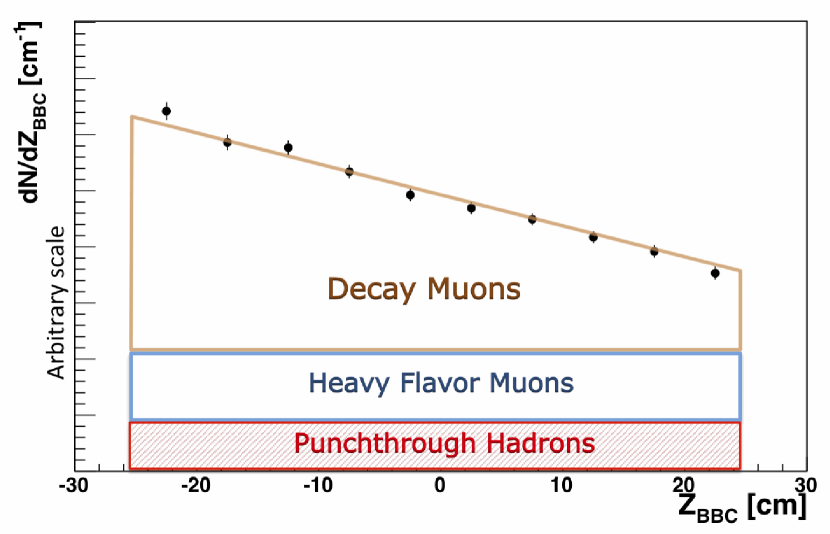
While decay muons can not be distinguished from punch-through hadrons and heavy-flavor muons on an event-by-event basis, their production exhibits a strong vertex dependence, as illustrated in Fig. 5. This feature plays a key role in constraining heavy-flavor background (Section III.3.3).
A series of Monte Carlo simulations (“hadron cocktail packages”) are used to estimate the overall background due to light hadron sources. The construction of a given hadronic cocktail package involves the following steps:
-
1.
Generate a primary hadron sample based on parameterized and distributions (Section III.3.1).
-
2.
Propagate these hadrons through the muon spectrometer using the complete geant3 Brun et al. PHENIX simulation. Each hadron cocktail package uses one of the two hadron shower codes provided by geant3: g-fluka or gheisha with a scaled value of the hadron-Iron interaction cross section (Section III.3.2).
-
3.
For the analysis the simulated hadrons are then embedded in real events in order to account for deterioration of the reconstructed track quality due to high hit multiplicity.
-
4.
Reconstruct the resulting particles using the same reconstruction code and track quality cuts used in the real data analysis. (Section II.4).
-
5.
Tune (that is, re-weight) the input distributions (from step 1) to match hadron distributions measured in the muon arm (Section III.3.3).
III.3.1 Input Particle Distributions
Particle distributions required as input to the hadron cocktail have not been measured over the required and range at RHIC energies. We therefore use a combination of data from PHENIX, BRAHMS and STAR, together with Next-to-Leading Order (NLO) pQCD calculations to derive realistic parameterizations of these distributions. An exact match to actual distributions is not necessary since the input distributions are re-weighted to match measured hadron distributions before being used to generate estimates of (Section III.3.3).
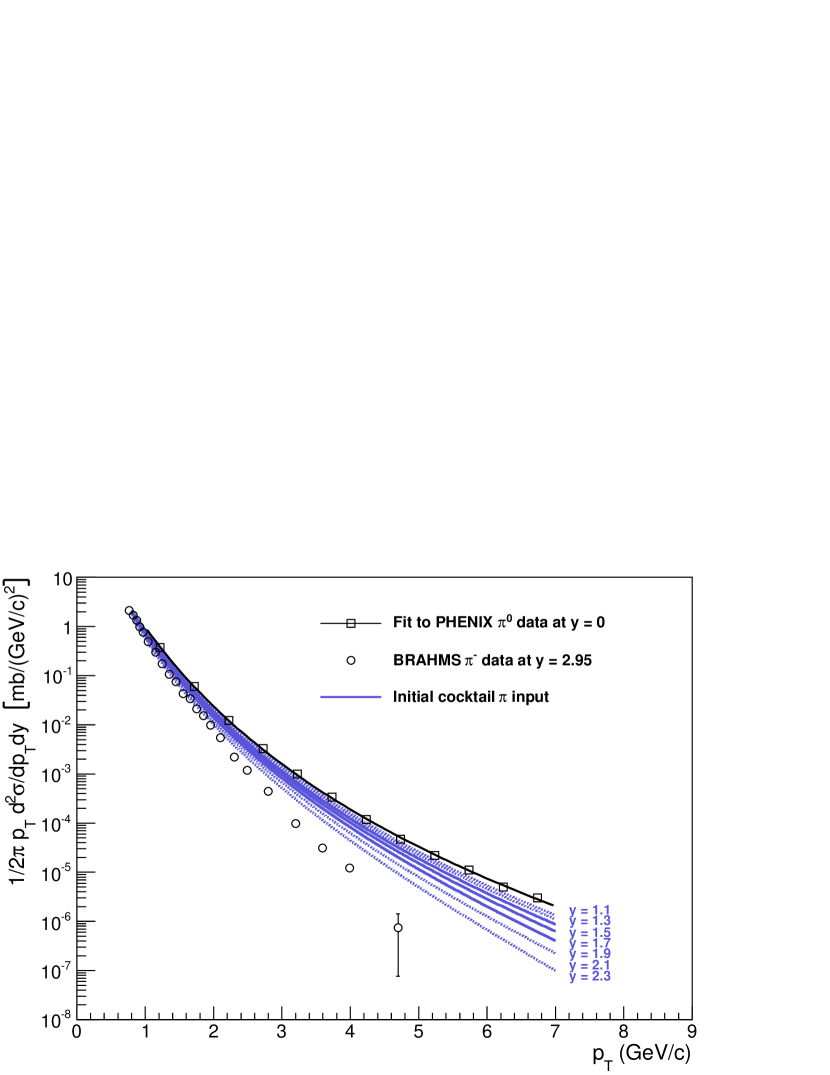
We start with the spectrum in collisions at measured by PHENIX Adler et al. (2003). This is extrapolated to in two steps. First, an overall scale factor is obtained from a Gaussian parameterization of the charged pion distribution measured by BRAHMS Videbaek (2009). Next, the shape is softened using a parameterization of the ratio of unidentified hadron spectra measured by BRAHMS at and Samset (2006); Arsene et al. (2004):
| (7) |
Next we extrapolate this spectrum over the range using a series of Next-to-Leading Order (NLO) calculations Vogelsang to obtain the ratio . Figure 6 shows a comparison of the hadron cocktail input for charged pions compared to charged-pion distributions at and . Spectra for other hadron species in the cocktail are obtained by multiplying the parameterized pion spectra by parameterizations of measured values of hadron-to-pion ratios, as a function of .
With 8–11 interaction length of material prior to MuID Gap4, approximately 4000 hadrons must be simulated to obtain a single hadron reconstructed as a muon. Given this level of rejection, it is very CPU intensive to generate a sufficient sample of high hadrons using realistic spectra. A standard technique is to throw particles with a flat spectrum and then weight them with a realistic distribution. However, interactions in the absorber in front of the MuTr and decays in the MuTr volume can both result in particles being reconstructed with incorrect momentum. Due to the steeply falling nature of the spectrum, tracks with low momentum and incorrectly reconstructed with a higher momentum can have a significant contribution at high , with respect to properly reconstructed tracks. As a compromise designed to ensure statistically robust samples of both tracks with initial high and with misreconstructed high , we multiply the realistic distributions by to form the simulation input distributions, and re-weight the output of the simulation by to recover the initial distribution.
The particles in the primary hadron sample used as input to each hadron cocktail package are generated as follows:
-
•
The particle type and rapidity are chosen based on values obtained by integrating the unweighted distributions described above.
-
•
The particle’s transverse momentum is chosen within the range GeV/ using the -weighted distributions described above.
-
•
Since the muon spectrometer acceptance shows little dependence on the vertex position, the particle’s origin is chosen from a flat distribution over the range cm.
-
•
The particle’s azimuthal angle, , is chosen from a flat distribution over .
III.3.2 Hadron Cocktail Packages
Modeling hadron propagation through thick material is known to be difficult and neither hadron shower code available in geant3 (g-fluka and gheisha) is able to reproduce measured data in the PHENIX muon arms. The approach we have chosen to circumvent this issue is to produce a range of background estimates using a set of hadron cocktails (referred to as packages), each of which uses one of the geant hadron shower codes and a different, modified, value of the hadron-Iron interaction cross section. The set of background estimates are then combined in a weighted fashion to extract central values for production yields, , and the contribution to the systematic uncertainty on these quantities due to the uncertainty in hadron propagation.
Using the default hadron-ion cross section, fluka simulations produce more muon candidates than gheisha simulations, therefore the fluka cross sections are increased relative to the default and the gheisha cross sections are decreased. The cross section modifications are referred to in terms of percentage, so that a 6% increase is referred to as 106%. Five packages are used in this analysis: fluka105 (or fl105), fl106, fl107, gheisha91 (or gh91) and gh92.
III.3.3 Tuning the Hadron Cocktail Packages
To tune and validate a given hadron-cocktail package we can compare its output to three measured hadron distributions:
-
•
The distribution of tracks that stop in MuID Gap2 (counting from 0), with larger than a given minimum value.
-
•
The distribution of tracks that stop in MuID Gap3 (counting from 0), with larger than a given minimum value.
-
•
The vertex distribution of reconstructed tracks, normalized to the collision-vertex distribution.
Particles that stop in MuID Gap2 or Gap3 are those tracks for which no hit is found in the downstream gaps (Gap3 and/or Gap4). Figure 7 shows the longitudinal-momentum () distribution of tracks stopping in MuID Gap3 obtained using a given hadronic cocktail. Decay muons are characterized by a sharp peak, corresponding to electromagnetic energy loss in the absorber material. Note that the same peak would be obtained for muons from heavy-flavor decay. In contrast, hadrons are characterized by a broad shoulder that extends to much larger values of . For (with GeV/ in this example) one obtains a clean hadron sample. The hadron-input distributions can then be tuned so that a good match between the number of stopped hadrons in the simulation and in real data is achieved in each bin.
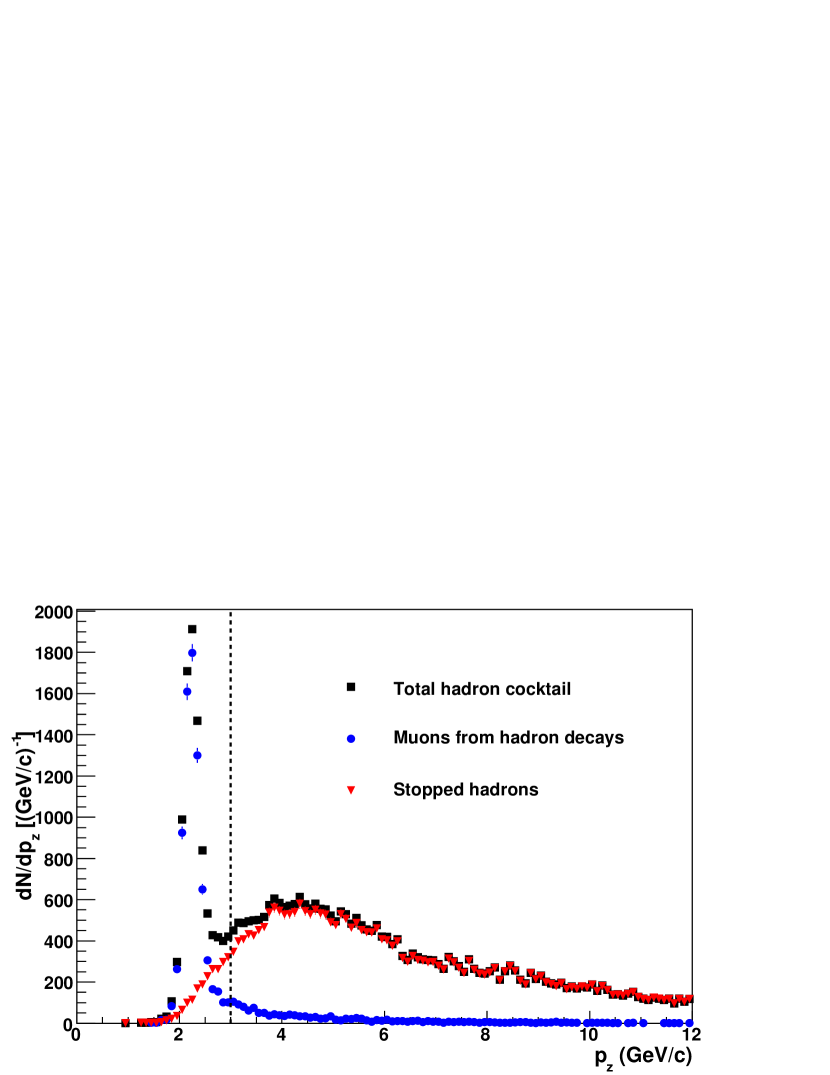
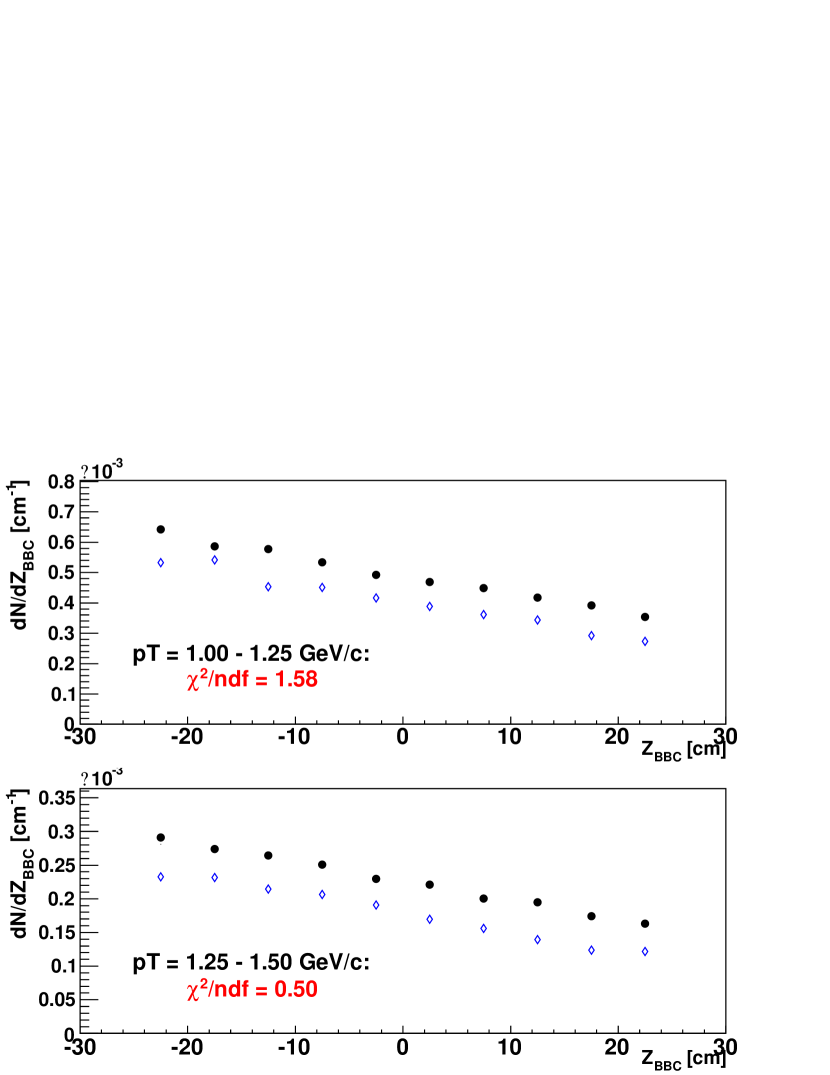
Figure 8 shows, for two muon- ranges, comparisons for real data and hadron-cocktail simulations of the -vertex distributions of tracks, which (a) are reconstructed in the north muon arm (located at positive ), (b) reach the MuID Gap4, and (c) are normalized by the event vertex distribution . The approximately linear dependence on is entirely due to the contribution of muons from light hadrons decaying before the muon-tracker front absorber. Muons from short-lived heavy-flavor hadrons have no measurable dependence on and their contribution to the real-data sample is the source of the vertical offset between the hadron cocktail and the real-data distributions. Therefore, the hadron-cocktail package can be tuned by matching the slopes of these two distributions in each bin. The quality of this match is quantified by:
| (8) |
where is the number of bins; is the difference between the data and simulation for the bin; is the average difference over the entire range; and are the statistical uncertainties of and , respectively.
Tuning of each hadron-cocktail package is achieved by iteratively selecting a set of -dependent weights (applied to each track’s thrown ) that simultaneously optimizes the agreement between data and simulation for the three distributions described above. Applying these weights to those simulated hadron tracks that reach MuID Gap4 determines the corresponding hadron contribution to the inclusive muon yield (, Eq. 3).
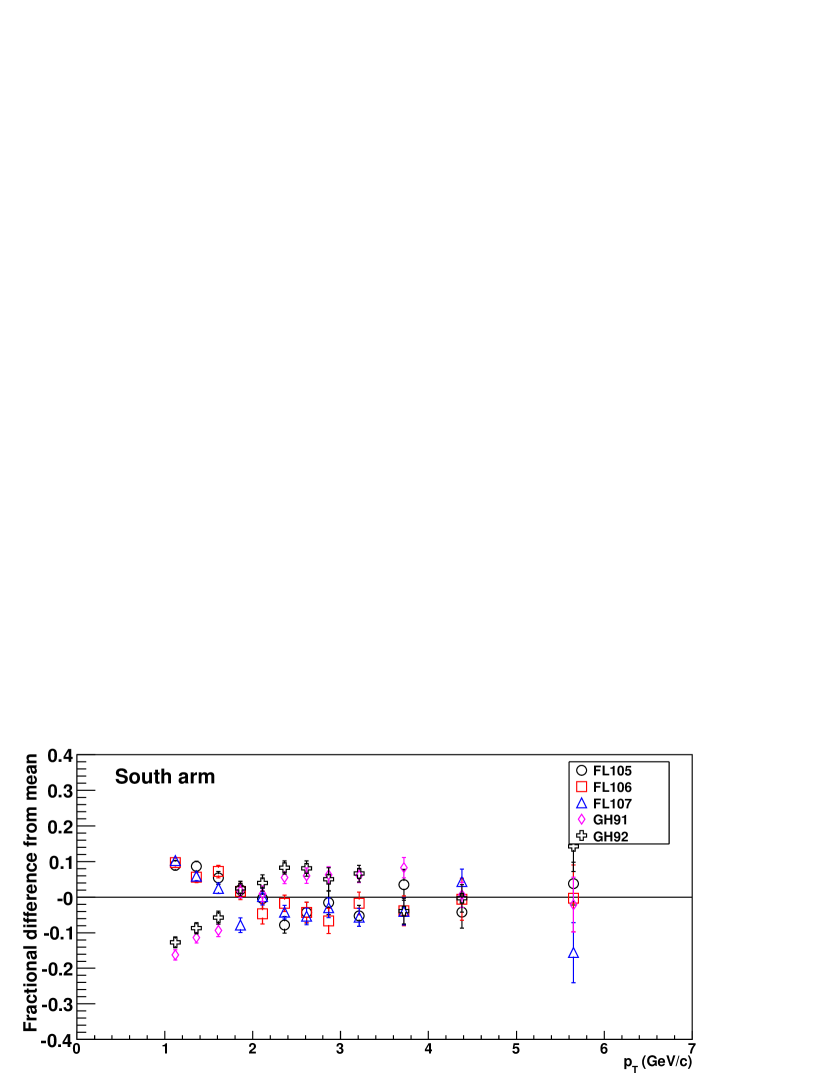
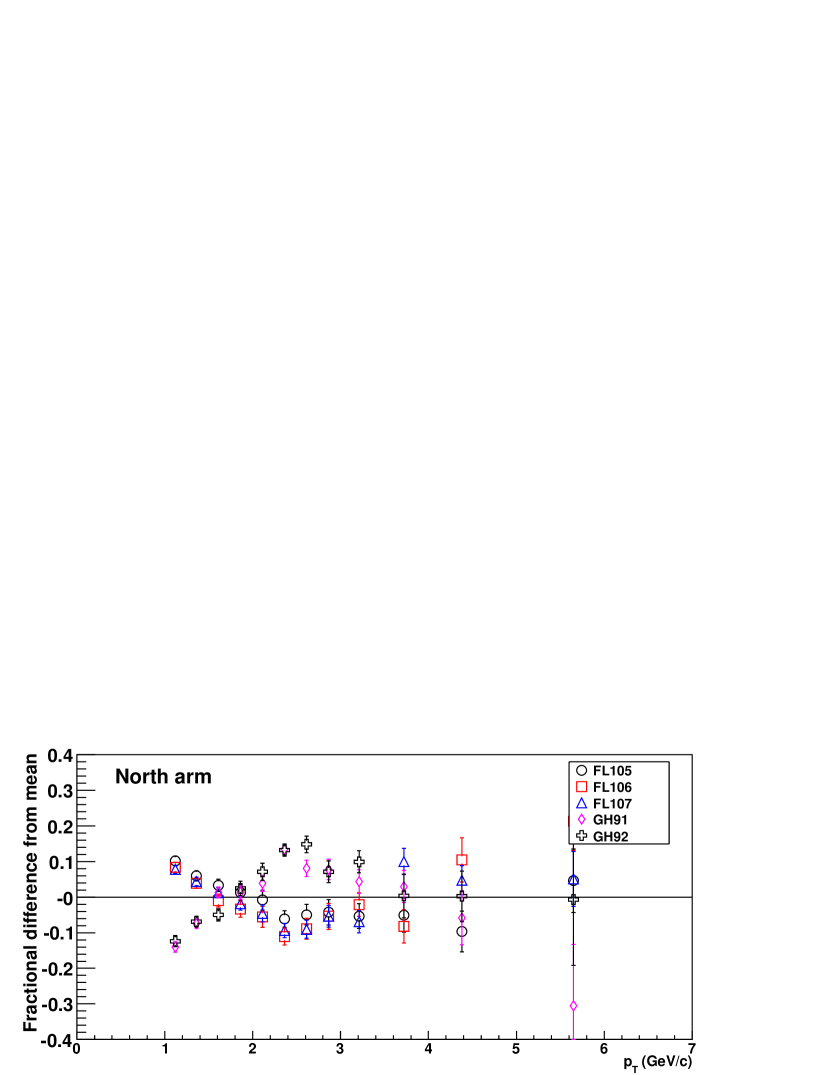
Figure 9 shows the relative dispersion between values obtained for the five different hadron cocktail packages used for the analysis, as a function of . For both muon arms, the largest differences exist between the gheisha and fluka cocktail packages for GeV/, with a spread of about 20%. For GeV/, most of the dispersion between the packages is due to increased statistical uncertainty in the data yields used to tune the hadron cocktail.
III.3.4 Systematic Uncertainties Associated with Individual Hadron Cocktail Packages
There are two systematic uncertainties associated with the implementation of a given hadron cocktail package:
-
the uncertainty associated with the implementation of the hadron cocktail packages. It is comprised of two components: the uncertainty on the hadron cocktail input distributions and the so called MuID Gap3 to Gap4 matching uncertainty. The uncertainty on the hadron cocktail input distributions amounts up to 20% and is correlated between the two arms. The uncertainty on the MuID Gap3 to Gap4 matching corresponds to tracks, in either real data or simulations, that get assigned an incorrect penetration depth, due to accidental addition of extra hits in the next MuID gap, or on the contrary, to detection inefficiencies. This uncertainty is evaluated using simulations. It is arm independent and amounts to 10%. These two contributions are uncorrelated and added in quadrature.
-
the uncertainty that characterizes, as a function of , the ability of a given hadron cocktail package to reproduce the measured distributions described in the previous section. To evaluate this uncertainty the cocktail is tuned three times, each time matching one of the three measured hadron distributions perfectly. The dispersion between the resulting background yields obtained with these three different tunings, along with the central value for obtained using the simultaneous tuning described above, is assigned to . A different value is calculated for each muon arm, each (and centrality) bin, and each of the five hadron cocktail packages. Mathematical details of the calculation are outlined in Section III.7. Since the optimization is arm independent, this uncertainty is uncorrelated between the two muon arms. The magnitude of this uncertainty varies from 10 to 20% depending on the muon arm and the bin.
III.4 Other Background Sources
In addition to the hadronic background, other background sources include:
-
•
muons from heavy-flavor-resonance leptonic decay (e.g. , , and the family);
-
•
muons from Drell-Yan;
-
•
muons from light vector meson decay (, and ).
These three sources contribute significantly less to the inclusive yields than the backgrounds from light hadrons. Monte Carlo simulations performed in the same manner as in Adare et al. (2011) show that their contribution to the final heavy-flavor muon spectrum is less than 5% in the range used for this analysis and they have negligible impact with respect to the other sources of systematic uncertainties.
III.5 Acceptance and Efficiency Corrections
Acceptance and efficiency corrections, , enter in the denominator of invariant yield measurements (Eq. 3). They are evaluated using simulated prompt single muons, propagated through the detector using the PHENIX geant3 simulation and reconstructed with the same analysis code and the same track quality cuts as for the real data analysis. These corrections account for the detector’s geometrical acceptance and inefficiencies (for example, due to tripped high voltage channels or dead front-end electronic channels). They also account for the muon triggers, reconstruction code and analysis cut inefficiencies.
A reference run, representative of a given data taking period, is chosen to define the detector’s response to particles passing through it. This includes notably the list of inactive high-voltage and electronic channels. Remaining run-to-run variations with respect to this reference run are small due to the overall stability of the detector’s performance, and are included in the systematic uncertainties ().
A comparison between the hit distributions in the MuTr and the MuID obtained for the reference run in real data and simulations is used to assign an additional systematic error on our ability to reproduce the real detector’s response in the simulations. Areas with unacceptable discrepancies are removed from both the simulations and the real data using fiducial cuts. Remaining discrepancies are accounted for with a 8% systematic uncertainty for the MuTr and 4.5% for the MuID.
The hit multiplicity in the MuTr for collisions is much higher than for collisions and for the single muon simulations. To account for deterioration of the reconstruction efficiency in presence of such high multiplicity events, simulated single muon events are embedded into real data events before running the reconstruction and evaluating the correction.
Another systematic uncertainty, , is assigned to a possible systematic bias between the particle’s reconstructed momentum and its real momentum. This uncertainty is estimated by comparing the measured invariant mass (using the dimuon invariant mass distribution) and its Particles Data Group (PDG) value. This uncertainty amounts to %.
Table 2 summarizes the acceptance and efficiency related uncertainties, which sum quadratically to 9.5%.
| Component | Value | |
|---|---|---|
| MuTr station data/MC | 8% | |
| MuID Gap4 efficiency uncertainty | 4.5% | |
| Run to run variation | 2% | |
| momentum scale | 1.5% | |
| Total | 9.5% | |
III.6 Systematic Uncertainties
This section summarizes systematic uncertainties associated with this analysis, most of which have been described in previous sections:
-
•
Systematic uncertainties associated with individual hadron cocktail packages, and (Section III.3.4);
- •
- •
These systematic uncertainties are calculated independently for each arm, bin and centrality bin.
The first three uncertainties listed above (first two items) are related to the hadronic background estimate and are combined to form a systematic uncertainty, following a method described in Section III.7.
For invariant cross section measurements (in collisions) and measurements of one must add to the uncertainties above the systematic uncertainty on the inelastic cross section seen by the minimum bias trigger, %. For measurements, one must also add the systematic uncertainty on the mean number of binary collisions () in each centrality bin, as provided by the Glauber calculation used to determine this quantity.
Table 3 summarizes the systematic uncertainties in this analysis.
| Component | Value | |
|---|---|---|
| Package mismatch | varies, 10% | |
| Single package uncertainty | varies, 10 - 20% | |
| Acceptance and efficiency | 9.5% | |
| 9.6% | ||
| varies, 10 - 13% |
III.7 Determination of the Central Value for Heavy-Flavor-Muon Production Yields and
This section details the procedure used to combine the results from multiple hadron cocktail packages to obtain the central values for the spectra and and to propagate associated systematic uncertainties. This discussion includes the definition of and . Throughout this section the variable is used to represent either the invariant yield or , for a given and centrality bin; the procedure is the same for both, except where noted explicitly.
-
1.
For each bin , hadron cocktail package , and package tuning , we calculate the value where:
- =1
-
is the optimal tuning that best matches all three hadron distributions simultaneously (see Section III.3.3);
- =2
-
is the tuning that best reproduces the distribution of particles stopping in MuID Gap2;
- =3
-
is the tuning that best reproduces the distribution of particles stopping in MuID Gap3; and
- =4
-
represents the tuning that best reproduces the vertex distribution of particles reaching MuID Gap4.
The tuning is used for the central value whereas the other tunings are used to establish the systematic uncertainty for a single hadron cocktail package due to its inability to completely describe measured hadron distributions.
-
2.
The package mismatch contribution to the uncertainty on the measurement is estimated by the standard deviation between the four tunings, :
(9) -
3.
For each bin and package , the associated total uncertainty is computed:
(10) where the first two contributions, and are the statistical uncertainties on the data and on the simulation and all other terms have already been introduced in previous sections.
-
4.
Using from step 3 we calculate the weighted mean of the values obtained for the optimal tuning () of the different packages, , in each bin, :
where
(11) -
5.
The total uncertainty on the final measurement is the variance of the weighted mean:
(12) where is the part of the total uncertainty that is correlated between different packages:
(13) -
6.
For convenience, the total uncertainty is split into a statistical uncertainty, a model-related systematic uncertainty and an acceptance and efficiency correction related systematic uncertainty:
(14) with:
(15) and (by construction):
(16) so that the final measurement, in a given muon arm, is written:
(17) -
7.
The independent North and South measurements are combined using:
(18) where is the index of the bin, the arm index and a weight calculated in the same manner as in Eq. 11, using the following total uncertainty on the measurement :
(19) which is identical to the expression of Eq. 14, but explicitly includes the arm index, .
The total uncertainty on the arm-averaged value is calculated in a manner similar to Eq. 12:
(20) where is the systematic uncertainty common to both muon arms due to uncertainty on cocktail input.
For convenience, this uncertainty is again split into a statistical contribution and a systematic contribution defined by:
(21) so that the final, arm-averaged, measurement of is written:
(22)
As already noted in Section III.6, for invariant cross section measurements (in collisions) and measurements one must add the systematic uncertainty on the inelastic cross section seen by the minimum bias trigger, in quadrature to the uncertainties above. For measurements one must also add the systematic uncertainty on the mean number of binary collisions in each centrality bin.
IV Results
IV.1 Heavy-Flavor Muon Distributions in and Collisions
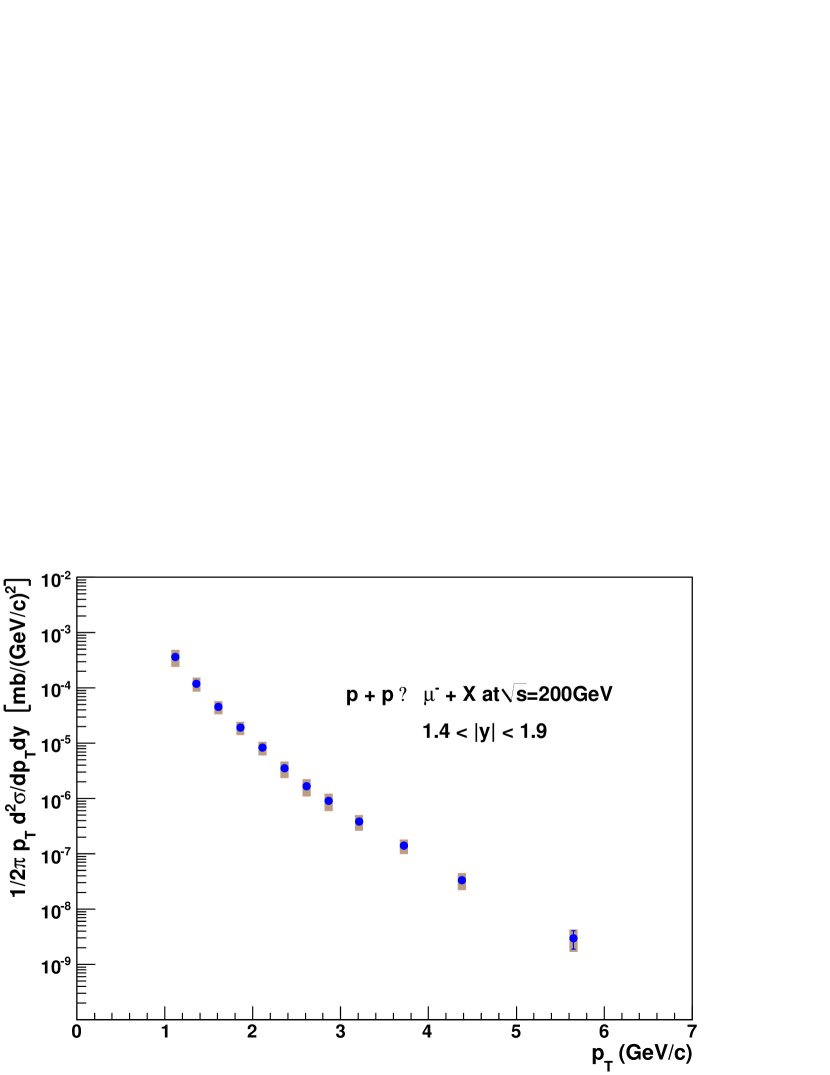
Figure 10 shows the production cross section of negatively charged muons from decays of open-heavy-flavor mesons as a function of . Vertical bars correspond to statistical uncertainties. Boxes correspond to the systematic uncertainties calculated following the steps described in Section III.7. The measurements from both muon arms have been combined to reduce the overall uncertainty. Measured values for each bin are listed in the Appendix (Table 5).
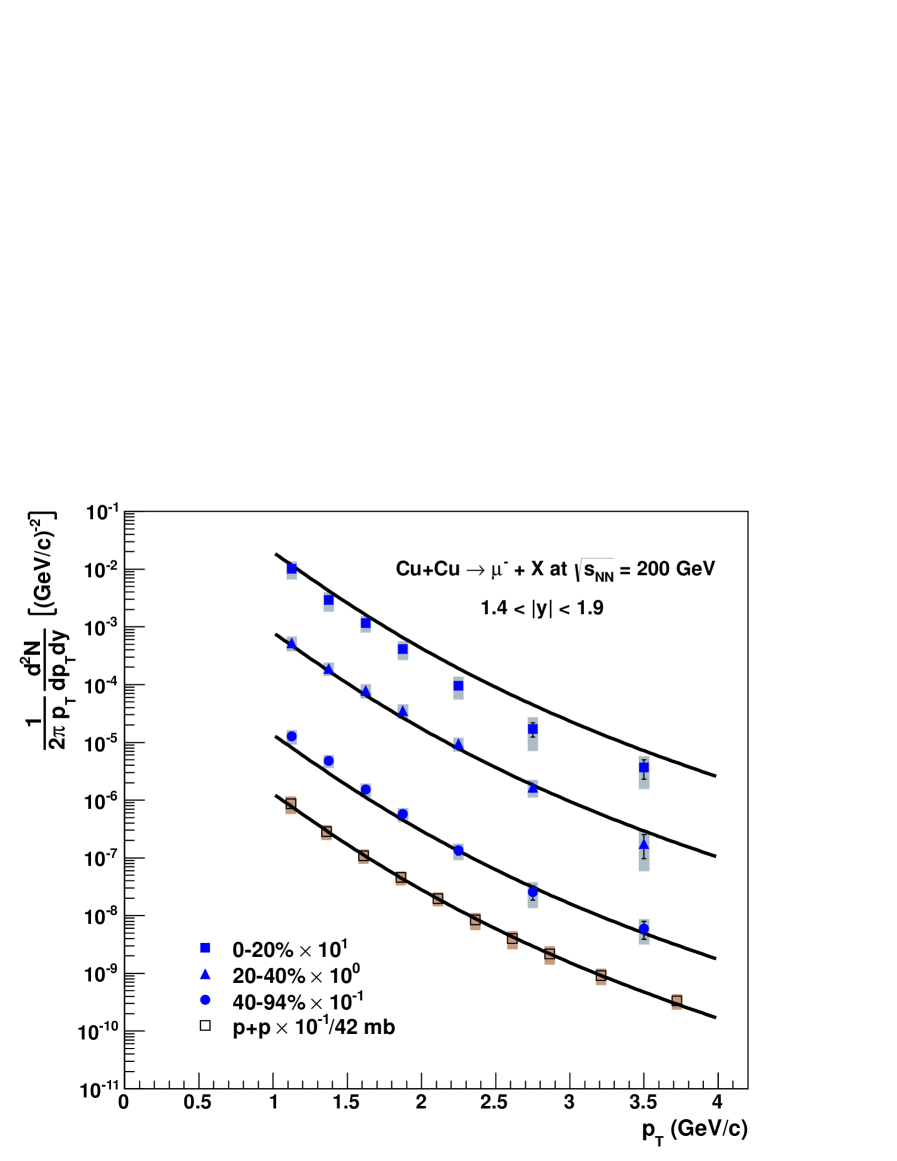
Figure 11 shows the invariant yield of negative muons from heavy-flavor mesons decay for all analyzed centrality classes, compared to the invariant yield measured in collisions. The solid lines correspond to a fit to the data using the function , similar to the one used in Yoh et al. (1978), scaled by the average number of binary collisions for each centrality bin. For peripheral (% centrality) and midcentral (% centrality) collisions, a reasonable agreement is observed between the measurement and the scaled fit to the data, whereas for central collisions (%), a systematic difference is visible for high muons (GeV/), and the measurements are below the scaled fit, indicating a suppression of the heavy-flavor yields with respect to binary collision scaling, which is best quantified by measuring (see Section IV.3).
IV.2 Charm Cross Section, in Collisions
The heavy-flavor muon distribution is used to estimate the charm differential production cross section, at forward rapidity (), as described in detail in reference Hornback (2008). The muon spectrum measured in collisions spans from to GeV/. Estimation of the full charm charm cross section requires a theoretical calculation in order to extrapolate the measurement down to GeV/. A set of fixed-order-plus-next-to-leading-log (FONLL) Cacciari et al. (1998, 2001) calculations have been used in this analysis.
The charm production cross section is derived from the heavy-flavor muon cross section using:
| (23) |
where is the total muon branching ratio of charm and is fixed to 0.103 in FONLL; is a kinematic correction factor, also provided by the FONLL calculation, which accounts for the difference in rapidity distributions between leptons and mesons; is the total cross section for negative muons from heavy-flavor mesons decay, integrated over and estimated by extrapolating our measurement down to GeV/ using the FONLL calculation.
IV.2.1 Extrapolation of the Data for GeV/
Low muons dominate the integrated heavy-flavor muon cross section due to the power-law like behavior of the distribution (Fig. 10): according to the central value of the FONLL calculation, the integrated charm cross section for GeV/ represents about % of the total. Additionally, the contribution of bottom quark decay to the heavy-flavor muon distribution becomes increasingly relevant for GeV/, but has a negligible contribution to the integral and is ignored hereafter.
The measured spectral shape matches the calculated shape. Therefore, extrapolation of the measured heavy-flavor muon spectra down to GeV/ using FONLL is given by:
| (24) |
where is a constant determined by fitting the central values of the FONLL distribution to the data for GeV/. It amounts to 3.75, and is used in determining the central point for PHENIX muons shown in Fig. 12.
IV.2.2 Systematic Uncertainties on
The total systematic uncertainty assigned to is a combination of experimental and theoretical uncertainties, added in quadrature. The experimental systematic uncertainty on the integral above ,GeV/ is determined by the appropriate quadrature sum of the systematic uncertainties on the individual points. This uncertainty is up/down symmetric and is equal to %.
The theoretical uncertainty for originates from the FONLL uncertainties. The variation in the FONLL calculation are determined by variation of the factorization scale, , the renormalization scale, , and the charm quark mass. Other contributions, such as fragmentation and parton distribution functions are smaller and neglected in this analysis.
The FONLL upper and lower bounds obtained by varying the scales and the charm quark mass are treated as approximations for a one standard deviation systematic uncertainty. The ratio of the measured distributions for GeV/ to the upper and lower FONLL bounds are fit independently to determine the corresponding two normalization factors. The difference between these two normalization factors is then used as a theoretical uncertainty. This uncertainty is asymmetric and amounts to %. These FONLL systematic uncertainties are consistent with those of a previous study Hornback (2008), which examined the different distributions obtained by varying the FONLL parameters, [GeV/], , , with representing transverse mass. The different predicted theoretical ranged within an envelope of 35% relative to the central spectrum.
IV.2.3 Integrated Charm Production Cross Section at in collisions
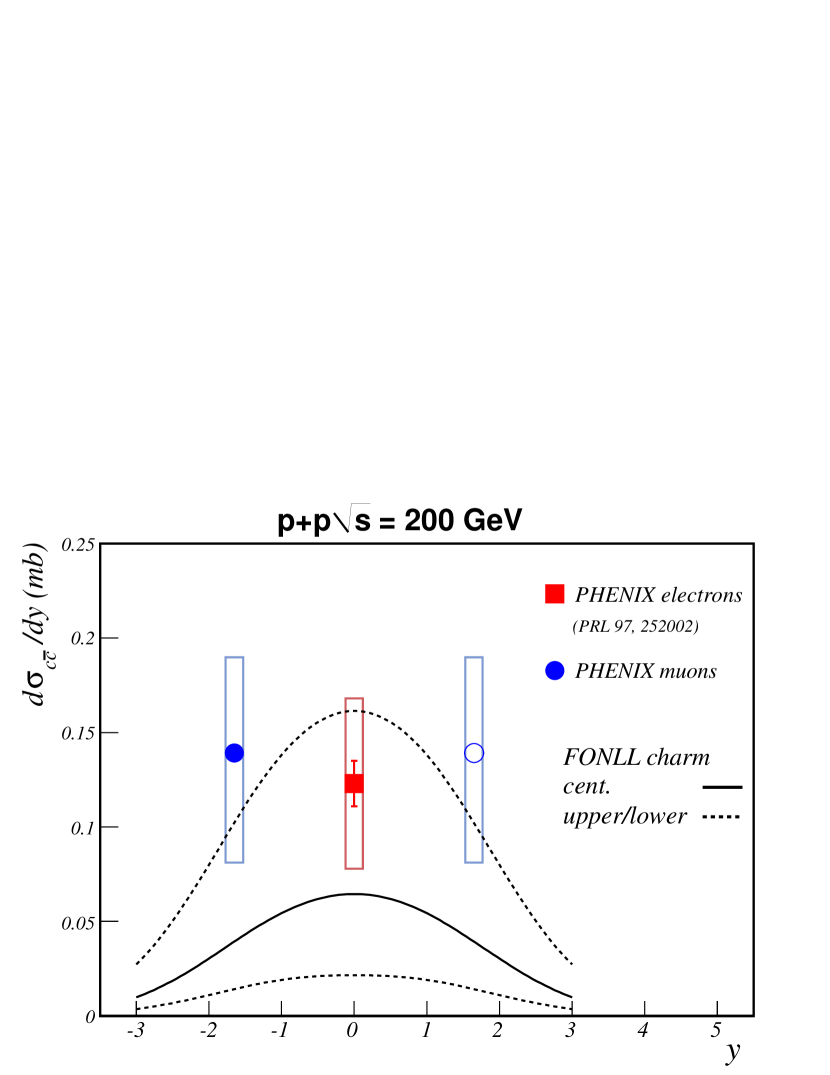
The integrated charm production cross section at forward rapidity () obtained with this method is:
| (25) |
This measurement is shown in Fig. 12, together with the measurement performed by PHENIX at midrapidity Adare et al. (2006), as well as the FONLL calculation and its uncertainty band, calculated as discussed in the previous section. The full circle, located at , corresponds to the combined measurement performed in both muon arms. The open circle, located at , corresponds to its mirror image.
IV.3 Heavy-Flavor-Muon in Collisions as a Function of
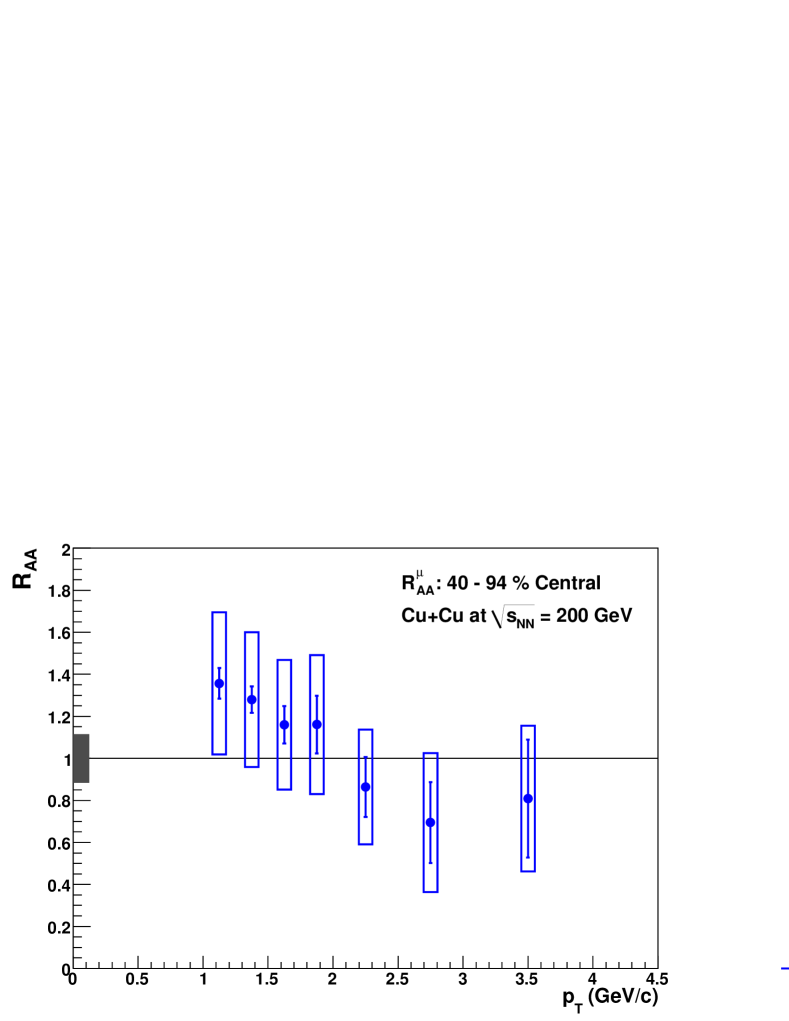
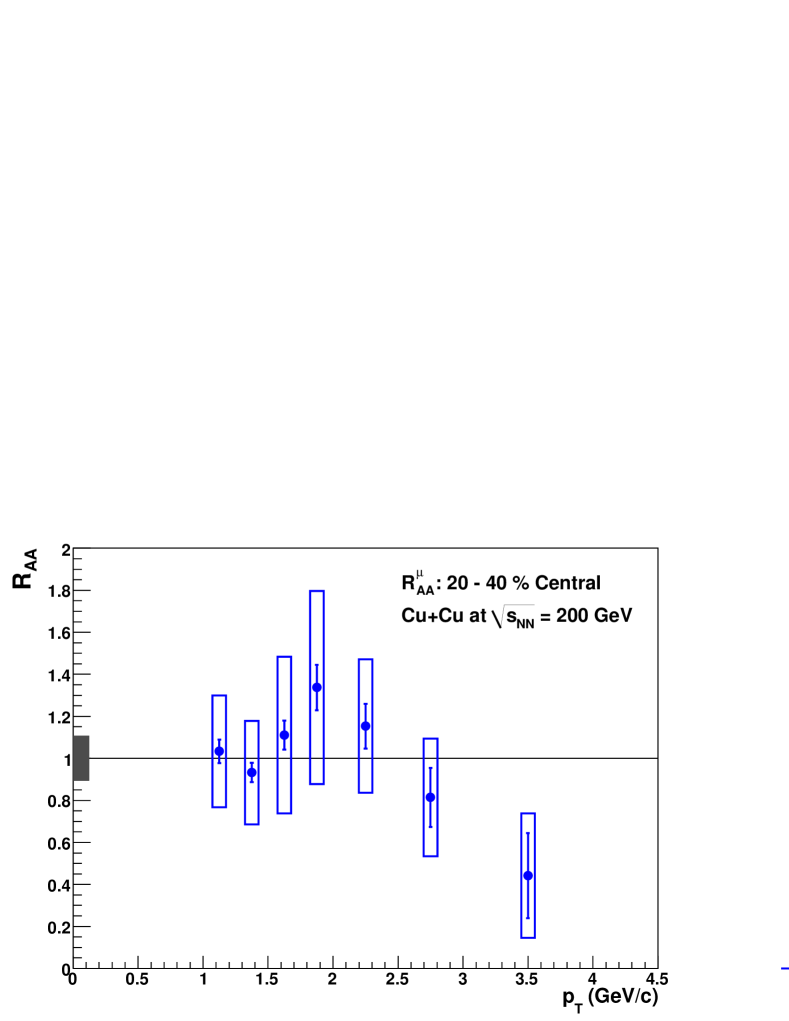
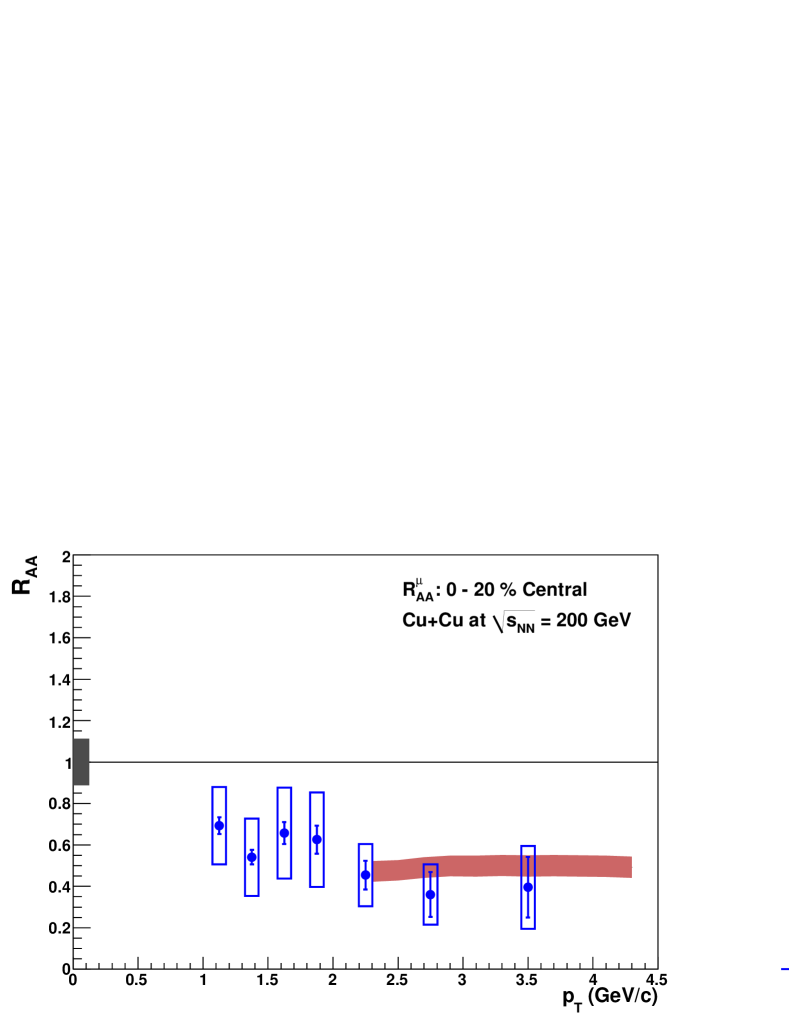
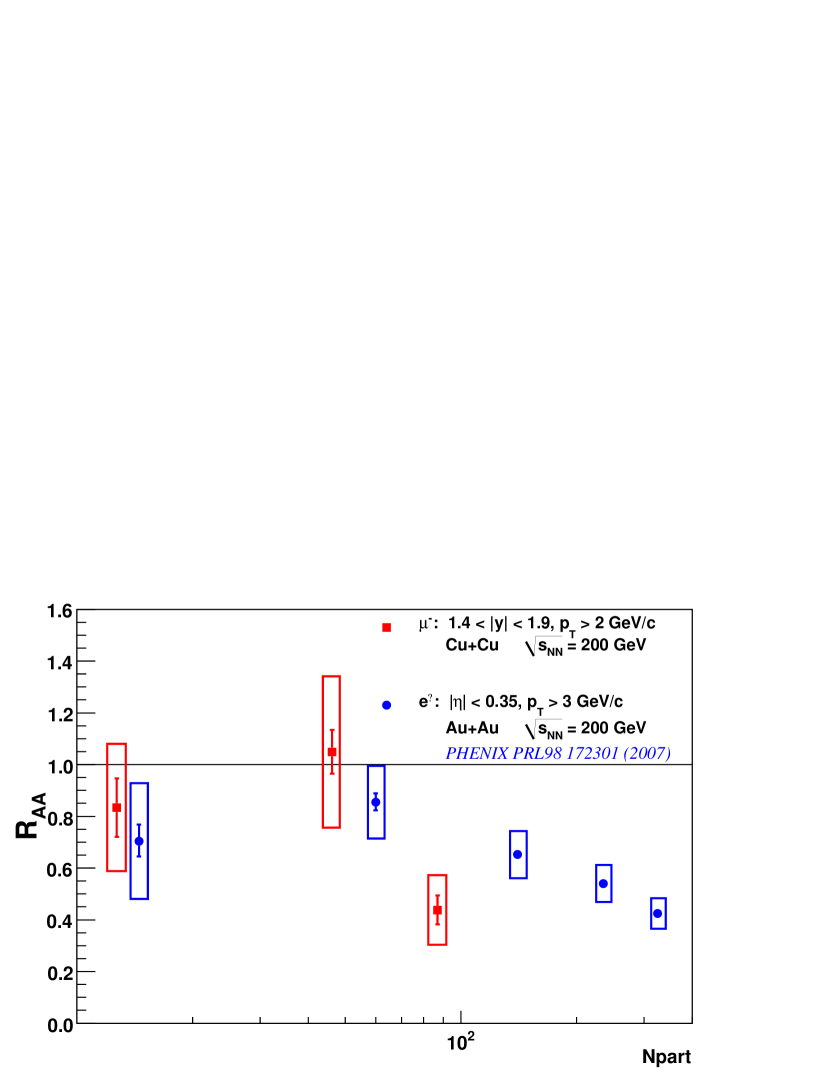
Figure 13 shows for muons from heavy-flavor decay in collisions as a function of muon for three centrality classes (%, % and %). As was the case for invariant yields and cross sections, the two independent measurements obtained with each muon arm are statistically combined, following the method discussed in Section III.7. Vertical bars correspond to the statistical uncertainties; boxes centered on the data points correspond to point-to-point correlated uncertainties and the vertical gray band centered on unity corresponds to the uncertainty on , as listed in Table 1. Also shown in the bottom panel of Fig. 13 is a theoretical calculation from Vitev ; Sharma et al. (2009), discussed in Section V. The measured values for each bin and each centrality class are listed in the Appendix (Table 5).
V Discussion and Conclusions
The measurement of open-heavy-flavor muon production in collisions at GeV reported in this paper is a significant improvement over the previous PHENIX published result Adler et al. (2007). The transverse momentum range of the present measurement is extended to GeV/ (compared to GeV/ in the previous analysis). The differential production cross section is integrated over to calculate a production cross section at forward rapidity of mb. This cross section is compatible with a FONLL calculation within experimental and theoretical uncertainties. It is also compatible with expectations based on the corresponding midrapidity charm production cross section measured by PHENIX.
Muons from heavy-flavor decay have also been measured in collisions at GeV/, in the same rapidity and momentum range. This allows determination of the heavy-flavor-muon as a function of in three centrality classes, %, % and %. As shown in Fig. 13, no suppression is observed across most of the transverse momentum range for muon yields measured in peripheral (%) and midcentral (%) collisions compared to -scaled collisions. On the contrary, open heavy flavor production is significantly suppressed for central collisions (%), with the largest effect observed for GeV/. Interestingly, as demonstrated in Fig. 14, the level of suppression for these higher heavy-flavor muons (the last red point on right) is comparable to the level of suppression observed for high nonphotonic electrons measured at midrapidity in the most central collisions (the last blue point on right). One expects the Bjorken energy density of the matter produced in the midrapidity region in the most central collisions to be at least twice as large as that of the matter produced in the forward rapidity region in most central collisions Wong ; Garishvili (2009). Therefore the large suppression observed in collisions suggests significant (cold) nuclear effects at forward rapidity in addition to effects due to strongly interacting partonic matter.
As shown in the bottom panel of Fig. 13, the suppression of open-heavy-flavor muon production for central collisions is consistent with a recent theoretical calculation performed at the same rapidity () for GeV/ Sharma et al. (2009); Vitev . This calculation includes effects of heavy-quark energy loss (both elastic and inelastic) and in-medium heavy meson dissociation. Additionally, the calculation accounts for cold nuclear matter effects relevant for open heavy flavor production Vitev (2007), namely shadowing (nuclear modification of the parton distribution functions of the nucleon) and initial state energy loss due to multiple scattering of incoming partons before they interact to form the pair.
ACKNOWLEDGMENTS
We thank the staff of the Collider-Accelerator and Physics Departments at Brookhaven National Laboratory and the staff of the other PHENIX participating institutions for their vital contributions. We acknowledge support from the Office of Nuclear Physics in the Office of Science of the Department of Energy, the National Science Foundation, Abilene Christian University Research Council, Research Foundation of SUNY, and Dean of the College of Arts and Sciences, Vanderbilt University (U.S.A), Ministry of Education, Culture, Sports, Science, and Technology and the Japan Society for the Promotion of Science (Japan), Conselho Nacional de Desenvolvimento Científico e Tecnológico and Fundação de Amparo à Pesquisa do Estado de São Paulo (Brazil), Natural Science Foundation of China (P. R. China), Ministry of Education, Youth and Sports (Czech Republic), Centre National de la Recherche Scientifique, Commissariat à l’Énergie Atomique, and Institut National de Physique Nucléaire et de Physique des Particules (France), Ministry of Industry, Science and Tekhnologies, Bundesministerium für Bildung und Forschung, Deutscher Akademischer Austausch Dienst, and Alexander von Humboldt Stiftung (Germany), Hungarian National Science Fund, OTKA (Hungary), Department of Atomic Energy (India), Israel Science Foundation (Israel), National Research Foundation and WCU program of the Ministry Education Science and Technology (Korea), Ministry of Education and Science, Russian Academy of Sciences, Federal Agency of Atomic Energy (Russia), VR and the Wallenberg Foundation (Sweden), the U.S. Civilian Research and Development Foundation for the Independent States of the Former Soviet Union, the US-Hungarian NSF-OTKA-MTA, and the US-Israel Binational Science Foundation.
APPENDIX: DATA TABLES
Table 5 gives the differential invariant cross section of muons from heavy-flavor decay in GeV collisions and corresponds to Fig. 10. Table 5 gives of muons from heavy-flavor mesons decay for the different centrality classes of GeV collisions and corresponds to Fig. 13.
| (GeV/) | (mb) | stat error | syst error |
|---|---|---|---|
| 1.12 | 3.64e-04 | 1.55e-05 | 1.23e-04 |
| 1.36 | 1.19e-04 | 2.85e-06 | 3.39e-05 |
| 1.61 | 4.57e-05 | 1.15e-06 | 1.25e-05 |
| 1.86 | 1.92e-05 | 5.39e-07 | 5.18e-06 |
| 2.11 | 8.31e-06 | 3.02e-07 | 2.27e-06 |
| 2.36 | 3.52e-06 | 1.54e-07 | 1.18e-06 |
| 2.61 | 1.67e-06 | 9.21e-08 | 5.74e-07 |
| 2.86 | 9.12e-07 | 6.04e-08 | 3.18e-07 |
| 3.21 | 3.83e-07 | 2.28e-08 | 1.22e-07 |
| 3.72 | 1.41e-07 | 1.24e-08 | 4.15e-08 |
| 4.38 | 3.34e-08 | 3.49e-09 | 1.12e-08 |
| 5.65 | 2.99e-09 | 1.09e-09 | 1.31e-09 |
| Centrality | (GeV/) | stat error | syst error | |
|---|---|---|---|---|
| 1.13 | 6.93e-01 | 3.98e-02 | 1.87e-01 | |
| 1.38 | 5.41e-01 | 3.49e-02 | 1.87e-01 | |
| 1.63 | 6.57e-01 | 5.32e-02 | 2.20e-01 | |
| 0–20% | 1.875 | 6.26e-01 | 6.74e-02 | 2.28e-01 |
| 2.25 | 4.54e-01 | 6.90e-02 | 1.50e-01 | |
| 2.75 | 3.61e-01 | 1.09e-01 | 1.46e-01 | |
| 3.5 | 3.95e-01 | 1.46e-01 | 2.00e-01 | |
| 1.13 | 1.03e+00 | 5.59e-02 | 2.66e-01 | |
| 1.38 | 9.32e-01 | 4.63e-02 | 2.46e-01 | |
| 1.63 | 1.11e+00 | 6.95e-02 | 3.72e-01 | |
| 20–40% | 1.875 | 1.34e+00 | 1.08e-01 | 4.59e-01 |
| 2.25 | 1.15e+00 | 1.06e-01 | 3.18e-01 | |
| 2.75 | 8.14e-01 | 1.40e-01 | 2.80e-01 | |
| 3.5 | 4.42e-01 | 2.03e-01 | 2.96e-01 | |
| 1.13 | 1.36e+00 | 7.27e-02 | 3.38e-01 | |
| 1.38 | 1.28e+00 | 6.26e-02 | 3.21e-01 | |
| 1.63 | 1.16e+00 | 8.87e-02 | 3.08e-01 | |
| 40–94% | 1.875 | 1.16e+00 | 1.37e-01 | 3.30e-01 |
| 2.25 | 8.64e-01 | 1.43e-01 | 2.73e-01 | |
| 2.75 | 6.94e-01 | 1.92e-01 | 3.30e-01 | |
| 3.5 | 8.09e-01 | 2.80e-01 | 3.47e-01 |
References
- Tannenbaum (2006) M. J. Tannenbaum, Rep. Prog. Phys. 69, 2005 (2006).
- d’Enterria (2010) D. d’Enterria, Landolt-Boernstein, Springer Verlag Vol. 1-23A (2010).
- Adler et al. (2006) S. Adler et al. (PHENIX Collaboration), Phys. Rev. Lett. 96, 032301 (2006).
- Adare et al. (2007a) A. Adare et al. (PHENIX Collaboration), Phys. Rev. Lett. 98, 172301 (2007a).
- Adare et al. (2011) A. Adare et al. (PHENIX Collaboration), Phys. Rev. C 84, 044905 (2011).
- Djordjevic et al. (2005) M. Djordjevic, M. Gyulassy, and S. Wicks, Phys. Rev. Lett. 94, 112301 (2005).
- Armesto et al. (2006) N. Armesto et al., Nucl. Phys. A 774, 589 (2006).
- Gyulassy and Wang (1994) M. Gyulassy and X.-N. Wang, Nucl. Phys. B 420, 583 (1994).
- Baier et al. (1995) R. Baier et al., Phys. Lett. B 345, 277 (1995).
- Dokshitzer and Kharzeev (2001) Y. L. Dokshitzer and D. Kharzeev, Phys. Lett. B 519, 199 (2001).
- Mustafa (2005) M. G. Mustafa, Phys. Rev. C 72, 014905 (2005).
- Moore and Teaney (2005) G. D. Moore and D. Teaney, Phys. Rev. C 71, 064904 (2005).
- van Hees et al. (2006) H. van Hees, V. Greco, and R. Rapp, Phys. Rev. C 73, 034913 (2006).
- Adil and Vitev (2007) A. Adil and I. Vitev, Phys. Lett. B 649, 139 (2007).
- (15) R. Rapp and H. van Hees, arXiv:0903.1096 (2009).
- Adare et al. (2007b) A. Adare et al. (PHENIX Collaboration), Phys. Rev. Lett. 98, 232301 (2007b).
- Adare et al. (2008) A. Adare et al. (PHENIX Collaboration), Phys. Rev. Lett. 101, 122301 (2008).
- Matsui and Satz (1986) T. Matsui and H. Satz, Phys. Lett. B 178, 416 (1986).
- Andronic et al. (2003) A. Andronic et al., Phys. Lett. B 36, 571 (2003).
- Svetitsky (1988) B. Svetitsky, Phys. Rev. D 37, 2484 (1988).
- Thews (2005) R. L. Thews, Eur. Phys. J. 34, 97 (2005).
- Miller et al. (2007) M. L. Miller, K. Reygers, S. J. Sanders, and P. Steinberg, Ann. Rev. Nucl. Part. Sci. 57, 205 (2007).
- Adcox et al. (2003) K. Adcox et al. (PHENIX Collaboration), Nucl. Instrum. Meth. A 499, 469 (2003).
- Allen et al. (2003) M. Allen et al. (PHENIX Collaboration), Nucl. Instrum. Methods A 499, 549 (2003).
- Adler et al. (2007) S. S. Adler et al. (PHENIX Collaboration), Phys. Rev. D 76, 092002 (2007).
- Garishvili (2009) I. Garishvili, Ph.D. thesis, University of Tennessee, Knoxville, TN (2009).
- Hornback (2008) D. E. Hornback, Ph.D. thesis, University of Tennessee, Knoxville, TN (2008).
- (28) R. Brun et al., cERN Program Library Long Write-up W5013 (1994), URL http://wwwasd.web.cern.ch/wwwasd/geant/.
- Adler et al. (2003) S. Adler et al. (PHENIX Collaboration), Phys. Rev. Lett. 91, 241803 (2003).
- Videbaek (2009) F. Videbaek (BRAHMS Collaboration), arXiv:0907.4742 (2009).
- Samset (2006) B. Samset, Ph.D. thesis, University of Oslo, Oslo, Norway (2006).
- Arsene et al. (2004) I. Arsene et al. (BRAHMS Collaboration), Phys. Rev. Lett. 93, 242303 (2004).
- (33) W. Vogelsang, private communication (2008).
- Arsene et al. (2007) I. Arsene et al. (BRAHMS Collaboration), Phys. Rev. Lett. 98, 252001 (2007).
- Yoh et al. (1978) J. Yoh et al., Phys. Rev. Lett. 41, 684 (1978).
- Cacciari et al. (1998) M. Cacciari, M. Greco, and P. Nason, JHEP 9805, 007 (1998).
- Cacciari et al. (2001) M. Cacciari, S. Frixione, and P. Nason, JHEP 0103, 006 (2001).
- Adare et al. (2006) A. Adare et al. (PHENIX Collaboration), Phys. Rev. Lett. 97, 252002 (2006).
- (39) I. Vitev, private communication (2011).
- Sharma et al. (2009) R. Sharma, I. Vitev, and B.-W. Zhang, Phys. Rev. C 80, 054902 (2009).
- (41) C.-Y. Wong, private communication (2009).
- Vitev (2007) I. Vitev, Phys. Rev. C 75, 064906 (2007).
- Noucier et al. (2007) R. Noucier et al., Nucl. Instrum. Methods Phys. Res. B 261, 1067 (2007).
- Kapustinsky et al. (2010) J. S. Kapustinsky et al., Nucl. Instrum. Methods Phys. Res. A 617, 546 (2010).