Spectral line survey of the ultracompact Hii region Mon R2
Abstract
Context. Ultracompact (UC) H II regions constitute one of the earliest phases in the formation of a massive star and are characterized by extreme physical conditions (105 Habing field and 106 cm-3). The UC H II Mon R2 is the closest one and therefore an excellent target to study the chemistry in these complex regions.
Aims. Our goal is to investigate the chemistry of the molecular gas around the UC H II and the possible variations due to the different local physical conditions.
Methods. We carried out a 3mm and 1mm spectral survey using the IRAM 30-m telescope towards three positions that represent different physical environments in Mon R2: (i) the ionization front (IF) at (0,0); two peaks in the molecular cloud (ii) MP1 at the offset (+15,-15) and (iii) MP2 at the farther offset (0,40). In addition, we carried out extensive modeling to explain the chemical differences between the three observed regions.
Results. We detected more than thirty different species (including isotopologues and deuterated compounds). In particular, we detected SO+ and C4H confirming that UV radiation plays an important role in the molecular chemistry of this region. In agreement with this interpretation we detected the typical PDR molecules CN, HCN, HCO, C2H, and c-C3H2. There are chemical differences between the observed positions. While the IF and the MP1 have a chemistry similar to that found in high UV field and dense PDRs like the Orion Bar, the MP2 is more similar to lower UV/density PDRs like the Horsehead nebula. Our chemical modeling supports this interpretation.
In addition to the PDR-like species, we also detected complex molecules such as CH3CN, H2CO, HC3N, CH3OH or CH3C2H that are not usually found in PDRs. A wealth of sulfur compounds, CS, HCS+, C2S, H2CS, SO and SO2 and the deuterated species DCN and C2D were also identified. The origin of the complex species requires further study. The observed deuteration fractionations, [DCN]/[HCN]0.03 and [C2D]/[C2H]0.05, are among the highest in warm regions.
Conclusions. Our results show that the high UV/dense PDRs present a different chemistry from that of the low UV case. Some abundance ratios like [CO+]/[HCO+] or [HCO]/[HCO+] are good diagnostics to differentiate between them. In Mon R2 we have the two classes of PDRs, a high UV PDR towards the IF and the adjacent molecular bar and a low-UV PDR which extends towards the north-west following the border of the cloud.
Key Words.:
Surveys - Stars: formation - ISM: molecules - Line: identification - Astrochemistry - ISM:individual objects:Mon R21 Introduction
During the earliest stages of star formation, the UV radiation from the newly-born star ionizes the most exposed layers of the host molecular cloud, creating a layer of ionized gas (constituted mainly by Hii) and originating a so-called photo-dissociation region (PDR).
Ultracompact HII regions (UC Hii) are defined as regions of ionized gas with diameters smaller than 0.1pc (see Churchwell 2002 for a review). UC Hii regions are expected to expand at velocities of the order of the sound speed (10 km s-1) until reaching equilibrium at dimensions of a few pc. In regions with density of 105 cm-3, Hii regions should remain ultracompact for 3000 yr and only a few dozen should exist in the Galaxy. However, observations suggest that many more UC Hiis exist and that lifetimes should be one to two orders of magnitude larger. Several models have been proposed to explain this lifetime paradox but all have shortcomings. The paradox could be resolved if the molecular gas in which an O star forms is denser and warmer than previously believed, resulting in an initial Stromgren sphere much smaller than originally estimated. This suggestion is supported by observations which show that in dense molecular cloud cores densities of 107 cm-3 and temperatures of 100 K are not atypical (Rizzo et al. 2005). The study of the physics and chemistry of UC Hii and of the surrounding PDRs is the key to understand this evolutionary stage of a massive star.
UC Hii are characterized by extreme UV radiation field ( 105 in units of the Habing field) and gas densities often higher than 106 cm-3. UC Hii may represent the best example of highly UV-irradiated PDRs and can be used as a template for other more complex systems. Highly UV-irradiated PDRs are found in astrophysical environments of high interest such as the surface of circumstellar disks and in the nuclei of starburst galaxies. Unfortunately, our knowledge of the chemistry and physics of UC Hii is still far from complete.
Monoceros R2 (Mon R2) hosts the closest (d=830 pc; Herbst & Racine 1976) and brightest galactic UC Hii, and the only one that can be spatially resolved in the mm domain with single-dish telescopes. It is therefore the best case-study to determine the physical and chemical evolution of massive star forming regions. The central, spherical UC Hii was created by the interaction of the central infrared source IRS1 (Wood & Churchwell 1989) with its host molecular cloud. The formation of the B0V star associated to IRS1 created a huge bipolar outflow (15 = 3.6 pc long, Massi, Felli & Simon 1985; Henning, Chini & Pfau 1992, Tafalla et al. 1994). Later CO 32 mapping of the region showed that this very extended outflow is now inactive. The highest velocity gas is detected towards IRS 3 suggesting that this young star is associated with a compact (14) bipolar outflow (Giannakopoulou et al. 1997).
Further studies at mm-wavelengths (Giannakopoulou et al. 1997; Tafalla et al. 1997; Choi et al. 2000; Rizzo et al. 2003, 2005) showed that the UC Hii region is located inside a cavity bound by a dense molecular ridge at the south-east. The peak of this molecular ridge is located at the offset (+10,10) relative to the peak of the ionized gas, and presents a molecular hydrogen column density of 261022 cm-2. The detection and subsequent analysis of the millimeter lines of the cyclic hydrocarbon species c-C3H2 with the IRAM 30m telescope revealed gas densities of few cm-3 (Rizzo et al. 2005) in the PDR surrounding the Hii region. Recently, Spitzer observations of the H2 rotational lines and the polycyclic aromatic hydrocarbons (PAHs) mid-infrared bands have revealed a thin layer (=4105 cm-3, =11021 cm-2) of warm gas (=574(20) K) between the ionized gas and the dense molecular gas traced by previous millimeter observations (Berné et al. 2009). They interpreted the differences between the spatial distribution of the emission of the H2 rotational lines and the emission from PAHs around the Hii region as the consequence of variations of the local UV field and density in this molecular gas layer.
In this paper, we present a mm molecular survey towards the UC Hii region Mon R2. Our goal is to investigate the molecular chemistry in the PDR that surrounds the UC Hii region and try to construct a pattern to interpret future observations.
| Offset | Freq | HPBW | rms1 | t | |
|---|---|---|---|---|---|
| (GHz) | () | (mK) | (min) | ||
| IF | [83.746, 87.461] | 29 | 0.81 | 6 | 55 |
| (0,0) | [87.517, 91.232] | 29 | 0.80 | 4 | 46 |
| [91.227, 94.942] | 29 | 0.80 | 4 | 46 | |
| [103.197, 106.913] | 24 | 0.80 | 3 | 46 | |
| [106.907, 110.622] | 24 | 0.80 | 4 | 46 | |
| [204.583, 208.294] | 12 | 0.63 | 20 | 41 | |
| [207.184, 210.900] | 12 | 0.63 | 13 | 74 | |
| [216.344.220.059] | 11 | 0.63 | 15 | 28 | |
| MP1 | [83.746, 87.461] | 29 | 0.81 | 3 | 55 |
| (15,15) | [87.517, 91.232] | 29 | 0.80 | 3 | 55 |
| [91.227, 94.942] | 29 | 0.80 | 4 | 55 | |
| [103.197, 106.913] | 24 | 0.80 | 3 | 55 | |
| [106.907, 110.622] | 24 | 0.80 | 3 | 55 | |
| [204.583, 208.294] | 12 | 0.63 | 20 | 41 | |
| [207.184, 210.900] | 12 | 0.63 | 13 | 64 | |
| [216.344, 220.059] | 11 | 0.63 | 10 | 28 | |
| MP2 | [83.746, 87.461] | 29 | 0.81 | 4 | 111 |
| (0,40) | [87.517, 91.232] | 29 | 0.80 | 3 | 46 |
| [91.227, 94.942] | 29 | 0.80 | 3 | 46 | |
| [103.197, 106.913] | 24 | 0.80 | 3 | 46 | |
| [106.907, 110.622] | 24 | 0.80 | 4 | 46 | |
| [204.583, 208.294] | 12 | 0.63 | 20 | 27 | |
| [207.184, 210.900] | 12 | 0.63 | 20 | 24 | |
| [216.344.220.059] | 11 | 0.63 | 10 | 55 |
1 rms in units of TMB with WILMA (spectral resolution of 2 MHz).
2 Observations
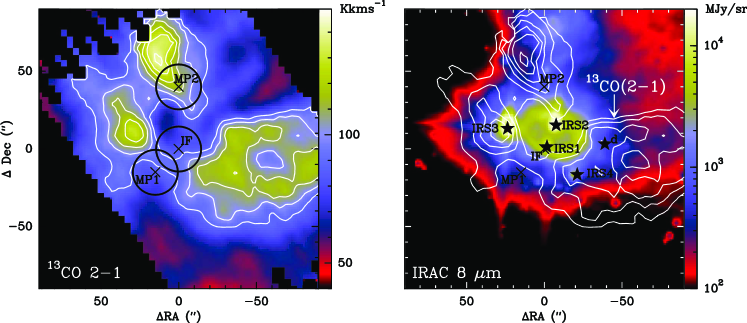
Figure 1 displays a summary of the morphology of Mon R2 at both mm (13CO 21) and mid-IR wavelengths. As expected, the maximum of the emission at 8 m is found towards the Hii region and the infrared star IRS 3. Extended emission is detected around the Hii region that is associated with the PAH band at 7.7 m. This emission does not distribute uniformly around the Hii region. It extends more than one arcminute away from IRS 1 towards the north-west whereas it declines very rapidly towards the south-east.
We performed a 3mm and 1mm spectral survey towards three selected positions that are expected to represent different physical and chemical conditions. Our center position (RA=06h07m46.2s, DEC=-06∘2308.3 (J2000)) corresponds to the position of the ionization front (IF) and that of the ionizing star IRS 1. This offset together with the (15, 15) form a strip across the molecular bar with a sampling of 1 beam (see Fig. 1). For simplicity, we will refer to this offset as MP1 hereafter. The farther offset (0,40) (hereafter MP2) is within the extended PAH emission towards the north-west.
The observations were carried out with the IRAM 30m telescope at Pico Veleta (Spain) during July 2009. To optimize the observing time, we used the dual sideband offered by EMIR. This way we can simultaneously observe 8 GHz in the lower sideband and 8 GHz in the upper sideband, separated by a gap of 8 GHz. The rejection from one band to the other one has been measured by the IRAM staff to be 13 dB. This observing mode allows to cover a band of 16 GHz at 3mm with only one tuning. Initially we observed 16 GHz single polarization (from 87.517 to 94.942 GHz and from 103.197 to 110.622 GHz) using the dual sideband of the 3mm receiver. Afterwards we completed our survey by observing simultaneously the 3mm and 1mm bands (4 GHz at 3mm and 4 GHz at 1mm) and integrating the two polarizations. The 3mm and 1mm EMIR receivers were centered at 85.339 GHz and 217.937 GHz respectively. In the 1mm receiver, we need to drop one of the polarizations due to the poorer quality of the baselines. Two additional settings were used to observe the SO+ 9/27/2 (207.800 GHz) and SO 5432 (206.176 GHz) lines. Simultaneously with the observations of these lines at 1mm, we used the 3mm receiver to obtain the high spectral resolution spectra of the HCO+ 10, HCN 10, C2H 10 and C4H 1110 lines shown in Fig. 2.
The observed spectral ranges, telescope beam efficiencies, half power beam width (HPBW) and rms of our observations are listed in Table 1. The observing procedure was position switching with the reference located at an offset (400, 400). To cover these spectral ranges we used the WILMA autocorrelator which provides a spectral resolution of 2 MHz (5.46.8 km s-1 in the 3mm band). This spectral resolution does not allow to resolve the lines at 3mm and therefore it gives information only on the integrated line intensity. The WILMA spectra and the line integrated intensities are shown in Appendix A. Selected lines were observed simultaneously with the VESPA autocorrelator, providing a spectral resolution of around 40 kHz. These high spectral resolution spectra are shown in Fig. 2 and Gaussian fit parameters to SO, SO2, SO+ and C4H lines are given in Table 3. All the intensities are in unit of main beam brightness temperature (TMB).

3 Results
3.1 Line identification
To identify the lines, we have used three different catalogues, the JPL (http://spec.jpl.nasa.gov), the CDMS (http://www.astro.uni-koeln.de/cdms/catalog) and that from J. Cernicharo (private communication) The observations were performed with 2SB receivers with an image band rejection of 13dB. Therefore, we have some bright lines from the image band in our spectra (see Fig. A1, A2, A3). In Appendix A, we show the spectra of our complete mm survey, and give a list of the detected lines (3-), their identification and line integrated intensities (Table A1). We also list the 4- unidentifed lines and the corresponding frequencies in the signal and image bands. For clarity, upper limits are not included in Table A1. Since the molecular lines are unresolved, the upper limit to the integrated intensity is simply . The Gaussian fit parameters to the recombination lines are given in Table A2.
We have identified 87 lines, out of a total of 105 lines, towards the (0,0) position. The large number of recombination lines shows the presence of ionized gas. In addition, we have also a wealth of lines of complex molecules, more typical of warm and dense molecular clouds. Towards the MP1, we have detected 101 lines, and identified all but 5 lines. At this position the recombination lines are very weak. Towards the MP2 we have detected a total of 99 lines with only 8 unidentified lines. We have tentatively detected the H2CN 30,220,2 line towards the MP1 and MP2. H2CN was firstly detected in TMC1 by Ohishi et al. (1994). If confirmed, this region would be the second one in which this radical has been detected and would corroborate that Mon R2 is a source with an extremely rich carbon chemistry.
In Table 2, we show a summary of the molecular species detected in our survey towards the three positions. We distinguish between certain and tentative detections. Tentative detections correspond to species with only one line detected and at a level of 34-. In these cases, we checked that there were not any other intense (and undetected) line of the same species lying in the spectral ranges covered by our survey. In Table 2 we added the reactive ions CO+ and HOC+ previously detected by Rizzo et al. (2003) because of their importance to interpret the PDR chemistry. Rizzo et al. (2003) did not detect these ions towards the MP1 and they did not search for them in the MP2. Like CO+ and HOC+, the reactive ion SO+ is expected to present very low fractional abundance in the shielded part of the cloud. In this work, SO+ has been searched in the three positions but only detected towards the MP. Many molecules have been detected in the three positions. Some are well-known tracers of PDRs like HCN, HCO, C2H, c-C3H2 and C4H. Others, like CH3CN and CH3OH, are complex molecules usually not found in PDRs. At the end of Table 2, we show those species with certain detections only towards the MP1 and the MP2 peaks, such as C4H, HCO, SiO, C2D and SO2. The sulphuratted carbon-chain C2S has been detected in the MP2 and tentatively in the IF. HNCO has only been detected in the MP.
The detection of recombination lines, PDR tracers and complex molecules is consistent with the interpretation of the PDR as an expanding envelope around the UC Hii region firstly proposed by Rizzo et al. (2005) and recently confirmed by Fuente et al. (2010) and Pilleri et al. (2012a). Even in this situation, we expect to see some chemical differences because of the different incident UV fields and mixing ratios of the different PDR layers.
| IF (0,0) | MP1 (15,15) | MP2 (0,40) | |||
| Detected | Tentative | Det. | Tent. | Det. | Tent. |
| CO+ | |||||
| HOC+ | |||||
| SO+ | |||||
| 13CO | 13CO | 13CO | |||
| C18O | C18O | C18O | |||
| SO | SO | SO | |||
| 13CN | 13CN | ||||
| C15N | C15N | ||||
| 13CS | 13CS | 13CS | |||
| N2H+ | N2H+ | N2H+ | |||
| HCS+ | HCS+ | HCS+ | |||
| HNC | HNC | HNC | |||
| HCN | HCN | HCN | |||
| H13CN | H13CN | H13CN | |||
| HN13C | HN13C | HN13C | |||
| HC15N | HC15N | HC15N | |||
| DCN | DCN | DCN | |||
| HCO+ | HCO+ | HCO+ | |||
| H13CO+ | H13CO+ | H13CO+ | |||
| C2H | C2H | C2H | |||
| c-C3H2 | c-C3H2 | c-C3H2 | |||
| H2CO | H2CO | H2CO | |||
| HC3N | HC3N | HC3N | |||
| H2CS | H2CS | H2CS | |||
| CH3CN | CH3CN | CH3CN | |||
| CH3OH | CH3OH | CH3OH | |||
| CH3C2H | CH3C2H | CH3C2H | |||
| C4H | C4H | C4H | |||
| C2S | HCO | HCO | |||
| SiO | SiO | ||||
| C2D | C2D | ||||
| SO2 | SO2 | ||||
| HNCO | C2S | ||||
| H15NC | H2CN | ||||
| H2CN | |||||
| NH2D | |||||
3.2 High resolution observations: Detection of SO+ and C4H
In Fig. 2 we show the spectra of the HCO+ 10, HCN 10, SO 5432, SO+ 9/27/2, C2H 10, and C4H 1110 lines. This is the first detection of SO+ and C4H towards Mon R2. These lines were observed with the 40 kHz spectral resolution provided by the VESPA autorrelator. Gaussian fits to the SO, SO+ and C4H lines are shown in Table 3.
| Line | HPBW() | Freq(GHz) | I(K km s-1) | vlsr(km s-1) | v(km s-1) | TMB(K) | ||
|---|---|---|---|---|---|---|---|---|
| Offset (0,0) | ||||||||
| SO | 5443 | 12 | 206.176 | 0.70(0.05) | 10.56(0.08) | 2.55(0.27) | 0.26 | |
| SO+ | 9/27/2 (f) | 12 | 208.965 | 0.11(0.05)t | 10.09(1.00) | 3.87(1.72) | 0.026 | |
| SO+ | 9/27/2 (e) | 12 | 208.590 | 0.16 | ||||
| SO2 | 32,221,1 | 12 | 208.700 | 0.16 | ||||
| C4H | 1110 | 24 | 104.666 | 0.09(0.02) | 9.77(0.46) | 3.56(1.11) | 0.025 | |
| C4H | 1110 | 24 | 104.705 | 0.11(0.02) | 10.17(0.39) | 3.77(0.80) | 0.028 | |
| Offset (15,15) | ||||||||
| SO | 5443 | 12 | 206.176 | 1.16(0.04) | 10.13(0.04) | 2.59(0.09) | 0.42 | |
| SO+ | 9/27/2 (f) | 12 | 208.965 | 0.26(0.03) | 10.17(0.12) | 2.06(0.21) | 0.12 | |
| SO+ | 9/27/2 (e) | 12 | 208.590 | 0.13(0.04) | 10.20(0.21) | 1.47(0.53) | 0.08 | |
| SO2 | 32,221,1 | 12 | 208.700 | 0.07 | ||||
| C4H | 1110 | 24 | 104.666 | 0.09(0.03) | 8.70(0.81) | 5.14(1.64) | 0.017 | |
| C4H | 1110 | 24 | 104.705 | 0.14(0.03) | 9.78(0.63) | 5.90(1.17) | 0.022 | |
| Offset (0,40) | ||||||||
| SO | 5443 | 12 | 206.176 | 1.19(0.03) | 9.65(0.02) | 1.70(0.06) | 0.66 | |
| SO+ | 9/27/2 (f) | 12 | 208.965 | 0.17 | ||||
| SO+ | 9/27/2 (e) | 12 | 208.590 | 0.17 | ||||
| SO2 | 32,221,1 | 12 | 208.700 | 0.22 | ||||
| C4H | 1110 | 24 | 104.666 | 0.14(0.02) | 6.53(0.07) | 1.11(0.16) | 0.12 | |
| C4H | 1110 | 24 | 104.705 | 0.09(0.02) | 7.99(0.09) | 0.90(0.18) | 0.10 | |
t Tentative, 3-
There are significant differences among the profiles of the lines shown in Fig. 2 which testify the existence of several gas components. A clear absorption is seen in the HCO+ 10, HCN 10 and C2H 10 lines towards the IF position. This self-absorbed feature lies at a velocity of 10.8 km s-1 which is the central velocity of the SO 5443 line emission. This suggests that the SO 5443 emission is coming from the cloud around the Hii region. Towards the MP1 the profiles of the SO 5443 and SO+ 9/27/2 lines are wider and centered at 10.0 km s-1. The line profiles towards the MP2 are even more complicated (see Fig. 2). Similarly to what happens in the other positions, there is a self-absorbed feature at 10.8 km s-1 which is the velocity of the external cloud, but the HCN 10 line also presents self-absorption at 9 km s-1. The C2H 10 and C4H 1110 lines show wide profiles, with a red-shifted wing up to velocities of 18 km s-1. The similarity between the profiles of the C2H 10 and C4H 1110 lines supports the interpretation of these two species share a similar chemistry and come from the same region. Since C4H is found to be abundant in low UV PDRs and has not been detected in the high velocity wings of bipolar outflows (see e.g. Bachiller & Pérez-Gutiérrez 1997), these high velocity wings are very likely tracing the PDR around the Hii region (Fuente et al. 2010, Pilleri et al. 2012a). The existence of several bipolar outflows in this regions makes difficult, however, to disentangle the origin of this high velocity gas. The profile of the SO 5443 line is, however, Gaussian and centered at the systemic velocity suggesting that its emission originates in the dense cloud.
| C18O | Yang et al. 2010 |
|---|---|
| SO | Lique et al. 2006 |
| CS | Lique et al. 2007 |
| SiO | Dayou & Balanca, 2006 |
| HCN, HNC | Sarrasin et al. 2010 |
| HCO+ | Flower, D.R. 1999 |
| HCS+ | Monteiro 1984 |
| N2H+ | Daniel et al. 2005 |
| SO2 | Cernicharo et al. 2011 |
| H2CO | Green et al. 1991 |
| c-C3H2 | Avery & Green 1989 |
| HC3N | Wernli et al. 2007 |
4 Gas Physical Conditions and column densities
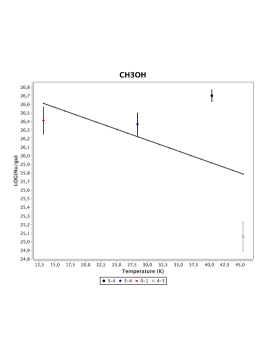
To derive accurate column densities it is important to have a good estimate of the gas physical conditions. For the species C18O, SO, 13CN, SiO, C2S, SO2, H2CO, H2CS, c-C3H2, HC3N, C4H, CH3OH, CH3CN and CH3C2H we detected several transitions and a multitransitional study was possible. We used the rotational diagram technique to derive beam averaged rotation temperatures and column densities. This technique is based on the assumption of optically thin emission for all the lines of a given species. For optically thin emission, the integrated intensity of each line is proportional to the population of the upper level of the corresponding transition. In this case, a rotational diagram provides good estimates of the rotation temperature and total column density (see e.g. Schloerb et al. 1983). In the case of optically thick lines, the integrated intensity of the line is not proportional to the population of the upper level anymore and the rotation temperature cannot be derived with this technique.
The lines of the most abundant isotopologues are optically thick and in many cases the lines are self-absorbed (see Fig. 2). For this reason, we only made rotational diagrams for the rarer isotopologues C18O, H13CO+ and H13CN. The column densities of CO, HCO+ and HCN were derived assuming the isotopic ratios 12C/13C=50 (Savage et al. 2002 and references therein) and 16O/18O=500. The information of our survey was completed with the H13CO+ 32, H13CN 32 and C2H 32 lines obtained from our unpublished HERA maps (Pilleri et al. 2012b, in preparation) after degrading their angular resolution to that of the observed 3mm transitions. The resulting integrated line intensities are shown at the end of Tables A1. In these cases, the rotational temperatures and column densites derived from the rotational diagrams are not affected by the unknown beam filling factor. For the other cases, we assumed a beam filling factor of unity for the 3mm and 1mm lines. This is reasonable taking into account that the molecular emission extends over a region of about 22 (see Fig. 1), which is larger than the beam of the 30m telescope at both 3mm and 1mm wavelengths but it would overestimate the rotational temperature if the size of the emission is smaller than 29. Comparing the rotational temperatures thus derived with those from H13CO+, H13CN and C2H lines we estimate that the uncertainty in the column density estimates because of the unknown filling factor is of a factor of 3.
Where possible we estimated the molecular column densitites and the molecular hydrogen density using the large velocity gradient radiative transfer code by Cernicharo et al. (2006). The collisional coefficients adopted in our calculations are shown in Table 4. For 13CS, H13CO+, H13CN, HC15N, HN13C and DCN we used the collisional coefficients of the main isotopologue. We fixed the gas kinetic temperature and varied the density and column density to fit the line intensities. Based on the rotation temperatures of C18O and CH3CN data, we assumed Tk=50 K for the IF and MP1 positions and Tk=70 K for the MP2. Since the kinetic temperature is fixed in our calculations, the ratio between the intensities of the two lines observed is mainly dependent on the density while the intensity of each line is more dependent on the total column density. The obtained densities vary between a few 105 cm-3 to 106 cm-3. Our results are in agreement with Tafalla et al. (1997) who derived densities of a few 105 cm-3 from the CS lines and its isotopes. For some species we have detected only one line. In these cases we adopted a density n(H2)=5105 cm-3 in our LVG calculations for the three positions.
In Table 5 we show the column densities derived towards the three observed positions for all the detected species. The corresponding rotational diagrams are shown in appendix B (see Fig. B1, B2, B3). The column densities obtained using the LVG approach are in agreement with the rotational diagrams calculations which confirms our assumption that the emission is optically thin. For those species for which the collisional coefficients were not known and only one transition was observed, we estimated the column densities assuming optically thin emission and Local Thermodynamic Equilibrium with the level′s population described by a given rotation temperature. The assumed rotation temperatures are based on the results of the rotational diagrams of other molecules with similar excitation conditions. For SO+, 13CN, C2D, C2S, HCO, HNCO, and C4H, we assumed Trot=10 K, similar to those obtained using rotational diagrams for C2H and H13CO+. For CH3CN and CH3C2H, we adopted Trot=30 K. Some cases are marked with the label bad estimate” in Table 5 because the uncertainty in the column density estimates could be as high as a factor of 10. This is the case of CH3CN and CH3OH. The main source of uncertainty in these molecules is that our spectral resolution does not allow to resolve all the K-components of the same rotational line. The lack of detection of the CH3CN 5040 line towards the IF suggests that the emission of this transition could be self-absorbed.
Molecular abundances were calculated assuming a canonical C18O wrt H2 abundance of 1.710-7. The abundance of each species wrt H2 is then given by the expression .
| RDa | LVGb | LTEc | fXd | |||||
| Molecule | Trot | N | n | N | Trote | N | ||
| (K) | (cm-2) | (cm-3) | (cm-2) | (K) | (cm-2) | |||
| IF (0,0) | ||||||||
| C18O | 40(5) | 7.3(1.0)1015 | 3104 | 9.01015 | 1.710-7e | |||
| SO | 100(600) | 2.8(10)1013 | 6.510-10 | Bad estimate | ||||
| SO+ | 10 | 1.01012 | 2.310-11 | |||||
| 13CN | 10 | 1.21013 | 2.810-10 | |||||
| 13CS | 5105f | 1.71012 | 3.910-11 | Col CS | ||||
| SiO | 5105f | 3.01011 | 7.010-12 | |||||
| HNC | 5105f | 4.21012 | 9.810-11 | |||||
| H13CN | 9(1) | 3.0(1.3)1012 | 1106 | 3.01012 | 7.010-11 | Col HCN | ||
| HN13C | 5105f | 4.01011 | 9.310-12 | Col HNC | ||||
| HC15N | 5105f | 4.01011 | 9.310-12 | Col HCN | ||||
| DCN | 5105f | 3.01012 | 7.010-11 | Col HCN | ||||
| C2H | 16(1) | 3.7(0.1)1014 | 8.610-9 | self-absorption | ||||
| C2D | 10 | 7.51012 | 1.710-10 | |||||
| H13CO+ | 22(5) | 8.7(4.7)1011 | 1106 | 11012 | 2.010-11 | |||
| HCS+ | 5105f | 8.01012 | 1.910-10 | |||||
| N2H+ | 5105f | 2.11012 | 4.910-11 | |||||
| C2S | 10 | 2.01012 | 4.610-11 | Tentative | ||||
| HCO | 10 | 3.01012 | 7.010-11 | |||||
| SO2 | 5105f | 4.31012 | 1.010-10 | |||||
| H2CO | 65(13) | 6.7(4.3)1013 | 5105 | 5.61013 | 1.510-9 | ortho/para=3 | ||
| H2CS | 33(11) | 5.6(7.5)1012 | 1.310-10 | ortho/para=3 | ||||
| HNCO | 10 | 8.01011 | 1.810-11 | |||||
| c-C3H2 | 11(2) | 7.1(7.0)1012 | 7105 | 8.51012 | 2.010-10 | ortho/para=3,self-absorption | ||
| HC3N | 33(2) | 3.4(0.5)1012 | 7105 | 3.41012 | 7.910-11 | |||
| C4H | 10 | 2.71013 | 6.310-10 | |||||
| CH3OH | 9(3) | 6.4(10)1014 | 1.510-8 | Bad estimate | ||||
| CH3CN | 30 | 1.61012 | 3.710-11 | Bad estimate | ||||
| CH3C2H | 27(6) | 8.6(8.6)1013 | 2.010-9 | Bad estimate | ||||
| MP1 (15,15) | ||||||||
| C18O | 38(2) | 9.7(0.5)1015 | 3104 | 9.71015 | 1.710-7d | |||
| SO | 54(15) | 3.0(1.2)1013 | 2106 | 3.21013 | 5.210-10 | |||
| SO+ | 10 | 3.01012 | 5.210-11 | |||||
| 13CN | 3(2) | 1.4(3.5)1015 | 10 | 9.01012 | 1.610-10 | Bad estimate | ||
| 13CS | 5105f | 2.51012 | 4.410-11 | Col CS | ||||
| SiO | 11(2) | 6.0(6.0)1011 | 8105 | 6.01011 | 1.010-11 | |||
| HNC | 5105f | 1.51013 | 2.610-10 | |||||
| H13CN | 8(1) | 3.7(1.6)1012 | 7105 | 3.01012 | 6.510-11 | Col HCN | ||
| HN13C | 5105f | 8.01011 | 1.410-11 | Col HNC | ||||
| HC15N | 5105f | 8.01011 | 1.410-11 | Col HCN | ||||
| H15NC | 5105f | 1.81011 | 3.110-12 | Col HNC | ||||
| DCN | 5105f | 6.01012 | 1.010-10 | Col HCN | ||||
| C2H | 13(1) | 4.6(0.5)1014 | 8.110-9 | |||||
| C2D | 10 | 1.31013 | 2.310-10 | |||||
| H13CO+ | 11(1) | 1.5(0.1)1012 | 3105 | 1.41012 | 2.610-11 | |||
| HCS+ | 5105f | 1.61012 | 2.810-11 | |||||
| N2H+ | 5105f | 1.21013 | 2.110-10 | |||||
| C2S | 10 | 1.11012 | 1.910-11 | |||||
| HCO | 10 | 5.01012 | 8.810-11 | |||||
| SO2 | 5105f | 4.51012 | 7.910-11 | |||||
| H2CO | 53(1) | 1.1(0.1)1014 | 5105 | 8.91013 | 1.910-9 | ortho/para=3 | ||
| H2CS | 22(6) | 9.0(5.9)1012 | 1.610-10 | ortho/para=3 | ||||
| HNCO | 10 | 1.51012 | 2.610-11 | |||||
| c-C3H2 | 11(2) | 9.3(3.6)1012 | 3105 | 8.01012 | 1.610-10 | ortho/para=3 | ||
| HC3N | 26(1) | 9.3(1.3)1012 | 5105 | 9.01012 | 1.610-10 | |||
| C4H | 10 | 4.01013 | 7.010-10 | |||||
| CH3OH | 16(8) | 1.1(4.8)1013 | 1.910-10 | Bad estimate | ||||
| CH3CN | 30(6) | 4.2(3.6)1012 | 7.310-11 | Bad estimate | ||||
| CH3C2H | 39(16) | 7.6(10)1013 | 1.310-9 | |||||
a Rotational diagrams. Numbers in parenthesis are the mathematical error of the fitting.
bLVG calculations assuming Tk=50 K, v=5 km s-1 for the IF and MP1 and Tk=70 K for the MP2 positions. When only one transition is
observed, a molecular hydrogen density of 5105 cm-3.c Local Thermodynamic Equilibrium calculations. d Fractional abundance derived assuming
N(C18O)/N(H2)=1.710-7. e Assumed C18O wrt H2 abundance. fAssumed molecular hydrogen density.
| RDa | LVGb | LTEc | fXd | |||||
|---|---|---|---|---|---|---|---|---|
| Molecule | Trot | N | n | N | Trote | N | ||
| (K) | (cm-2) | (cm-3) | (cm-2) | (K) | (cm-2) | |||
| MP2 (0,40) | ||||||||
| C18O | 65(8) | 1.3(0.2)1016 | 3104 | 1.31016 | 1.710-7d | |||
| SO | 21(8) | 2.9(2.3)1013 | 2105 | 5.01013 | 3.810-10 | |||
| SO+ | 10 | 1.81012 | 2.310-11 | |||||
| 13CN | 4(2) | 3.5(1.5)1013 | 4.610-10 | |||||
| 13CS | 5105f | 2.51012 | 3.310-11 | Col CS | ||||
| SiO | 11(1) | 6.5(1.2)1011 | 5105 | 1.01012 | 8.510-12 | |||
| HNC | 5105f | 1.21013 | 1.610-10 | |||||
| H13CN | 8(1) | 2.9(0.5)1012 | 6105 | 2.61012 | 3.810-11 | Col HCN | ||
| HN13C | 5105f | 5.01011 | 6.510-12 | Col HNC | ||||
| HC15N | 5105f | 5.01011 | 6.510-12 | Col HCN | ||||
| DCN | 5105f | 3.21012 | 4.210-11 | Col HCN | ||||
| C2H | 12(1) | 4.1(0.3)1014 | 5.410-9 | |||||
| C2D | 10 | 2.01013 | 2.610-10 | |||||
| H13CO+ | 10(1) | 1.1(0.3)1012 | 2105 | 1.31012 | 1.410-11 | |||
| HCS+ | 5105f | 5.01012 | 6.510-11 | |||||
| N2H+ | 5105f | 4.01012 | 5.210-11 | |||||
| C2S | 11(7) | 1.9(5.3)1012 | 2.510-11 | |||||
| HCO | 10 | 1.31013 | 1.710-10 | |||||
| SO2 | 28(15) | 1.0(1.4)1013 | 5106 | 1.01013 | 1.310-10 | only 3mm lines fitted | ||
| H2CO | 52(4) | 9.3(2.0)1013 | 1107 | 8.01013 | 1.210-9 | ortho/para=3 | ||
| H2CS | 60(38) | 1.3(2.1)1013 | 1.710-10 | ortho/para=3 | ||||
| HNCO | 10 | 9.01011 | 1.210-11 | |||||
| c-C3H2 | 12(1) | 1.3(0.1)1013 | 4105 | 1.31013 | 1.710-10 | ortho/para=3 | ||
| HC3N | 35(3) | 6.1(1.2)1012 | 5105 | 6.01012 | 8.010-11 | |||
| C4H | 9(4) | 1.2(1.6)1014 | 1.610-9 | |||||
| CH3OH | 41(74) | 2.1(7.0)1014 | 2.710-9 | Bad estimate | ||||
| CH3CN | 59(20) | 5.6(2.2)1012 | 7.310-11 | Bad estimate | ||||
| CH3C2H | 30 | 9.01013 | 1.210-10 | Bad estimate | ||||
| Mon R2 | Ref | Orion Bar | Ref | NGC 7023 | Ref | Horsehead | Ref | |||
| (0,0) | (15,15) | (0,40) | IF | (25,40) | PDR peak | |||||
| (Habing) | 5105 | 1,2 | 2104 | 3,4 | 2103 | 5 | 100 | 6,7,8 | ||
| (cm-3)a | 4106 | 5105 | 2105 | 105 | ||||||
| H13CN /HN13C | 7.5 | 5 | 4 | 1 | 2 | 3 | ||||
| HCN /HNC | 3 | 3 | 2 | 5 | ||||||
| 13CN/H13CN | 4 | 2 | 512 | 1 | ||||||
| CN/HCN | 3.0 | 3 | 4.5 | 5 | ||||||
| H13CO+/H13CN | 0.29 | 0.40 | 0.37 | 1 | ||||||
| HCO+/HCN | 0.9 | 3 | 3.3 | 5 | ||||||
| CO+/H13CO+ | 0.53 | 1,2 | 0.52 | 3,4 | 0.6 | 4,5 | 0.03 | 6 | ||
| H13CO+/HOC+ | 5.8 | 1,2 | 3.8 | 3,4 | 5–14b | 4,5 | 4 | 6 | ||
| c-C3H2/C2H | 0.02 | 0.02 | 0.03 | 1 | 0.016 | 3,4 | 0.03 | 4,5 | 0.06 | 7 |
| C4H/C2H | 0.07 | 0.09 | 0.3 | 1 | 0.1 | 7 | ||||
| HCO/H13CO+ | 3 | 3 | 12 | 1 | 50c | 8,9 | ||||
| SO+/SO | 0.1 | 0.06 | 1 | |||||||
| CS/HCS+ | 11d | 78d | 25d | 1 | 0.008 | 10 | ||||
a The density is not uniform in these regions. We indicate a representative density of the clumps/filaments.
b Depending on the assumed excitation conditions.
c It strongly depends on the position, varying between 1 in the shielded core to 50 in the HCO peak. The value in the table corresponds to the HCO peak derived from 14 angular resolution observations.
d Obtained from our 13CS data assuming 12C/13C=50.
References: (1) This work; (2) Rizzo et al. 2003; (3) Fuente et al. 1996; (4) Fuente et al. 2003; (5) Fuente et al. 1993; (6) Goicoechea et al. 2009; (7) Teyssier et al. 2004; (8) Gerin et al. 2009a; (9) Gerin et al. 2009b; (10) Goicoechea et al. 2006.
5 Comparison with protypical PDRs
The 8 m IRAC image undoubtedly shows the existence of an extended PDR in this region. One of the goals of this paper is to establish the role of the UV photons, relative to other phenomena linked to the star formation process like bipolar outflows, in the chemistry of this molecular cloud. For this aim, we follow a two-fold strategy. First of all we compare the chemical composition in the three observed positions. Since the average kinetic temperature and density in the three positions are quite similar, differences in the chemistry can be interpreted as due to the different incident UV field. Second, we compare Mon R2 with that in other prototypical PDRs like the Orion Bar, NGC 7023 and the Horsehead.
The IF and MP1 define a cut along the dense PDR in Mon R2, the MP1 being the more shielded position. Comparing the molecular abundances between these two positions, we find that only one molecule, HCS+, has a larger (by a factor of 6) abundance towards the IF than towards the MP1. This suggests that HCS+ comes from the inner PDR like the reactive molecular ions CO+ and HOC+ (Rizzo et al. 2003, 2005). The reactive ion SO+ is, however, more abundant towards the MP1. Fuente et al. (2003) already suggested that this molecular ion comes from a more shielded layer than the ions CO+ and HOC+. There are some species that present significantly lower abundance towards the IF. These species are N2H+ and HC3N proving that are easily destroyed by UV photons and are only found in the more shielded gas. A peculiar chemistry is detected towards the MP2. This position is very rich in carbon chains such as C2H, C4H, C2S, and c-C3H2. As we discuss below this different chemistry could be due to MP2 being related with a low UV PDR.
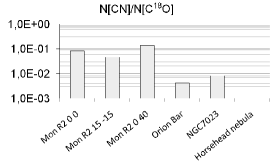
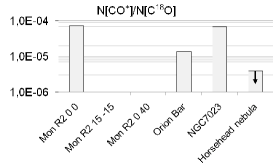
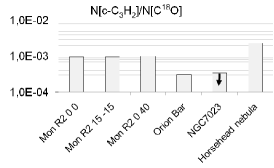
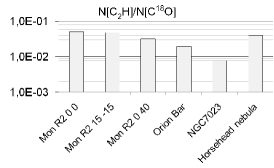
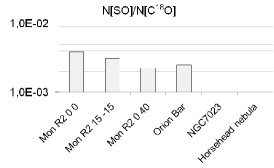
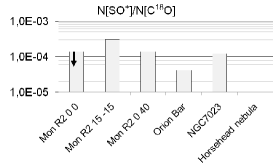
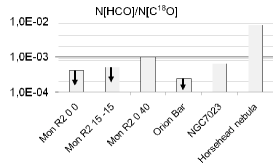
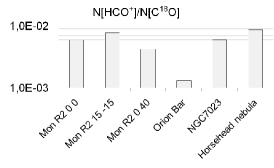
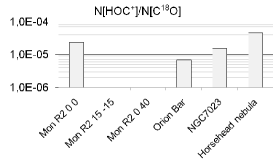
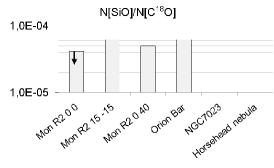
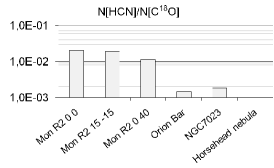
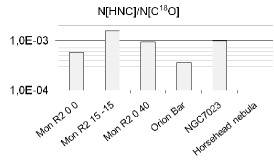
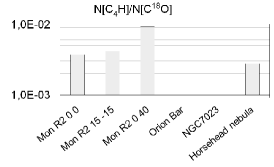
In Fig. 3, we compare the molecular abundances relative to C18O measured in Mon R2 with those in other prototypical PDRs. This kind of comparison is not straightforward since data with different spatial resolutions and calibrations are used. Despite this, we can extract some qualitative conclusions. Mon R2 seems richer in the carbon chains HCN and CN than other prototypical PDRs in star forming regions such as the Orion Bar, NGC 7023 and the Horsehead (see Fig. 3). One could think that this high HCN and CN abundance could be related with the bipolar outflows in the region. This interpretation will be discussed in Sect. 5.2. The reactive ion CO+ is only detected in highly UV irradiated positions such as the IF in Mon R2, the Orion Bar and NGC 7023. The chemistry of the MP2 position in Mon R2 resembles that of the Horsehead, with a high C4H and HCO abundance.
Abundance ratios of chemically related molecules and with similar excitations conditions are more accurate than absolute molecular abundances. On one hand, the spatial extent of the emission is expected the same, and the abundance ratio is not sensitive to the unknown beam filling factor. Moreover, as long as the excitation is similar for the two species, the abundance ratio is not sensitive to uncertainties in the assumed physical conditions. For these reasons, abundance ratios instead of fractional abundances are often used to compare with models. In Table 6 we show some interesting abundance ratios in Mon R2 and compared them with the values in the other prototypical PDRs.
5.1 HCN/HNC
In this source, the HCN and HNC lines are optically thick. Moreover, the clear self-absorption features of these lines prevent from calculating reliable molecular abundances. Instead, we use the rare isotopes H13CN and HN13C. Using a 12C/13C ratio of 50 we derived X(HCN)510-9 and [HCN]/[HNC]58 in the three observed positions. The [HCN]/[HNC] ratio is a factor 2 larger than in NGC 7023 and the Orion Bar (Fuente et al. 1996, 2003). In addition to H13CN, we have detected HC15N towards the three targeted positions. The [H13CN]/[HC15N] is about 10 towards the three offsets, which would imply 14N/15N=500 with our assumed 12C/13C isotopic ratio. This ratio is similar to that measured by Gerin et al. (2009c) in dark clouds and low mass star forming regions, and consistent with the protosolar value of 424. Assuming a higher 12C/13C isotopic ratio, 89, would imply 14N/15N=890. In MP1, we have a tentative detection of the H15NC 10 line. Using this 3- detection we derive [HC15N]/[H15NC] = 4, similar to the values found in NGC 7023 and the Orion Bar. A complete multitransitional study of HCN and its isotopologues and detailed source modelling is required to have a more accurate estimate of the [HCN]/[HNC] ratio and how it changes across the envelope in Mon R2
5.2 CN/HCN
Fuente et al. (1993) detected a [CN]/[HCN] abundance ratio larger than unity in the north-west PDR of NGC 7023 and interpreted it as the consequence of the photodissociation of HCN into CN. Since then, the [CN]/[HCN] ratio has been successfully used as a PDR tracer in different environments, PDRs associated with star forming regions such as the Orion Bar and NGC 7023, planetary nebulae, protoplanetary disks and even external galaxies. In Mon R2 we use the rarer isotopes 13CN and H13CN to derive the [CN]/[HCN] abundance ratio. We derive a [CN]/[HCN] abundance ratio 212 towards the three positions. This high [CN]/[HCN] abundance ratio is consistent with that found in other environments such as NGC 7023, the Orion Bar, the planetary nebula NGC 7027 and the starburst galaxy M 82. The [CN]/[HCN] ratio in bipolar outflow is 1 (see Bachiller & Pérez-Gutiérrez 1997). This support the interpretation of CN and HCN coming from the PDR instead of from the bipolar outflows.
5.3 CS/HCS+
We have detected HCS+ towards the ionization front with an abundance of 1.910-10. This is one of the few molecules that shows enhanced abundance at this position and argues in favor of HCS+ arising from the surface of the PDR. The HCS+ abundance measured towards the IF is a factor of 5 larger than that observed in the Horsehead nebula (Goicoechea et al. 2006) but comparable with that measured by Lucas & Liszt (2002) towards diffuse clouds. The HCS+ abundance towards the other two positions, MP1 and the MP2 peaks, is lower by a factor of 4 and more similar to that measured in the Horsehead nebula. The derived [CS]/[HCS+] ratio is uncertain because the CS lines are optically thick. From our 13CS observations and assuming 12CS/13CS=50, we obtain that the [CS]/[HCS+]11 in IF and 25 in MP2. Tafalla et al. (1997) derived column densities of N(CS)=5.61013 cm-2 towards the IF from an LVG analysis using the CS J=21, J=32 and 54 lines which would imply [CS]/[HCS+]7. These values are closer to the value [CS]/[HCS+]10 measured in diffuse clouds than to the value 175 measured towards the Horsehead nebula.
5.4 SO+,SO, SO2, H2CS
SO+ has been detected in warm and cold clouds with abundances ranging from 10-9–10-11. These fractional abundances can be explained by gas phase ion-molecule chemistry (Turner 1994). In PDRs, SO+ has been detected in NGC 7023 and the Orion Bar. The SO+ abundance in these regions is 510-11 and 110-10 respectively. In Mon R2, we have detected SO+ in the MP1, with an abundance of 510-11. We have not detected SO+ towards the MP2 peak. In PDRs, SO+ is primarily formed via S+ + OHSO+ + H and removed by dissociative recombination in S + O. The lack of SO+ in the MP2 peak is very likely related to a lower abundance of OH at this position. The radical OH is formed by endothermic reactions in the outer layers of the PDR and is very sensitive to the gas kinetic temperature.
In addition to CS, HCS+, SO and SO+, we have also detected the more complex sulphuretted species C2S, H2CS and SO2. SO has similar fractional abundance towards the three positions, but there are some differences in the abundances of the other compounds. The carbon chains like C2S and H2CS are more abundant towards the MP2 than towards the IF and MP1. SO2 is not detected towards the IF, corroborating previous interpretation of this molecule being easily destroyed by UV radiation (see e.g. Fuente et al. 2003).
5.5 SiO
SiO was detected in Mon R2 by Rizzo et al. (2005). They derived a SiO column density of 1.11011 cm-2 towards the IF which is consistent with our upper limit of 3.01011 cm-2. We have detected SiO towards MP1 and MP2 with an abundance of 10-11 which is lower than that determined by Schilke et al. (2001) towards the Orion Bar (710-11 in the IF) and consistent with that expected in PDRs. There is no hint of enhanced SiO abundance produced by the shocks associated with the bipolar outflows or the expected shock front associated to the expansion of the UC Hii. This is not surprising since an expansion velocity of 1.0 km/s (Fuente et al. 2010; Pilleri et al. 2012a) is not high enough to destroy the core of the silicates grains. The low SiO abundance argues against a dominant role of shocks in the chemistry of this region.
5.6 C2H, c-C3H2, C4H
Intense C2H and c-C3H2 emission is detected in all the observed positions with the maximum column density towards MP2. The maximum fractional abundances are X(C2H)510-9 and X(c-C3H2)1.710-10. These values are a factor of 3 lower than those measured towards the Horsehead and the Orion Bar but similar to those measured in NGC 7023. Taking into account the uncertainties in the calculation of the fractional abundances, these differences are not significant. Note that for the Horsehead we have taken the single-dish column densities published by Teyssier et al. (2004) to compare with our data because interferometric observations filter out the extended emission tracing only the small spatial scales. The [c-C3H2]/[C2H] ratio is quite uniform with a value of 0.03. The large chain C4H had only been detected in low-UV PDRs (IC 63, -Oph and the Horsehead) thus far (Teyssier et al. 2004; Pety et al. 2005). The [C4H]/[C2H] ratio is maximum at the MP2 confirming that the PDR at this position is particularly rich in carbon chains.
5.7 HCO
The formyl radical, HCO, was detected in the interstellar medium by Snyder et al. (1976). Pioneering studies by Schenewerk et al. (1988) pointed out to an association of large HCO abundances with the gas around Hii regions. Schilke et al. (2001) detected HCO towards NGC 2023, the offset (-30,80) in NGC 7023, the position referred to as Bar(CO) in the Orion Bar and the IF in S140. From a limited mapping they concluded that HCO is associated with the PDR component and explained the enhancement of HCO abundance as the consequence of the photodissociation of the H2CO molecules released from the grain mantles by UV photons. García-Burillo et al. (2002) mapped this radical in the starburst M 82 and also interpreted it as arising in the giant PDR in the disk of this galaxy. Gerin et al. (2009a) carried out a high angular resolution mapping of the Horsehead in this radical. The maximum of the HCO emission was found towards a position where the PAH band emission is particularly intense. The HCO emission becomes fainter in the more shielded molecular gas. After updating some reaction rates, in particular O+CH2 HCO + H, they found that gas-phase chemistry could account for the high HCO abundance without invoking the photodesorption of H2CO from the ice mantles. In Mon R2, we have detected HCO towards MP2 with a fractional abundance of 1.710-10. Towards the IF and the MP1, the HCO abundance is at least a factor of 2 lower than towards the MP2. Note that Schilke et al. (2001) did not detect HCO towards the IF but only in the position referred to as Bar(CO) in their paper that could correspond to a lower UV radiation field.
5.8 H2CO
We have derived a H2CO abundance of 1210-9 in Mon R2. This abundance is close to that found in hot cores (see e.g. Sutton et al 1995) and higher than that expected in a PDR. Guzmán et al. (2011) studied the formation of H2CO in the Horsehead. They derived an H2CO abundance of 4610-10 in the PDR peak, similar to that found in the shielded core position. They could not explain the H2CO abundance in this PDR only with gas phase chemistry. However, they obtained a good agreement between model predictions and observations with a gas phase+surface chemistry model in which H2CO can be formed on the grain surfaces and photo-desorbed to the gas phase, in addition to the gas phase route. In Mon R2, the emission of H2CO is ubiquitous (Giannakopoulou et al. 1997) and the low spatial resolution of our observations makes it difficult to discern its origin: the PDR, the more shielded molecular gas or the bipolar outflows.
5.9 Complex molecules: CH3OH, CH3CN, HC3N
In addition to PDR-like molecules, we have detected in our survey other complex species that are not expected to be abundant in PDRs and are usually associated with the chemistry of warm clouds. This is the case of CH3OH, CH3CN and HC3N. In the case of methanol, our fractional abundance estimates are very uncertain. The abundance of CH3CN is also quite constant and equal to 710-11. For HC3N we measured abundances of 710-1110-10. These values are lower than those found in hot cores, but very similar to those found in warm molecular clouds such as the Orion Ridge and in the envelopes of massive protostars.
Complex molecules are rapidly destroyed by UV radiation. Assuming a typical photodissociation rate of 10-10 s-1, the lifetime of complex molecules would be 105 yr only for AV10 mag. Fuente et al. (2010) and Pilleri et al. (2012a) estimated an expansion velocity of 1.0 km s-1 for this UC Hii which implies a dynamical time of 105 yr. This means that complex molecules of the initial core could have survived as long as they were within clumps in which the visual extinction is 10 mag. High spatial resolution observations are required to determine the region from which the emission of complex molecules arises and put additional constraints to their formation mechanism.
5.10 Deuteration: DCN, C2D
We have detected DCN and C2D towards the MP1 and MP2. The DCN abundances are X(DCN)=1.010-10 (MP1) and X(DCN)=4.210-11 (MP2). The C2D abundances are X(C2D)=2.310-10 (MP1) and X(C2D)=2.610-10 (MP2). These abundances correspond to deuterium fractionation values of 0.030.05 for both HCN and C2H. The deuterium fractionation of HCN is a factor of 10 larger than that measured by Parise et al. (2009) in the position Bar(HCN) of the Orion Bar. The deuterated species C2D was not detected in Orion with a lower limit to the C2D/C2H ratio of 0.04. Pety et al. (2007) detected DCO+ in a cold clump (Tk1020 K) towards the Horsehead and measured [DCO+]/[H13CO+] =0.02. There is not any intense transition of DCO+ in the frequency range covered by our survey. Therefore, we could not obtain an estimate of the DCO+ abundance.
Several mechanisms have been proposed to explain the high values of deuterium fractionation (higher than the deuterium abundance in the Universe, D/H10-5) observed in the interstellar medium. Deuterated isotopologues of methanol and formaldehyde have been detected in hot cores and corinos (see e.g. Parise et al. 2002, 2004; Fuente et al. 2005) where the gas kinetic temperatures is 100 K. In these cases, the fractionation is thought to occur on grain surfaces. The deuterated compounds are released to the gas phase when the ice is evaporated, producing a transient deuterium enhancement in gas phase. In Mon R2, we have detected the deuterated compounds of HCN and C2H. Since these molecules are not mainly formed on grain surfaces, it is more plausible to interpret that the deuteration has occurred in gas phase.
In molecular clouds, deuterium is mainly locked into HD. Efficient transfer of deuterium from this reservoir to other species occurs by means of ion-molecule reactions. In cold clumps, Tk1020 K, deuteration is usually transferred via reactions with H2D+. This mechanism is very efficient, for instance, in pre-stellar cores where molecules are highly depleted (see e.g. Caselli et al. 2003). For slightly higher temperatures of Tk3050 K, the transfer is more efficient via CH2D+ (Roueff et al. 2007, Parise et al. 2009). The high temperatures measured in Mon R2 favor a deuteration mechanism based on CH2D+. Our measurements are in agreement with gas-phase model predictions by Roueff et al. (2007) and Parise et al. (2009) for Tk3050 K and densities a few 106 cm-3. These densities are not unrealistic in this region (Rizzo et al. 2005). One possibility is that C2D comes from the densest part of this PDR. Another possibility is that a fraction of these molecules are formed on grain surfaces or their chemistry is related with some of the evaporated species.
6 Chemical diagnostics
From the discussion in Sect. 5 it seems clear that the emission of some of the detected species comes from the extended PDR around this Hii region. In the following we try to understand the differences between MP1 and MP2 in terms of PDR chemistry. We have run a grid of isochoric models using the updated version (1.4.2) of the PDR Meudon code (Le Petit et al. 2006, Goicoechea et al. 2007) and the parameters listed in Table 7. Our grid of models range in density between 104 cm-3 and 107 cm-3, and in FUV field between 10 and 106 Habing fields. We have run the same grid of models using the standard galactic and the Orion extinction curves but the results are essentially the same for the molecular abundance ratios discussed below. For each model we represent the cumulative column densities summed up to 10 mag. For higher visual extinctions, UV radiation has a negligible effect on the physical conditions and chemistry of the molecular gas. Our goal is to investigate the influence of the incident UV radiation and the density on the studied molecular abundance ratios and explore the possibility of using them as chemical diagnostics. These models are useful to interpret molecular observations, although to reproduce the results on a particular PDR it is required a good knowledge of its geometry.
| Parameter | Value | |
|---|---|---|
| Radiation field intensity (Habing) | 10 to 106 | |
| External Radiation field intensity (Habing) | 1 | |
| Hydrogen nuclei density | 104 to 107 cm-3 | |
| Cloud depth | 10 mag | |
| Extinction | Standard Galactic | |
| 3.1 | ||
| Cosmic ray ionization rate | 510-17 s-1 | |
| dust minimum radius | 310-7 cm | |
| dust maximum radius | 310-5 cm | |
| MRN dust size distribution index | 3.5 | |
| He/H | Helium abundance | 0.1 |
| O/H | Oxygen abundance | 3.210-4 |
| C/H | Carbon abundance | 1.310-4 |
| N/H | Nitrogen abundance | 7.510-5 |
| S/H | Sulphur abundance | 1.910-5 |
| Fe/H | Metal abundance | 1.510-8 |
Some representative cumulative column density ratios have been selected as candidates for chemical diagnostics. Fig. 4 shows these ratios as a function of the incident UV field and the hydrogen nuclei density for the standard interstellar extinction curve. Since we are using a gas phase model, we have avoided those species for which the formation on grain surfaces could be important. This is the case of H2CO, CH3CN and CH3OH. Another important reason to neglect these complex molecules is that they could come from a shielded component of dense gas instead of the PDRs. We are aware, however, that the injection of complex molecules in gas phase by photo-desorption changes the gas chemical composition and could influence the chemistry of more simple species. Consider, for instance, HCO, which is the photodissociation product of H2CO. The abundance of HCO in the PDR would increase if the evaporation of H2CO from the grain surfaces were included improving the agreement with the observations. As discussed below, PAHs and grain destruction are also required to account for the observed abundances of small hydrocarbons.
Our chemical modeling shows that for the range of parameters considered, the CN/HCN ratio is not dependent on the incident UV field but on the density. Therefore, the CN/HCN ratio is a good probe of the existence of PDRs but it is not a good diagnostic to differentiate between PDRs with different UV fields for 100. The value measured in Mon R2, CN/HCN=212, is consistent with a hydrogen nuclei density of 106 cm-3 (n(H2)5105 cm-3) in agreement with our density estimates. As commented in Sect. 5, the HCN and CN abundances in this region are larger than in other prototypical PDRs. We cannot discard that the existence of bipolar outflows could contribute to enhance the abundance of these molecules. However, the measured CN/HCN=212 is more consistent with a PDR origin.
According with our models, the HCO+/HCN ratio must be a good tracer of the UV field and density. Fig. 4b shows that the HCO+/HCN ratio is lower than 1 for a wide range of physical conditions but increases to larger values for high values of G0 (103) and of the density (106 cm-3). Taking into account the extreme values of and in Mon R2, one would expect a higher ratio than that observed. As mentioned above, the detailed geometry of the PDR has to be taken into account when comparing with chemical models. In Mon R2 several gas components lie along the line of sight. The dense PDR is surrounded by a lower density envelope that very likely contributes to the emission of the low J rotational lines of HCO+ and HCN. Although we use the rare isotopologues, H13CO+ and H13CN, to compute this abundance ratio, optical depth effects could still be important.
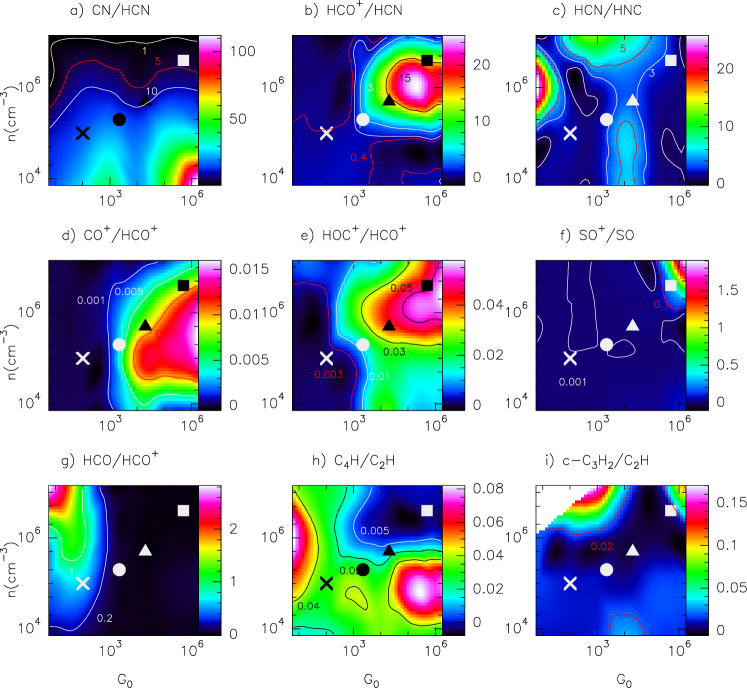
One of the best diagnostic of the UV incident field is the CO+/HCO+ ratio. This ratio is 0.05 only when the UV field is higher than 103. This is consistent with the lack of detection of CO+ in the Horsehead nebula and in the MP2 position of Mon R2. The same dependency on the UV incident field stands also for the HOC+/HCO+ ratio. On the contrary, the formyl radical is abundant only in PDRs with moderate or low UV radiation field (see also Gerin et al. 2009ab). The HCO/HCO+ ratio takes values 0.2 only for UV fields 103. The CO+/HCO+ and HCO/HCO+ abundance ratios are excellent diagnostics to differentiate between low and high UV PDRs. There is a good qualitative agreement between models and observations although they still fail to quantitatively predict these ratios.
Observations show that the SO+/SO ratio is also higher for dense and highly ionized regions and the value towards Mon R2 is well predicted by our gas-phase chemical models. However, observationally this ratio does not follow the same trend that the CO+/HCO+ (see e.g. Fuente et al. 2003). This ratio is influenced by the amount of sulphur in gas phase that could be changed, for instance, by the existence of bipolar outflows and slow shocks. Therefore, we do not propose it as a good diagnostic of PDRs.
Small hydrocarbons can be good tracers of PDRs, and they are specially abundant in low UV PDRs. According with our gas phase calculations, the c-C3H2/C2H ratio presents a fairly uniform value in a wide region of the parameter space. Although our models can explain the value measured in MP2, they fall short to account for the value measured in the Horsehead. In the case of the C4H/C2H ratio, our models fall short to reproduce the observed values in both, MP2 and the Horsehead. Different authors have pointed out that the observed abundances of these hydrocarbons in PDRs requires of another production mechanism than gas-phase reactions, possibly the destruction of PAHs and/or very small grains (VSGs). It is a matter of a lower value of the UV field that prevents too fast destruction of hydrocarbons, but having destruction of PAHs/VSGs at a reasonable rate. Going further requires a full modelling of formation/destruction processes and it is beyond the scope of this paper.
Summarizing, the CO+/HCO+ and HCO/HCO+ ratios are excellent chemical diagnostic of the UV field, while the CN/HCN and HCN/HNC ratios are more dependent on the density. Applying these chemical diagnostics to the three positions observed in Mon R2, we can conclude that the incident UV radiation field in the IF and MP1 are different, being the highest in IF, with a value consistent with that estimated by Rizzo et al. (2003). Towards the MP2, the incident UV field must be lower. The morphology of the 8 m emission (see Fig. 1) suggests that this PDR is the consequence of the border of the molecular cloud being illuminated by IRS 1.
7 Summary and Conclusions
We have carried out a mm survey towards three positions of the PDR that represent different physical and chemical environments: (i) the ionization front (IF); two positions in the molecular cloud, (ii) MP1 and (iii) MP2. Our goal has been to investigate the chemistry of the molecular gas around the UC Hii region and the possible variations due to the different local physical conditions. Our results can be summarized as follows:
-
•
We have detected more than thirty different species (including isotopologues and deuterated compounds) in Mon R2. In particular, we have detected SO+ and C4H towards this region, which are well known tracers of PDRs. In addition to SO+ and C4H, the list of identified species includes typical tracers of PDRs like CN, HCN,HCO, C2H, and c-C3H2 but also other complex molecules more common in warm molecular clouds such as CH3CN, H2CO, HC3N, CH3OH or CH3C2H. The origin of these complex species, dense and well shielded clumps within the molecular cloud or PDR, is still to be investigated. The existence of high velocity molecular outflows in the region could also affect the abundance of some molecules such as HCN and the sulfuretted species.
-
•
Within the PDR component, the comparison of the fractional abundances measured in Mon R2 with those in the prototypical PDRs shows that the positions IF and MP1 present a chemistry similar to that in high-UV PDRs (G0103 Habing fields) while the chemistry in the position MP2 resembles that of the Horsehead ( 103 Habing field). Chemical models predict that [CO+]/[HCO+] and [HCO]/[HCO+] ratios are good diagnostics to differentiate between these two types of PDRs.
-
•
The deuterated species DCN and C2D are detected in our spectral survey. The observed deuteration fractionations, [DCN]/[HCN]0.03 and [C2D]/[C2H]0.05, are among the highest in warm regions.
One important question is whether these stationary models are adequate for PDRs associated with rapidly evolving star forming regions. The time to reach the equilibrium for each species at a given AV depends on the density and the UV radiation (see e.g Bayet et al. 2009). The higher the density and incident UV radiation, the fastest the equilibrium is reached at a given Av. For the physical conditions in Mon R2, simple species are expected to have reached the equilibrium in 105 yr which explains the success of our chemical diagnostics. However, we cannot exclude small deviations from equilibrium especially in those regions at high extinction and with low incident UV field. In following works, we will investigate the role of grain surface chemistry and time dependent effects on the chemistry of the molecular gas in Mon R2.
Acknowledgements.
We are grateful to the IRAM staff for their great help during the observations and data reduction. This paper was partially supported within the programme CONSOLIDER INGENIO 2010, under grant ”Molecular Astrophysics: The Herschel and ALMA Era.- ASTROMOL” (Ref.: CSD2009-00038). J.C. and J.R.G. thank the Spanish MICINN for funding support through grants AYA2006-14876 and AYA2009-07304. J.R.G. is supported by a Ramón y Cajal research contract. Part of this work was supported by the Deutsche Forschungsgemeinschaft, project number Os 177/1-1.References
- Avery & Green (1989) Avery, L. W., & Green, S. 1989, ApJ, 337, 306
- Bachiller & Perez Gutierrez (1997) Bachiller, R., & Pérez Gutiérrez, M. 1997, ApJ, 487, L93
- Bayet et al. (2009) Bayet, E., Viti, S., Williams, D. A., Rawlings, J. M. C., & Bell, T. 2009, ApJ, 696, 1466
- Berné et al. (2009) Berné, O., Fuente, A., Goicoechea, J. R., Pilleri, P., González-García, M., & Joblin, C. 2009, ApJL, 706, L160
- Caselli et al. (2003) Caselli, P., van der Tak, F. F. S., Ceccarelli, C., & Bacmann, A. 2003, A&A, 403, L37
- Cernicharo et al. (2006) Cernicharo, J., Goicoechea, J. R., Pardo, J. R., & Asensio-Ramos, A. 2006, ApJ, 642, 940
- Cernicharo et al. (2011) Cernicharo, J., Spielfiedel, A., Balança, C., et al. 2011, A&A, 531, A103
- Choi et al. (2000) Choi, M., Evans, N. J., II, Tafalla, M., & Bachiller, R. 2000, ApJ, 538, 738
- Churchwell (2002) Churchwell, E. 2002, ARA&A, 40, 27
- Daniel et al. (2005) Daniel, F., Dubernet, M.-L., Meuwly, M., Cernicharo, J., & Pagani, L. 2005, MNRAS, 363, 1083
- Dayou & Balança (2006) Dayou, F., & Balança, C. 2006, A&A, 459, 297
- Flower (1999) Flower, D. R. 1999, MNRAS, 305, 651
- Fuente et al. (1993) Fuente, A., Martín-Pintado, J., Cernicharo, J., & Bachiller, R. 1993, A&A, 276, 473
- Fuente et al. (1996) Fuente, A., Rodríguez-Franco, A., & Martín-Pintado, J. 1996, A&A, 312, 599
- Fuente et al. (2003) Fuente, A., Rodrtíguez-Franco, A., García-Burillo, S., Martín-Pintado, J., & Black, J. H. 2003, A&A, 406, 899
- Fuente et al. (2005) Fuente, A., Neri, R., & Caselli, P. 2005, A&A, 444, 481
- Fuente et al. (2010) Fuente, A., et al. 2010, A&A, 521, L23
- García-Burillo et al. (2002) García-Burillo, S., Martín-Pintado, J., Fuente, A., Usero, A., & Neri, R. 2002, ApJ, 575, L55
- Giannakopoulou et al. (1997) Giannakopoulou, J., Mitchell, G. F., Hasegawa, T. I., Matthews, H. E., & Maillard, J.-P. 1997, ApJ, 487, 346
- Gerin et al. (2009a) Gerin, M., Goicoechea, J. R., Pety, J., & Hily-Blant, P. 2009a, A&A, 494, 977
- Gerin et al. (2009b) Gerin, M., Pety, J., & Goicoechea, J. R. 2009b, Submillimeter Astrophysics and Technology: a Symposium Honoring Thomas G. Phillips, 417, 165
- Gerin et al. (2009c) Gerin, M., Marcelino, N., Biver, N., et al. 2009c, A&A, 498, L9
- Goicoechea et al. (2006) Goicoechea, J. R., Pety, J., Gerin, M., Teyssier, D., Roueff, E., Hily-Blant, P., & Baek, S. 2006, A&A, 456, 565
- Goicoechea & Le Bourlot (2007) Goicoechea, J. R., & Le Bourlot, J. 2007, A&A, 467, 1
- Goicoechea et al. (2009) Goicoechea, J. R., Pety, J., Gerin, M., Hily-Blant, P., & Le Bourlot, J. 2009, A&A, 498, 771
- Green (1991) Green, S. 1991, ApJS, 76, 979
- Guzmán et al. (2011) Guzmán, V., Pety, J., Goicoechea, J. R., Gerin, M., Roueff, E., 2011, in press
- Henning et al. (1992) Henning, T., Chini, R., & Pfau, W. 1992, A&A, 263, 285
- Herbst& Racine (1976) Herbst, W., & Racine, R. 1976, AJ, 81, 840
- Le Petit et al. (2006) Le Petit, F., Nehmé, C., Le Bourlot, J., & Roueff, E. 2006, ApJS, 164, 506
- Lique et al. (2006) Lique, F., Spielfiedel, A., Dhont, G., & Feautrier, N. 2006, A&A, 458, 331
- Lique & Spielfiedel (2007) Lique, F., & Spielfiedel, A. 2007, A&A, 462, 1179
- Lucas & Liszt (2002) Lucas, R., & Liszt, H. S. 2002, A&A, 384, 1054
- Monteiro (1984) Monteiro, T. 1984, MNRAS, 210, 1
- Massi et al. (1985) Massi, M., Felli, M., & Simon, M. 1985, A&A, 152, 387
- Meyers-Rice & Lada (1991) Meyers-Rice, B. A., & Lada, C. J. 1991, ApJ, 368, 445
- Ohishi et al. (1994) Ohishi, M., McGonagle, D., Irvine, W. M., Yamamoto, S., & Saito, S. 1994, apJL, 427, L51
- Parise et al. (2002) Parise, B., Ceccarelli, C., Tielens, A. G. G. M., et al. 2002, A&A, 393, L49
- Parise et al. (2004) Parise, B., Castets, A., Herbst, E., et al. 2004, A&A, 416, 159
- Parise et al. (2009) Parise, B., Leurini, S., Schilke, P., Roueff, E., Thorwirth, S., & Lis, D. C. 2009, A&A, 508, 737
- Pety et al. (2005) Pety, J., Teyssier, D., Fossé, D., et al. 2005, A&A, 435, 885
- Pety et al. (2007) Pety, J., Goicoechea, J. R., Hily-Blant, P., Gerin, M., & Teyssier, D. 2007, A&A, 464, L41
- Pilleri et al. (2012a) Pilleri, P., Fuente, A., Cernicharo, J.,Ossenkopf, V., Berné, O., et al. 2012, submitted to A&A
- Pilleri et al. (2012b) Pilleri, P., et al. 2012, in preparation
- Rizzo et al. (2003) Rizzo, J. R., Fuente, A., Rodríguez-Franco, A., & García-Burillo, S. 2003, ApJL, 597, L153
- Rizzo et al. (2005) Rizzo, J. R., Fuente, A., & García-Burillo, S. 2005, ApJ, 634, 1133
- Roueff et al. (2007) Roueff, E., Parise, B., & Herbst, E. 2007, A&A, 464, 245
- Sarrasin et al. (2010) Sarrasin, E., Abdallah, D. B., Wernli, M., et al. 2010, MNRAS, 404, 518
- Savage et al. (2002) Savage, C., Apponi, A. J., Ziurys, L. M., & Wyckoff, S. 2002, ApJ, 578, 211
- Schilke et al. (2001) Schilke, P., Pineau des Forêts, G., Walmsley, C. M., & Martín-Pintado, J. 2001, A&A, 372, 291
- Schenewerk et al. (1988) Schenewerk, M. S., Jewell, P. R., Snyder, L. E., Hollis, J. M., & Ziurys, L. M. 1988, ApJ, 328, 785
- Schloerb et al. (1983) Schloerb, F. P., Irvine, W. M., Friberg, P., Hjalmarson, A., & Hoglund, B. 1983, ApJ, 264, 161
- Snyder et al. (1976) Snyder, L. E., Hollis, J. M., Lovas, F. J., & Ulich, B. L. 1976, ApJ, 209, 67
- Sutton et al. (1995) Sutton, E. C., Peng, R., Danchi, W. C., Jaminet, P. A., Sandell, G., & Russell, A. P. G. 1995, ApJS, 97, 455
- Tafalla et al. (1994) Tafalla, M., Bachiller, R., & Wright, M. C. H. 1994, ApJ, 432, L127
- Tafalla et al. (1997) Tafalla, M., Bachiller, R., Wright, M. C. H., & Welch, W. J. 1997, ApJ, 474, 329
- Teyssier et al. (2004) Teyssier, D., Fossé, D., Gerin, M., Pety, J., Abergel, A., & Roueff, E. 2004, A&A, 417, 135
- Turner (1994) Turner, B. E. 1994, ApJ, 430, 727
- van der Wiel et al. (2010) van der Wiel, M. H. D., van der Tak, F. F. S., Ossenkopf, V., Spaans, M., Roberts, H., Fuller, G. A., & Plume, R. 2010, A&A, 510, 1
- Wernli et al. (2007) Wernli, M., Wiesenfeld, L., Faure, A., & Valiron, P. 2007, A&A, 464, 1147 bibitem[Wood & Churchwell(1989)]1989ApJS…69..831W Wood, D. O. S., & Churchwell, E. 1989, ApJS, 69, 831
- Yang et al. (2010) Yang, B., Stancil, P. C., Balakrishnan, N., & Forrey, R. C. 2010, ApJ, 718, 1062
Appendix A Identified lines
| Frequency | Transition | Intensity (IF) | Intensity (MP1) | Intensity (MP2) |
|---|---|---|---|---|
| (MHz) | (Kkm s-1) | (Kkm s-1) | (Kkm s-1) | |
| 83802 | H(66) | 1.23(0.11) | 0.24(0.06) | |
| 84107 | C(40)+He(40) in the image band | 0.66(0.14) | ||
| 84521 | CH3OH 5-1,540,4 | 0.48(0.08) | 0.35(0.04) | 0.62(0.04) |
| 84914 | H(60) | 2.26(0.12) | 0.70(0.04) | |
| 85197 | CS 21 in the image band | 0.39(0.19) | 0.39(0.09) | |
| 85339 | c-C3H2 21,210,1 | 1.18(0.20)a | 1.50(0.07)a | 2.09(0.09)a |
| 85348 | HCS+ 21 | 0.76(0.09) | 0.32(0.02) | 0.33(0.09) |
| 85457 | CH3C2H 5k4k k=0,1 | 0.41(0.07) | 0.47(0.16) | 0.53(0.07) |
| 85634 | C4H 98 J=19/217/2 | 0.29(0.08) | ||
| 85673 | C4H 98 J=17/215/2 | 0.53(0.15) | ||
| 85688 | H(42) | 15.97(0.13) | 4.08(0.13) | 0.89(0.16) |
| 85731 | C(42) | 0.23(0.06) | ||
| 85925 | NH2D 11,1-10,1t | 0.19(0.04) | ||
| 86055 | HC15N 10 | 0.29(0.07) | 0.52(0.14) | 0.37(0.06) |
| 86094 | SO 2211 | 0.38(0.05) | 0.31(0.12) | 0.54(0.01) |
| 86339 | H13CN 10 | 1.78(0.08) | 2.11(0.03) | 1.64(0.03) |
| 86488 | H(70) | 0.95(0.12) | ||
| 86671 | HCO 10,100,0 J=3/21/2 F=21 | 0.22(0.05) | 0.54(0.05) | |
| 86690 | H(74) | 0.99(0.17) | ||
| 86708 | HCO 10,100,0 J=3/21/2 F=10 | 0.15(0.03) | 0.37(0.05) | |
| 86754 | H13CO+ 10 | 0.55(0.09) | 1.43(0.02) | 1.14(0.09) |
| 86777 | HCO 10,100,0 J=1/21/2 F=11 | 0.12(0.03) | 0.31(0.04) | |
| 86847 | SiO 21 | 0.32(0.04) | 0.35(0.01) | |
| 87091 | HN13C 10 | 0.31(0.06) | 0.57(0.04) | 0.35(0.04) |
| 87284 | C2H N=10 J=3/21/2 F=11 | 0.42(0.08) | 0.68(0.02) | 0.69(0.04) |
| 87317 | C2H N=10 J=3/21/2 F=21 | 4.37(0.38) | 5.47(0.49) | 5.77(0.46) |
| 87329 | C2H N=10 J=3/21/2 F=10 | 2.12(0.11) | 2.97(0.06) | 3.00(0.36) |
| 87402 | C2H N=10 J=1/21/2 F=11 | 2.17(0.14) | 3.24(0.06) | 3.38(0.13) |
| 87407 | C2H N=10 J=1/21/2 F=01 | 0.84(0.15) | 1.15(0.05) | 1.10(0.06) |
| 87446 | C2H N=10 J=1/21/2 F=10 | 0.77(0.06) | 0.68(0.05) | |
| 87615 | H(65) | 1.86(0.08) | 0.41(0.09) | |
| 87706 | Unidentified (Fimage=110433 MHz) | 1.47(0.30) | ||
| 87938 | 13CO 10 in the image band | 0.96(0.10) | 1.05(0.05) | 0.84(0.05) |
| 88358 | C18O 10 in the image band | 0.36(0.03) | 0.27(0.04) | |
| 88406 | H(52) | 6.77(0.08) | 1.01(0.07) | 0.47(0.06) |
| 88578 | Unidentified (Fimage=109560 MHz) | 0.47(0.06) | ||
| 88632 | HCN 10 F=1-1, F=2-1 and F=0-1 | 8.47(0.06) | 20.58(0.05) | 23.24(0.04) |
| 88866 | H15NC 10 t | 0.14(0.04) | ||
| 88942 | Unidentified (Fimage=109196 MHz) | 0.20(0.04) | ||
| 89112 | Unidentified (Fimage=109027 MHz) | 0.24(0.05) | ||
| 89165 | Unidentified (Fimage=108974.5 MHz) | 0.66(0.02) | ||
| 89189 | HCO+ 10 | 11.59(0.02)a | 13.90(0.22) | 17.67(0.11)a |
| 89199 | H(59) | 2.50(0.21) | ||
| 90174 | H(69) and H(73) | 1.63(0.12) | ||
| 90664 | HNC 10 | 3.19(0.05) | 10.58(0.14) | 8.33(0.06) |
| 90979 | HC3N 109 | 0.90(0.06) | 2.41(0.08) | 1.41(0.03) |
| 91406 | H(39) in the image band | 0.61(0.13) | ||
| 91663 | H(64) | 1.86(0.11) | 0.52(0.08) | |
| 91942 | CH313CN 5040 | 0.59(0.16) | ||
| 91971 | CH3CN 5343 | 0.64(0.14) | 0.11(0.05) | 0.11(0.03) |
| 91980 | CH3CN 5242 | 0.12(0.03) | ||
| 91987 | CH3CN 5k4k k=0,1 | 0.52(0.05) | 0.41(0.04) |
a The profile shows self-absorption; t Tentative detection; b obtained by degrading the HERA maps to the angular resolution of the 3mm lines.
| Frequency | Transition | Intensity (IF) | Intensity (MP1) | Intensity (MP2) |
|---|---|---|---|---|
| (MHz) | (Kkm s-1) | (Kkm s-1) | (Kkm s-1) | |
| 92034 | H(41) | 20.45(0.17) | 4.01(0.18) | 1.39(0.05) |
| 92080 | C(41) | 0.38(0.08)t | ||
| 92436 | Unidentified (Fimage=105702 MHz) | 0.39(0.05) | ||
| 92494 | 13CS 21 | 0.30(0.05) | 0.42(0.06) | 0.37(0.03) |
| 93174 | N2H+ 10 F=11 , 12 and 10 | 1.53(0.06) | 8.66(0.09) | 2.47(0.04) |
| 93607 | H(51) | 6.04(0.10) | 1.06(0.08) | 0.35(0.08) |
| 93776 | H(58) | 2.77(0.17) | 0.56(0.09) | |
| 93827 | H(72) | 0.89(0.09) | ||
| 93870 | C2S 7867 | 0.14(0.04) | 0.16(0.02) | |
| 94073 | H(68) | 1.03(0.07) | ||
| 103252 | Unidentified (Fimage=94889 MHz) | 0.52(0.04) | ||
| 103266 | C4H v=1 21/219/2 t | 0.47(0.05) | ||
| 103915 | H(56) | 3.02(0.07) | 0.46(0.07) | |
| 104029 | SO2 31,320,2t | 0.16(0.06) | 0.11(0.03) | |
| 104062 | Unidentifed (Fimage=93900 MHz) | 0.16(0.03) | ||
| 104239 | SO2 101,9100,10t | 0.10(0.03) | ||
| 104533 | H(51) in the image band | 0.44(0.03) | ||
| 104617 | H2CS 31,221,1 | 0.19(0.03) | 0.38(0.03) | 0.21(0.02) |
| 104667 | C4H 1110 J=23/221/2 | 0.19(0.03) | 0.30(0.06) | |
| 104705 | C4H 1110 J=21/219/2 | 0.27(0.05) | 0.30(0.04) | |
| 104966 | N2H+ 10 in the image band | 0.52(0.03) | ||
| 105302 | H(49) | 6.22(0.10) | 0.66(0.06) | 0.39(0.05) |
| 105410 | H(61) | 1.70(0.07) | ||
| 105516 | Unidentified (Fimage=92625 MHz) | 0.36(0.10) | ||
| 106079 | H(69) | 0.71(0.09) | ||
| 106104 | H(41) in the image band | 0.45(0.10) | ||
| 106348 | C2S N=87 J=98 | 0.13(0.02) | ||
| 106737 | H(39) | 18.80(0.11) | 2.33(0.07) | 0.57(0.06) |
| 107014 | CH3OH 31,340,4 | 0.14(0.06) | 0.55(0.07) | |
| 107206 | H(65) | 1.23(0.12) | ||
| 107254 | Unidentified (Fimage=90887 MHz) | 0.59(0.18) | ||
| 107424 | Unidentified (Fimage=90720 MHz) | 0.51(0.03) | ||
| 107476 | HNC 10 in the image band | 0.25(0.07) | 0.46(0.03) | 0.48(0.04) |
| 108427 | 13CN N=10 J=1/21/2 | 0.27(0.01) | 0.16(0.01) | |
| 108780 | 13CN N=10 J=3/21/2 | 0.24(0.01) | 0.39(0.03) | |
| 108894 | CH3OH 00,01-1,1 | 0.20(0.09) | 0.19(0.03) | |
| 108950 | HCO+ 10 in the image band | 0.21(0.21) | 0.47(0.13) | 0.72(0.05) |
| 109174 | HC3N 1211 | 0.70(0.04) | 2.41(0.04) | 1.45(0.04) |
| 109206 | Unidentified (Fimage=88935 MHz) | 0.13(0.03) | ||
| 109252 | SO 2312 | 0.21(0.18) | 0.34(0.01) | 0.59(0.01) |
| 109536 | H(55) | 3.25(0.10) | ||
| 109782 | C18O 10 | 3.47(0.06) | 4.63(0.05) | 3.75(0.06) |
| 109906 | HNCO 54 | 0.13(0.04) | ||
| 109998 | Unidentified (Fimage=88142 MHz) | 0.43(0.05) | ||
| 110025 | C15N N=10 J=3/21/2 F=21 and 10 | 0.13(0.03) | 0.25(0.04) | |
| 110119 | Unidentified (Fimage=88022 MHz) | 0.18(0.04) | ||
| 110201 | 13CO 10 | 42.31(0.03) | 49.18(1.07) | 41.61(0.15) |
| 110364 | CH3CN 6353 | 0.21(0.06) | ||
| 110375 | CH3CN 6252 | 0.12(0.04) | 0.13(0.04) | |
| 110383 | CH3CN 6k5k k=0,1 | 1.13(0.13) | 0.59(0.04) | 0.34(0.05) |
| 110601 | H(60) | 1.66(0.13) | ||
| 205081 | CH3C2H 120110 | 0.49(0.08) | 0.71(0.10) | |
| 205292 | C18O 21 in the image band | 1.01(0.08) | ||
| 205986 | H2CS 60,650,5 | 0.26(0.06) |
a The profile shows self-absorption; t Tentative detection; b obtained by degrading the HERA maps to the angular resolution of the 3mm lines.
| Frequency | Transition | Intensity (IF) | Intensity (MP1) | Intensity (MP2) |
|---|---|---|---|---|
| (MHz) | (Kkm s-1) | (Kkm s-1) | (Kkm s-1) | |
| 206176 | SO 4534 | 1.41(0.09) | 1.30(0.07) | 1.60(0.09) |
| 206676 | Unidentified (Fimage=218175 MHz) | 1.31(0.12) | 0.79(0.06) | 0.65(0.05) |
| 206907 | Unidentified (Fimage=217944 MHz) | 0.49(0.11) | ||
| 207836 | Unidentified (Fimage=217015 MHz) | 0.40(0.08) | ||
| 208700 | SO2 32,221,1 | 0.35(0.07) | ||
| 208767 | Unidentified (Fimage=221286 MHz) | 0.29(0.07) | ||
| 209097 | Unidentified Fimage=220956 MHz) | 0.64(0.06) | 0.76(0.05) | 0.86(0.12) |
| 209201 | H2CS 61,551,4 | 0.39(0.04) | 0.53(0.08) | 0.70(0.16) |
| 209230 | HC3N 2322 | 0.22(0.10) | 0.28(0.11) | 0.59(0.15) |
| 209277 | Unidentified (Fimage=220777 MHz) | 0.37(0.08) | 0.32(0.08) | |
| 209591 | Unidentified (Fimage=220462 MHz) | 1.84(0.54) | ||
| 209655 | 13CO 21 in the image band | 1.97(0.10) | 2.13(0.07) | 2.18(0.11) |
| 209894 | H(44) | 2.37(0.16) | ||
| 209999 | C(44) | 0.51(0.11) | ||
| 210495 | C18O 21 in the image band | 1.18(0.07) | 0.32(0.06) | 1.28(0.09) |
| 210502 | H(31) | 15.18(0.20) | ||
| 216373 | CCD N=32 J=7/25/2 | 0.31(0.05) | 0.49(0.10) | |
| 216428 | CCD N=32 J=5/23/2 | 0.31(0.05) | 0.40(0.07) | |
| 216711 | H2S 22,021,1 | 0.21(0.05) | ||
| 217105 | SiO 54 | 0.22(0.05) | 0.23(0.01) | |
| 217239 | DCN J=32 | 1.23(0.11) | 2.94(0.06) | 1.32(0.06) |
| 217467 | 13CN N=21 J=5/23/2 F=43, 32 and 21 | 0.12(0.01) | 0.38(0.03) | |
| 217822 | c-C3H2 61,650,5 and 60,651,5 | 0.80(0.20) | 1.20(0.20) | 1.86(0.20) |
| 217835 | CO 21 in the image band | 1.80(0.16) | 1.95(0.45) | 3.04(0.40) |
| 217940 | c-C3H2 51,442,3 | 0.52(0.05) | 1.13(0.05) | |
| 218160 | c-C3H2 52,441,3 | 0.33(0.15) | 0.40(0.03) | |
| 218182 | Unidentified (Fimage=230192 MHz) | 0.50(0.09) | 0.58(0.11) | |
| 218222 | H2CO 30,320,2 | 3.78(0.13) | 7.71(0.10) | 6.24(0.12) |
| 218325 | HC3N 2423 | 0.17(0.06) | 0.27(0.04) | 0.32(0.03) |
| 218440 | CH3OH 42,231,2 | 0.63(0.13) | 0.74(0.04) | 0.35(0.06) |
| 218476 | H2CO 32,222,1 | 1.02(0.12) | 1.77(0.09) | 1.42(0.07) |
| 218667 | Unidentified (Fimage=229707 MHz) | 0.90(0.11) | ||
| 218760 | H2CO 32,122,0 | 0.87(0.08) | 1.75(0.05) | 1.41(0.06) |
| 219560 | C18O 21 | 10.68(0.17) | 14.0(0.07) | 12.74(0.07) |
| 219597 | Unidentified (Fimage=228776 MHz) | 1.90(0.13) | ||
| 219852 | H2CN 30,320,2 t | 1.03(0.29) | 0.57(0.05) | 0.48(0.06) |
| 219911 | H213CO 31,2-21,1 t | 1.06(0.15) | ||
| 219949 | SO 6554 | 1.45(0.07) | 2.07(0.01) | 1.83(0-03) |
| 259012 | H13CN 32 b | 1.65(0.21) | 2.50(0.25) | 1.10(0.06) |
| 260255 | H13CO+ 32 b | 2.00(0.04) | 2.12(0.04) | 1.52(0.03) |
| 262004 | C2H N=32 J=7/25/2 b | 14.59(0.60) | 15.60(0.60) | 12.89(0.47) |
a The profile shows self-absorption; t Tentative detection; b obtained by degrading the HERA maps to the angular resolution of the 3mm lines.
| IF (0,0) | |||||
|---|---|---|---|---|---|
| Freq(MHz) | Line | I(K km s-1) | vlsr(km s-1) | v(km s-1) | TMB(K) |
| 83801.829 | H(66) | 1.23 (0.11) | 13.3(1.3) | 27.8 (2.9) | 0.04 |
| 84914.394 | H(60) | 2.26 (0.12) | 11.8 (0.8) | 30.7 (1.8) | 0.07 |
| 85688.390 | H(42) | 15.97 (0.13) | 12.4 (0.1) | 30.9 (0.28) | 0.48 |
| 85731.144 | C(42) | 0.23 ( 0.06) | 12.2 (1.6) | 9.0 ( 2.9) | 0.02 |
| 86488.417 | H(70) | 0.95 (0.12) | 14.8 (2.6) | 36.9 (5.5) | 0.02 |
| 86689.621 | H(74) | 0.99 (0.17) | 8.2 (2.7) | 32.5 (8.0) | 0.03 |
| 87614.996 | H(65) | 1.86 (0.08) | 9.7 (0.7) | 30.3 (1.5) | 0.06 |
| 88405.687 | H(52) | 6.77 (0.08) | 9.3 (0.2) | 34.2 (0.5) | 0.19 |
| 89198.545 | H(59) | 2.50 (0.21) | 7.2 (1.1)a | 26.8 (2.5) | 0.09 |
| 90164.065 | H(73)b | 0.63(0.10) | 9.8(2.3) | 31.0(7.0) | 0.02 |
| 90174.339 | H(69)b | 0.98 (0.12) | 8.4 (1.3) | 32.0 (3.0) | 0.03 |
| 91663.133 | H(64) | 1.86 (0.11) | 9.0 (1.0) | 33.2 (2.0) | 0.05 |
| 92034.434 | H(41) | 20.45 (0.17) | 9.6 (0.2) | 30.8 (0.3) | 0.62 |
| 92080.355 | C(41)t | 0.38 (0.08) | 7.0 (1.2) | 11.7(3.1) | 0.03 |
| 93607.316 | H(51) | 6.04 (0.10) | 9.8 (0.3) | 30.9 (0.6) | 0.18 |
| 93775.871 | H(58) | 2.77 (0.17) | 8.7 (0.9) | 30.5 (2.1) | 0.08 |
| 93826.790 | H(72) | 0.89 (0.09) | 10.7 (1.5) | 29.6 (3.8) | 0.03 |
| 94072.811 | H(68) | 1.03 (0.07) | 11.4 (0.9) | 26.8 (2.1) | 0.04 |
| 103914.838 | H(56) | 3.02 (0.07) | 12.6 (0.4) | 33.0 (0.9) | 0.09 |
| 105301.857 | H(49) | 6.22 (0.10) | 12.4 (0.3) | 31.5 (0.6) | 0.19 |
| 105410.216 | H(61) | 1.70 (0.07) | 12.7 (0.7) | 29.5 (1.4) | 0.05 |
| 106079.529 | H(69) | 0.71 (0.09)) | 14.0 (1.9) | 28.8 (4.1) | 0.02 |
| 106737.357 | H(39) | 18.80 (0.11) | 12.53 (0.09) | 31.0 (0.2) | 0.57 |
| 107206.108 | H(65) | 1.23 (0.12) | 10.31 (1.8) | 35.5 (3.9) | 0.03 |
| 109536.001 | H(55) | 3.25 (0.10) | 12.5 (0.5) | 33.5 (1.2) | 0.09 |
| 110600.675 | H(60) | 1.66 (0.13) | 10.4 (1.3) | 34.0 (3.2) | 0.04 |
| 209894.050 | H(44) | 2.37 (0.16) | 13.3 (1.1) | 31.6 (2.6) | 0.07 |
| 210501.771 | H(31)c | 15.18 (0.20) | 13.7 (0.3) | 33.0 (0.4) | 0.43 |
| MP1 (15,-15) | |||||
| Freq(MHz) | Line | I(K km s-1) | vlsr(km s-1) | v(km s-1) | TMB(K) |
| 83801.829 | H(66) | 0.24 (0.06) | 16.1(2.4) | 17.0 (4.9) | 0.01 |
| 84914.394 | H(60) | 0.70 (0.04) | 15.8 (0.9) | 31.5 (1.8) | 0.02 |
| 85688.390 | H(42) | 4.08 (0.13) | 15.3 (0.5) | 29.7 (1.2) | 0.13 |
| 85731.144 | C(42) | 0.22 (0.03) | 8.7 (0.7) | 12.0 (1.7) | 0.02 |
| 87614.996 | H(65) | 0.41 (0.09) | 10.0 (4.2) | 35.7 (8.5) | 0.01 |
| 88405.687 | H(52) | 1.01 (0.07) | 14.2 (0.9) | 27.2 (2.2) | 0.03 |
| 91663.133 | H(64) | 0.52 (0.08) | 18.0 (2.3) | 26.7 (4.5) | 0.02 |
| 92034.434 | H(41) | 4.01 (0.18) | 12.8 (0.7) | 33.9 (1.8) | 0.11 |
| 93607.316 | H(51) | 1.06 (0.08) | 14.5 (1.3) | 34.2 (3.0) | 0.03 |
| 93775.871 | H(58) | 0.56 (0.09) | 15.6 (2.9) | 33.8 (5.8) | 0.016 |
| 103914.838 | H(56) | 0.46 (0.07) | 18.3 (2.7) | 40.1 (7.2) | 0.01 |
| 105301.857 | H(49) | 0.66 (0.06) | 17.1 (1.3) | 27.3 (3.3) | 0.02 |
| 106737.357 | H(39) | 2.33 (0.07) | 16.4 (0.5) | 31.5 (1.1) | 0.07 |
| MP2 (0,40) | |||||
| Freq(MHz) | Line | I(K km s-1) | vlsr(km s-1) | v(km s-1) | TMB(K) |
| 85688.390 | H(42) | 0.89 (0.16) | 11.0 (2.1) | 23.2 (4.8) | 0.04 |
| 88405.687 | H(52) | 0.47 (0.06) | 9.3 (2.2) | 35.0 (5.3) | 0.01 |
| 92034.434 | H(41) | 1.39 (0.05) | 6.7 (0.6) | 33.4 (1.4) | 0.04 |
| 93607.316 | H(51) | 0.35 (0.08) | 6.6 (2.7) | 29.6 (10.7) | 0.01 |
| 105301.857 | H(49) | 0.39 (0.05) | 9.4 (2.4) | 33.4 (4.4) | 0.01 |
| 106737.357 | H(39) | 0.57 (0.06) | 8.0 (1.5) | 26.6 (3.2) | 0.02 |
| 209998.777 | C(44) | 0.51 (0.11) | 19.1 (0.9) | 8.2 (1.8) | 0.06 |
Note: a Overlapped with the HCO+ J=10 line and self-absorbed; b these two recombination lines are overlapped and the fit of the two each lines is uncertain; t Doubtful detection; c This recombination line is contaminated by the emission of C18O J=21 from the image band.
![[Uncaptioned image]](/html/1203.6466/assets/x17.png)
![[Uncaptioned image]](/html/1203.6466/assets/x18.png)
![[Uncaptioned image]](/html/1203.6466/assets/x19.png)
![[Uncaptioned image]](/html/1203.6466/assets/x20.png)
![[Uncaptioned image]](/html/1203.6466/assets/x21.png)
![[Uncaptioned image]](/html/1203.6466/assets/x22.png)

![[Uncaptioned image]](/html/1203.6466/assets/x24.png)
![[Uncaptioned image]](/html/1203.6466/assets/x25.png)
![[Uncaptioned image]](/html/1203.6466/assets/x26.png)
![[Uncaptioned image]](/html/1203.6466/assets/x27.png)
![[Uncaptioned image]](/html/1203.6466/assets/x28.png)
![[Uncaptioned image]](/html/1203.6466/assets/x29.png)

![[Uncaptioned image]](/html/1203.6466/assets/x31.png)
![[Uncaptioned image]](/html/1203.6466/assets/x32.png)
![[Uncaptioned image]](/html/1203.6466/assets/x33.png)
![[Uncaptioned image]](/html/1203.6466/assets/x34.png)
![[Uncaptioned image]](/html/1203.6466/assets/x35.png)
![[Uncaptioned image]](/html/1203.6466/assets/x36.png)

Appendix B Rotational Diagrams
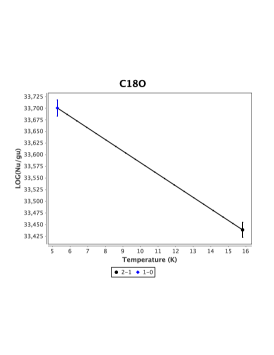
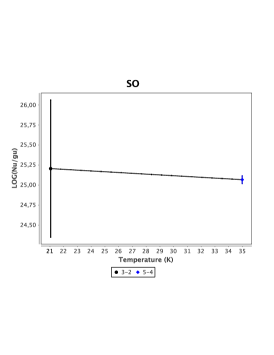
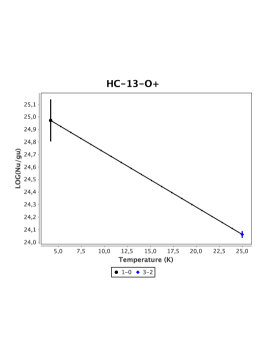
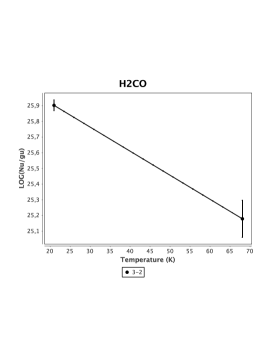
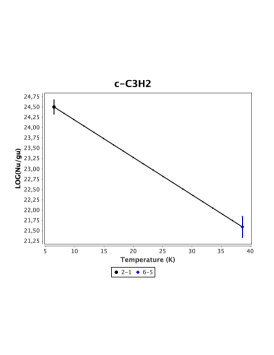
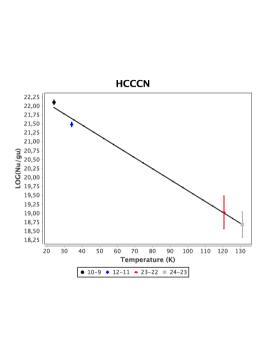
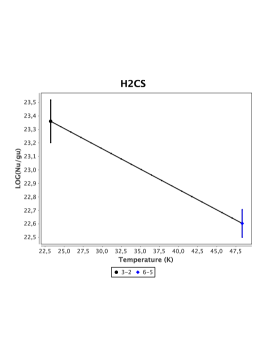
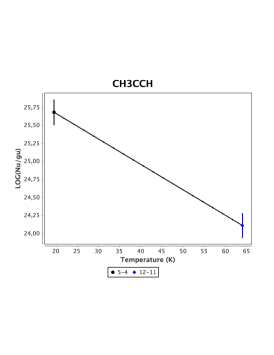
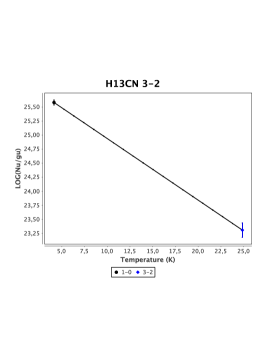
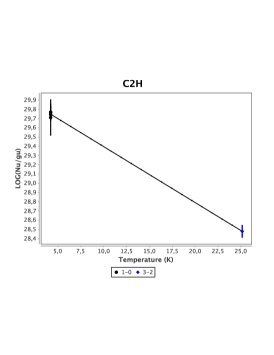
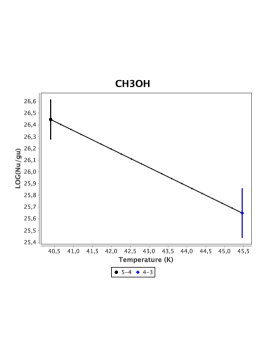
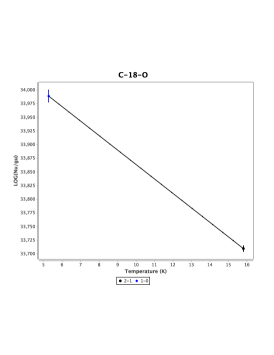
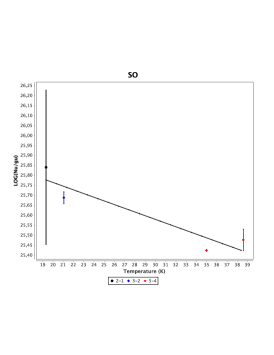
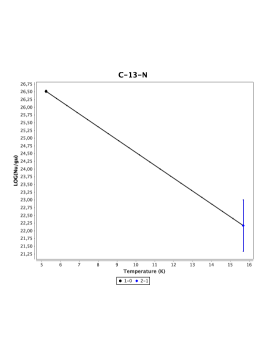
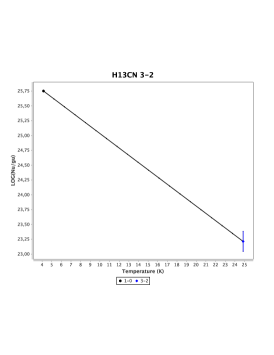
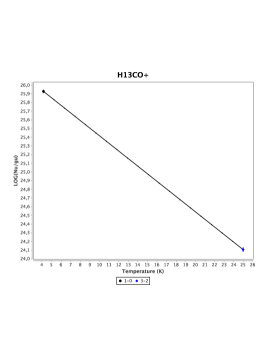
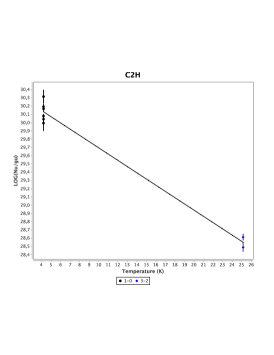
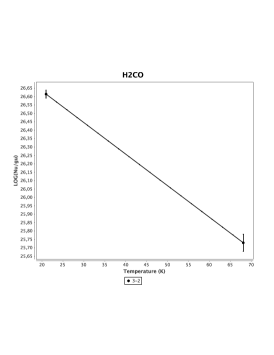
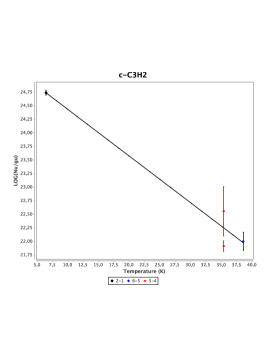
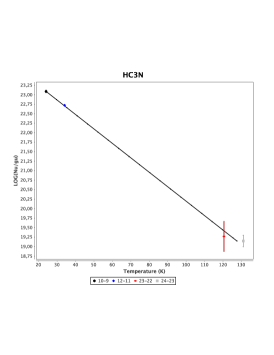
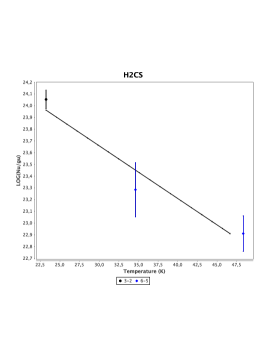
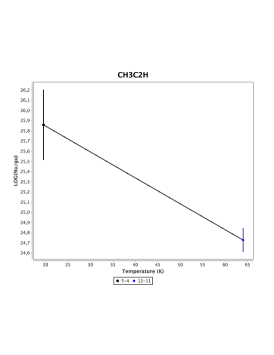
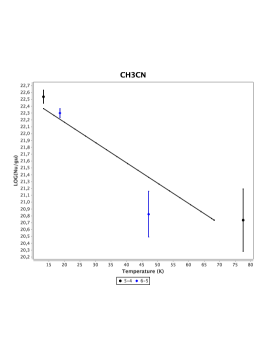
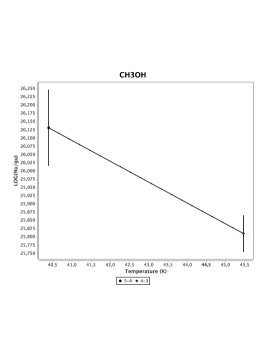

![[Uncaptioned image]](/html/1203.6466/assets/x63.png)
![[Uncaptioned image]](/html/1203.6466/assets/x64.png)
![[Uncaptioned image]](/html/1203.6466/assets/x65.png)
![[Uncaptioned image]](/html/1203.6466/assets/x66.png)
![[Uncaptioned image]](/html/1203.6466/assets/x67.png)
![[Uncaptioned image]](/html/1203.6466/assets/x68.png)
![[Uncaptioned image]](/html/1203.6466/assets/x69.png)
![[Uncaptioned image]](/html/1203.6466/assets/x70.png)
![[Uncaptioned image]](/html/1203.6466/assets/x71.png)
![[Uncaptioned image]](/html/1203.6466/assets/x72.png)
![[Uncaptioned image]](/html/1203.6466/assets/x73.png)
![[Uncaptioned image]](/html/1203.6466/assets/x74.png)
![[Uncaptioned image]](/html/1203.6466/assets/x75.png)
![[Uncaptioned image]](/html/1203.6466/assets/x76.png)
![[Uncaptioned image]](/html/1203.6466/assets/x77.png)