Observations of the 18-cm OH lines of comet 103P/Hartley 2 at Nançay in support to the EPOXI and Herschel missions
Abstract
The 18-cm radio lines of the OH radical were observed in comet 103P/Hartley 2 with the Nançay radio telescope in support to its flyby by the EPOXI mission and to observations with the Herschel Space Observatory. The OH lines were detected from 24 September to 15 December 2010. These observations are used to estimate the gas expansion velocity within the coma to km s-1 in October 2010. The water production increased steeply but progressively before perihelion, and reached s-1 just before the EPOXI flyby
keywords:
Comets, coma; Comet 103P/Hartley 2; Spectroscopy1 Introduction
The Jupiter-family comet 103P/Hartley 2 passed perihelion on 28 October 2010 at AU. It made an exceptional close approach to the Earth just before perihelion on 21 October at AU, providing us with the best opportunity to observe a Jupiter-family comet since 73P/Schwassmann-Wachmann 3 in May 2006 (Colom et al. 2006; Weaver 2006). It was the target of the EPOXI space mission, with a flyby at 700 km on 4.57 (UT) November 2010 (A’Hearn et al. 2011). For these two reasons, this comet was the object of an international campaign of observations (Meech et al. 2011). It was also the primary target of the cometary programme for the Herschel Space Observatory (Hartogh et al. 2009, 2011).
The observation of the 18-cm radio lines of the OH radical is a convenient way to measure the cometary water production rate and its evolution (Despois et al. 1981; Crovisier et al. 2002). We report here on supporting observations of these lines in comet 103P/Hartley 2 made with the Nançay radio telescope.

date [OH] [yymmdd] [AU] [AU] [km/s] (1) (2) [K] [mJy km/s] [mJy] [km/s] [km/s] [ s-1] 10/10/ 1.00 0.18 1.12 –7.9 –0.31 –0.37 3.7 –88 21 –51 10 0.71 0.19 1.71 0.48 0.7 0.2 10/10/ 2.00 0.18 1.12 –7.7 –0.31 –0.37 3.6 –68 19 –46 9 –0.15 0.20 1.64 0.50 0.7 0.2 10/10/ 3.01 0.17 1.11 –7.4 –0.31 –0.37 3.6 –112 23 –49 10 –0.07 0.21 2.09 0.51 0.9 0.2 10/10/ 4.01 0.17 1.11 –7.2 –0.31 –0.37 3.6 –134 18 –74 10 0.08 0.11 1.48 0.27 0.9 0.1 10/10/ 6.03 0.16 1.10 –6.6 –0.30 –0.35 3.6 –94 20 –52 9 –0.06 0.17 2.01 0.43 0.9 0.2 10/10/ 7.03 0.15 1.10 –6.4 –0.29 –0.34 3.6 –138 17 –62 8 –0.18 0.15 2.20 0.37 1.1 0.1 10/10/ 9.05 0.15 1.09 –5.8 –0.27 –0.32 3.6 –141 17 –77 9 –0.11 0.11 1.77 0.27 1.1 0.1 10/10/10.06 0.14 1.09 –5.6 –0.26 –0.31 3.7 –162 15 –87 7 –0.21 0.08 1.86 0.20 1.4 0.1 10/10/11.07 0.14 1.09 –5.3 –0.25 –0.30 3.8 –88 18 –62 13 –0.07 0.15 1.54 0.35 0.8 0.2 10/10/12.08 0.13 1.08 –5.0 –0.24 –0.29 3.9 –186 19 –75 9 0.14 0.13 2.27 0.34 1.6 0.2 10/10/13.09 0.13 1.08 –4.7 –0.23 –0.27 3.8 –101 16 –68 9 –0.06 0.12 1.71 0.29 1.2 0.2 10/10/14.10 0.13 1.08 –4.4 –0.22 –0.26 3.8 –134 21 –82 10 –0.16 0.11 1.68 0.27 1.6 0.2 10/10/15.10 0.13 1.07 –4.1 –0.21 –0.24 4.2 –123 18 –70 8 –0.04 0.11 1.73 0.26 1.4 0.2 10/10/17.12 0.12 1.07 –3.5 –0.18 –0.20 3.6 –99 17 –61 9 –0.11 0.15 1.66 0.37 1.7 0.3 10/10/18.13 0.12 1.07 –3.2 –0.16 –0.18 3.7 –79 15 –47 8 0.03 0.16 1.83 0.39 1.6 0.3 10/10/19.13 0.12 1.07 –2.9 –0.14 –0.15 3.5 –64 20 –50 11 –0.11 0.14 1.09 0.33 1.2 0.4 10/10/20.14 0.12 1.06 –2.6 –0.12 –0.12 3.5 –72 15 –43 8 –0.50 0.14 1.61 0.35 1.7 0.4 10/10/21.15 0.12 1.06 –2.2 –0.10 –0.10 3.5 –109 13 –47 6 –0.16 0.14 2.04 0.35 2.5 0.3 100803–100904 0.53 1.42 –14.1 0.25 0.17 3.3 6 4 100924–100929 0.21 1.14 –8.8 –0.27 –0.32 3.5 –68 8 –27 4 0.12 0.19 2.62 0.48 0.7 0.1 100930–101004 0.18 1.12 –7.5 –0.31 –0.37 3.6 –103 10 –53 5 0.12 0.08 1.74 0.21 0.8 0.1 101006–101011 0.15 1.09 –5.9 –0.28 –0.33 3.7 –131 7 –70 4 –0.14 0.05 1.87 0.13 1.1 0.1 101012–101015 0.13 1.08 –4.5 –0.23 –0.26 3.9 –132 9 –72 4 –0.04 0.06 1.84 0.15 1.4 0.1 101017–101021 0.12 1.07 –2.8 –0.14 –0.15 3.6 –86 7 –46 3 –0.20 0.07 1.79 0.18 1.8 0.1 101030–101102 0.14 1.06 1.1 0.04 0.10 3.4 42 7 20 3 0.16 0.17 1.97 0.43 1.7 0.3 101118–101130 0.25 1.12 7.8 –0.08 –0.03 3.3 –14 4 –6 2 0.08 0.48 3.54 1.23 1.2 0.4 101201–101215 0.32 1.19 10.6 –0.17 –0.20 3.4 –22 4 –14 3 0.21 0.16 1.50 0.40 0.6 0.1 101217–101230 0.41 1.30 12.8 –0.14 –0.21 3.4 –5 5 110103–110131 0.60 1.51 14.8 –0.08 –0.10 3.4 2 3
The display of the Table follows that used by Crovisier et al. (2002). The respective columns are the date of the observation (or the date range for the integrated spectra listed in the bottom part of the table); the geocentric distance ; the heliocentric distance ; the heliocentric radial velocity ; the expected inversion of the OH maser according to (1) Despois et al. (1981) and (2) Schleicher and A’Hearn (1988); the background brightness temperature ; the integrated line area ; the results of a Gaussian fit to the line: line intensity , line central velocity and line width at half-maximum ; the OH production rate [OH] according to the Haser-equivalent model with collisional quenching described in Crovisier et al. (2002).
2 Observations
The Nançay radio telescope is a meridian instrument with a arcmin field of view at 18-cm wavelength. The other characteristics of the telescope and the methodology used for the cometary observations and their reduction were described by Crovisier et al. (2002).
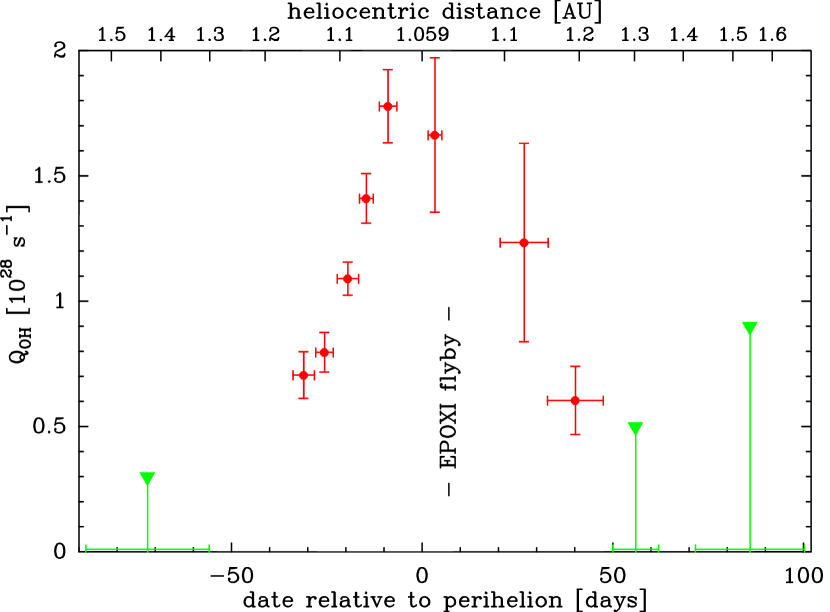
Observations of comet 103P/Hartley 2 at Nançay began on 3 August 2010 and were scheduled until the end of January 2011. The first detection of 18-cm OH lines occurred at the end of September with a production rate [OH] = s-1 at a heliocentric distance AU (Crovisier et al. 2010). The comet was detected until 15 December 2010, with episodic gaps due to telescope scheduling, technical problems, or low OH-maser inversion. Excerpts of the results for the 1–21 October period are listed in the top part of Table 1. Results for integrated spectra selected over the entire apparition are listed in the bottom part of Table 1 and shown in Fig. 1. The long-term evolution of the OH production rate is shown in Fig. 2. For a full day-by-day report, see http://www.lesia.obspm.fr/planeto/cometes/ basecom/HT/indexht.html.
3 Results and discussion
The OH production rates reported in Table 1 and by Crovisier et al. (2010) are based on a Haser-equivalent model (Combi and Delsemme 1980). The excitation of the OH radical assumes the -dependent maser inversion of the model of Despois et al. (1981) and takes into account collisional quenching. An enhancement of the continuum background as the comet passed across the galactic plane around 15 October was also taken into account as explained by Crovisier et al. (2002).
3.1 Line shape and gas expansion velocity
Our Haser-equivalent model uses standard values of 0.80 km s-1 for the OH-parent expansion velocity and 0.95 km s-1 for the OH ejection velocity at photodissociation (Crovisier et al. 2002). However, may be smaller for this weakly productive comet, leading to an over-evaluation of the OH production. Indeed, from Tseng et al. (2007) who undertook a statistical study of the OH line shapes from the Nançay data, we expect km s-1 for a comet with s-1 at AU. The real value may still be smaller since we are sampling a smaller inner region in this close-by comet.

We thus re-evaluated following the trapezium method of Bockelée-Morvan et al. (1990), from the average spectrum of 4–15 October obtained at AU and AU (Fig. 3) (this method requires a line shape observed with a high signal-to-noise ratio and can only be applied to this part of our observations). We derive km s-1. This does not make a drastic difference with the expected value from Tseng et al. (2007) and agrees well with the expansion velocities derived from other molecular lines observed at radio wavelengths (Biver et al. 2011, and in preparation).
3.2 The radio OH observations at the time of the EPOXI flyby
Comet 103P/Hartley 2 could be detected in the period 30 October–2 November, just after perihelion and just before the EPOXI flyby, when km s-1, corresponding to a weakly positive OH inversion (0.04–0.10). The OH production rate is then estimated to s-1.
No observation was possible on 3 and 4 November due to a technical failure. At the very time of the EPOXI flyby (4 November 2010), the expected OH inversion is small and its predictions differ between the Despois et al. (1981) and Schleicher and A’Hearn (1988) models (0.02 and 0.05, respectively). The interpretation of the radio OH observations in terms of production rates is thus difficult at this moment.
Indeed, the detection of comet 103P/Hartley 2 at Nançay at the end of October was favoured by the small geocentric distance. For comparison, comet 9P/Tempel 1 (the target of the Deep Impact mission) had similar and maser inversion around 5 July 2005. It could be then detected with the 100-m Green Bank telescope thanks to a long integration (Howell et al. 2007), but not at Nançay which could only integrate one hour per day (Biver et al. 2007). With a comparable OH production rate, 9P/Tempel 1 was then at at AU, whereas 103P/Hartley 2 was much closer at AU.
3.3 Comparison with other production rates
Method instrument date [H2O]a) reference 2010 s-1 H2O sub-mm Odin 29 Oct.–1 Nov. 0.75–1.24 Biver et al. (2010, 2011) H2O sub-mm Herschel/HIFI 30 Oct. Lis et al. (2010) H2O sub-mm Herschel/PACS 4 Nov. 1.2 Meech et al. (2011) H2O IR Keck/NIRSPEC 4 Nov. 0.77–1.57 Dello Russo et al. (2010, 2011) H2O IR Keck/NIRSPEC 22 Oct.–16 Nov. 0.65–0.84 Mumma et al. (2010, 2011) Ly- SOHO/SWAN 4 Nov. Combi et al. (2011) OH near UV Lowell observatory 31 Oct. 1.15 Knight and Schleicher (2012) OH 18-cm Nançay 30 Oct.–2 Nov. this work
a) The listed production rates include both the short-term temporal variations and the published errors. The OH production rate has been multiplied by 1.1 to account for the photolytic branching ratio.
The water production was directly measured in this comet from submillimetric rotational transitions from space with Odin (Biver et al. 2010, 2011) and with the three instruments of Herschel (Lis et al. 2010; Hartogh et al. 2011; Meech et al. 2011), from ro-vibrational lines in the infrared from the ground (Dello Russo et al. 2010, 2011; Mumma et al. 2010, 2011). It was indirectly measured from the observation of its photodissociation products: of OH in the near-UV (Knight and Schleicher 2012), of H from the Ly- line observed by SOHO/SWAN (Combi et al. 2011).
Published water production rates from these concurrent observations, for dates close to the EPOXI flyby, are listed in Table 2. They range from 0.6 to s-1. The Nançay measurement is on the high side of this spread. The importance of the spread may be attributed to the short-term variation of the comet activity linked to its rotation (see below), but also to the idiosyncrasies of the various models used to interpret the different methods of observation. The large Nançay beam is also more sensitive to water outgassed from icy grains.
3.4 Short- and long-term variations
From many contemporaneous observations — visible imaging, spectrophotometry and radar monitoring — a comet rotation period of 17–18 hours was derived (Jehin et al. 2010; Harmon et al. 2011; Knight and Schleicher 2011; Samarasinha et al. 2011). A strong modulation of the production rates of gas species was observed with the same period (Drahus et al. 2011). For water, the modulation had an amplitude of nearly a factor of two, as was observed by e.g. Odin (Biver et al. 2011).
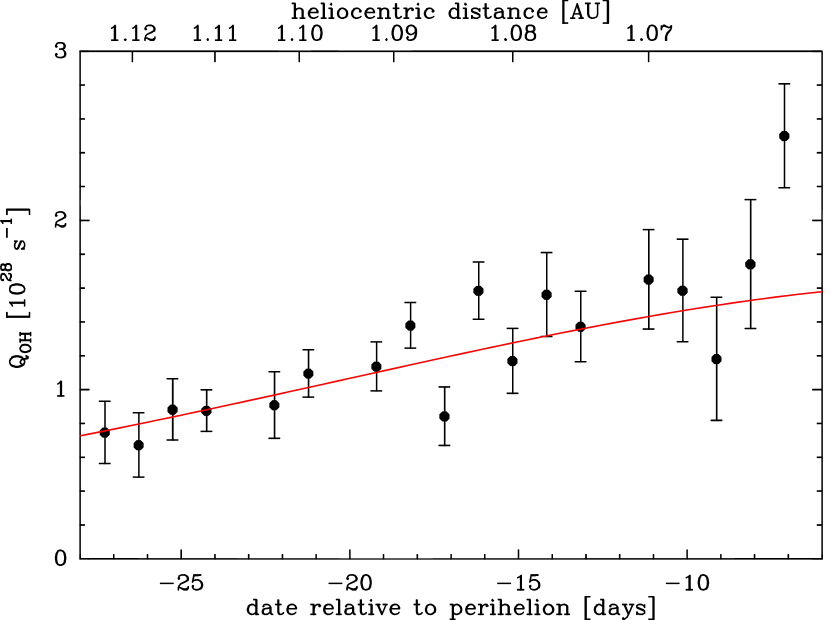
The short-term variation of the OH production rate observed at Nançay in October 2010 is shown in Fig. 4. One can see a steady increase of the production rate as the comet was approaching the Sun, but no sign of a periodic modulation. This is not unexpected: with a 1-hour observation every day at Nançay, the time variation of the OH production rate was badly sampled. Moreover, temporal variations are averaged over the large beam of Nançay ( arcmin) and smoothed by the progressive photodissociation of water which has a lifetime of approximately one day. It is thus delusive to try to recover a period of the order of one day from the Nançay data, although the 7-day period of comet 1P/Halley could be successfully retrieved in the past (Colom and Gérard 1988).
In the month preceding perihelion, the water production was steeply increasing (Figs 2 and 4), roughly following an law. The post-perihelion evolution shows a similarly steep decrease (but not so well constrained due to larger errors). These variations can difficultly be explained by the small variation in the heliocentric distance. A seasonal effect may be suspected, which could be further investigated when the rotational state of the comet and especially its pole orientation will be precisely known.
The water production rate preceding perihelion measured by SOHO/SWAN also shows an increase by a similar amount. But this increase appears to be almost entirely due to a sudden jump — by a factor — 27 days before perihelion (Combi et al. 2011). This jump is not present in the Nançay data for which the rise is progressive.
4 Conclusion
-
1.
The 18-cm lines of OH were monitored in comet 103P/Hartley 2 with the Nançay radio telescope from August 2010 to January 2011. They were detected from 24 September to 15 December 2010.
-
2.
From the line shapes, we derive an expansion velocity km s-1 for the gas coma in October. This is comparable to what is observed for comets with comparable gas production rates at similar heliocentric distances.
-
3.
The water production rate is estimated to s-1 just before the EPOXI flyby.
-
4.
The timing of our meridian observations was not appropriate to retrieve a possible modulation of the comet activity by its rotation if the period is as short as one day. The water production was observed to increase steeply, but progressively, in the month preceding perihelion.
Acknowledgements
The Nançay Radio Observatory is the Unité scientifique de Nançay of the Observatoire de Paris, associated as Unité de service et de recherche (USR) No B704 to the French Centre national de la recherche scientifique (CNRS). Its upgrade was financed jointly by the Conseil régional of the Région Centre in France, the CNRS and the Observatoire de Paris. Part of the research leading to these results received funding from the European Community’s Seventh Framework Programme (FP7/2007–2013) under grant agreement No. 229517.
References
- A’Hearn et al. (2011) A’Hearn, M. F., et al., 2011. EPOXI at Comet Hartley 2. Science 332, 1396–1400.
- Biver et al. (2007) Biver, N., et al., 2007. Radio observations of Comet 9P/Tempel 1 before and after Deep Impact. Icarus 187, 253–271.
- Biver et al. (2010) Biver, N., et al., 2010. Comet 103P/Hartley. IAU Elect. Circ. 2524.
- Biver et al. (2011) Biver, N., et al., 2011. Molecular composition and outgassing variability of 103P/Hartley 2 from mm and submm observations. In: EPSC Abstracts Vol. 6, EPSC-DPS2011-912.
- Bockelée-Morvan et al. (1990) Bockelée-Morvan, D., Crovisier, J., Gérard, E., 1990. Retrieving the coma gas expansion velocity in P/Halley, Wilson (1987 VII) and several other comets from the 18-cm OH line shapes. Astron. Astrophys. 238, 382–400.
- Colom et al. (2006) Colom, P., Crovisier, J., Biver, N., Bockelée-Morvan, D., Boissier, J., Lecacheux, A., 2006. Observations of comet 73P/Schwassmann-Wachmann 3 with the Nançay radio telescope. In: Barret, D., Casoli, F., Lagache, G., Lecavelier, A., Pagani, L. (Eds.), SF2A-2006: Semaine de l’Astrophysique Française, pp. 389–393.
- Colom and Gérard (1988) Colom, P., Gérard, E., 1988. A search for periodicities in the OH radio emission of comet P/Halley (1986 III). Astron. Astrophys. 204, 327–336.
- Combi et al. (2011) Combi, M. R., Bertaux, J.-L., Quémerais, E., Ferron, S., Mäkinen, J. T. T., 2011. Water production by comet 103P/Hartley 2 observed with the SWAN instrument on the SOHO spacecraft. Astrophys. J. 734, L6.
- Combi and Delsemme (1980) Combi, M. R., Delsemme, A. H., 1980. Neutral cometary atmospheres. I - an average random walk model for photodissociation in comets. Astrophys. J. 237, 633–640.
- Crovisier et al. (2010) Crovisier, J., Colom, P., Biver, N., Bockelée-Morvan, D., 2010. Comet 103P/Hartley. IAU Elect. Circ. 2495.
- Crovisier et al. (2002) Crovisier, J., Colom, P., Gérard, E., Bockelée-Morvan, D., Bourgois, G., 2002. Observations at Nançay of the OH 18-cm lines in comets. The data base. Observations made from 1982 to 1999. Astron. Astrophys. 393, 1053–1064.
- Dello Russo et al. (2010) Dello Russo, N., Vervack, R. J., Jr., Kawakita, H., Kobayashi, H., 2010. Comet 103P/Hartley. IAU Circ. 9171.
- Dello Russo et al. (2011) Dello Russo, N., et al., 2011. The volatile composition and activity of comet 103P/Hartley 2 during the EPOXI closest approach. Astrophys. J. 734, L8.
- Despois et al. (1981) Despois, D., Gérard, E., Crovisier, J., Kazès, I., 1981. The OH radical in comets - Observation and analysis of the hyperfine microwave transitions at 1667 MHz and 1665 MHz. Astron. Astrophys. 99, 320–340.
- Drahus et al. (2011) Drahus, M., et al., 2011. Rotation state of comet 103P/Hartley 2 from radio spectroscopy at 1 mm. Astrophys. J. 734, L4.
- Harmon et al. (2011) Harmon, J. K., Nolan, M. C., Howell, E. S., Giorgini, J. D., Taylor, P. A., 2011. Radar observations of comet 103P/Hartley 2. Astrophys. J. 734, L2.
- Hartogh et al. (2009) Hartogh, P., et al., 2009. Water and related chemistry in the solar system. A guaranteed time key programme for Herschel. Planet. Space Scie. 57, 1596–1606.
- Hartogh et al. (2011) Hartogh, P., et al., 2011. Ocean-like water in the Jupiter-family comet 103P/Hartley 2. Nature 478, 218–220.
- Howell et al. (2007) Howell, E. S., Lovell, A. J., Butler, B., Schloerb, F. P., 2007. Radio OH observations of 9P/Tempel 1 before and after Deep Impact. Icarus 187, 228–239.
- Jehin et al. (2010) Jehin, E., Manfroid, J., Hutsemekers, D., Gillon, M., Magain, P., 2010. Comet 103P/Hartley. IAU Elect. Circ. 2589.
- Knight and Schleicher (2011) Knight, M. M., Schleicher, D. G., 2011. CN morphology studies of comet 103P/Hartley 2. Astron. J. 141, 183.
- Knight and Schleicher (2012) Knight, M. M., Schleicher, D. G., 2012. The highly unusual outgassing of comet 103P/Hartley 2 from narrowband photometry and imaging of the coma. Icarus, this issue.
- Lis et al. (2010) Lis, D. C., et al., 2010. Comet 103P/Hartley. IAU Circ. 9185.
- Meech et al. (2011) Meech, K. J., et al., 2011. EPOXI: Comet 103P/Hartley 2 observations from a worldwide campaign. Astrophys. J. 734, L1.
- Mumma et al. (2010) Mumma, M. J., et al., 2010. Comet 103P/Hartley. IAU Circ. 9180.
- Mumma et al. (2011) Mumma, M. J., et al., 2011. Temporal and spatial aspects of gas release during the 2010 apparition of comet 103P/Hartley 2. Astrophys. J. 734, L7.
- Samarasinha et al. (2011) Samarasinha, N. H., Mueller, B. E. A., A’Hearn, M. F., Farnham, T. L., Gersch, A., 2011. Rotation of Comet 103P/Hartley 2 from structures in the coma. Astrophys. J. 734, L3.
- Schleicher and A’Hearn (1988) Schleicher, D. G., A’Hearn, M. F., 1988. The fluorescence of cometary OH. Astrophys. J. 331, 1058–1077.
- Tseng et al. (2007) Tseng, W.-L., Bockelée-Morvan, D., Crovisier, J., Colom, P., Ip, W.-H., 2007. Cometary water expansion velocity from OH line shapes. Astron. Astrophys. 467, 729–735.
- Weaver (2006) Weaver, H. A., 2006. The amazing apparition of 73P/Schwassmann-Wachmann 3 in 2006. Bull. Amer. Astron. Soc. 38, 484.