Detection of atomic carbon [C II] 158 m and dust emission from a quasar host galaxy
Abstract
Using the IRAM Plateau de Bure Interferometer, we report the detection of the 158 m [C II] emission line and underlying dust continuum in the host galaxy of the quasar ULAS J112001.48+064124.3 (hereafter J1120+0641) at . This is the highest redshift detection of the [C II] line to date, and allows us to put the first constraints on the physical properties of the host galaxy of J1120+0641. The [C II] line luminosity is , which is a factor 4 lower than observed in a luminous quasar at (SDSS J1148+5251). The underlying far-infrared (FIR) continuum has a flux density of mJy, similar to the average flux density of quasars that were not individually detected in the rest-frame FIR. Assuming that the FIR luminosity of = is mainly powered by star formation, we derive a star formation rate in the range 160–440 yr-1 and a total dust mass in the host galaxy of (both numbers have significant uncertainties given the unknown nature of dust at these redshifts). The [C II] line width of km s-1 is among the smallest observed when compared to the molecular line widths detected in quasars. Both the [C II] and dust continuum emission are spatially unresolved at the current angular resolution of 2.01.7 arcsec2 (corresponding to 109 kpc2 at the redshift of J1120+0641).
Subject headings:
cosmology: observations — galaxies: active — galaxies: high-redshift — galaxies: individual (ULAS J112001.48+064124.3) — galaxies:ISM1. Introduction
Understanding the formation of the earliest quasars and host galaxies has become of great importance since the discovery of the bulge mass–black hole mass correlation in nearby galaxies, a result which led to the suggestion of a fundamental relationship between (massive) black holes and spheroidal galaxy formation (e.g. Tremaine et al., 2002; Marconi & Hunt, 2003). So far, the stellar component of the host galaxies of luminous quasars have defied detection at (observed) optical and near-infrared wavelengths, which is typically attributed to the central point sources outshining their surroundings. On the other hand, observations of the molecular gas, through emission lines of, e.g., CO, redshifted in the millimeter and radio wavebands allows one to probe the total gas mass and derive the dynamical mass of the high redshift quasar hosts. These observations indicate that the high- quasars are associated with active star forming host galaxies with star formation rates (SFRs) 1000 yr-1 (Wang et al., 2008).
The C+ fine structure line at 157.74 m (hereafter [C II] 158 m) is one of the strongest cooling lines in the warm interstellar medium (ISM), containing up to 1% of the far-infrared (FIR) emission in local starburst galaxies (Stacey et al., 1991). COBE observations of the Milky Way (Wright et al., 1991) show that this transition is the strongest FIR line emitted by the ISM in our Galaxy ( ). For sources at redshifts , the [C II] emission line is redshifted to the sub/millimeter and becomes observable using ground based facilities. Early attempts to detect the [C II] line in the quasar BR1202–0725 by Isaak et al. (1994) were unsuccessful due to technological limitations. More recently, [C II] has been detected in a number of quasar host galaxies and submillimeter galaxies, including BRI 0952–0115 (; Maiolino et al., 2009), BRI 1335–0417 (; Wagg et al., 2010), LESS J033229.4 (; De Breuck et al., 2011) and SDSS J1148+5251 (; Maiolino et al., 2005).
To further constrain the build-up of massive galaxies at the earliest cosmic epochs, it is imperative to locate and study bright quasars at the highest redshifts possible. Recently, Mortlock et al. (2011) discovered a bright quasar at a redshift , ULAS J112001.48+064124.3 (hereafter J1120+0641), the only quasar currently known at . The absolute magnitude of , the black hole mass of and (metal) emission line strengths (Mortlock et al., 2011) are all comparable to those observed in quasars. Here we present the detection of the redshifted [C II] 158 m emission line and the underlying dust far-infrared continuum emission in J1120+0641. In Section 2 we introduce the observations obtained with the IRAM Plateau de Bure Interferometer (PdBI), followed by a description of our results in Section 3. In Section 4 we discuss the implications of our findings and we present a summary in Section 5. Throughout this Letter a concordance cosmology with km s-1 Mpc-1, and is adopted, leading to a luminosity distance for a source at of Gpc, a spatial scale of 5.2 kpc arcsec-1. The age of the universe at is 740 Myr.
2. Observations
Observations of the [C II] 157.74 m ( GHz) line in J1120+0641 at a redshift (observed frequency of 235.07 GHz, or 1.276 mm) were carried out between 2011 March and 2012 January with the WideX correlator using the PdBI. The quasar was observed on 2011 March 9 for 2.9 hr with five antennas in C configuration, and on 2011 December 13 and 15 and 2012 January 12 and 18 for a total of 6.3 hr with six antennas in D configuration. For the phase calibration the source J1055+018 was observed every 30 minutes. Absolute flux calibration was obtained by observing 3C273 and MWC349 before and after each track. The WideX correlator provides an instantaneous bandwidth of 3.6 GHz in dual polarization, which corresponds to 4400 km s-1 at 235 GHz. With the goal to have a better measurement of the continuum level, the frequency setup was shifted by +1000 km s-1 after the 2011 March observations. The total on-source integration time was 8.25 hr (six antenna equivalent).
The data were reduced using the Grenoble Image and Line Data Analysis System (GILDAS) software111http://www.iram.fr/IRAMFR/GILDAS. The data were rebinned to a resolution of 20 MHz (25.5 km s-1). The final resolution of the image where both frequency setups overlap is 202171 at a position angle of 23∘. The rms of the final image is 1.09 mJy beam-1 per 20 MHz bin.
3. Results
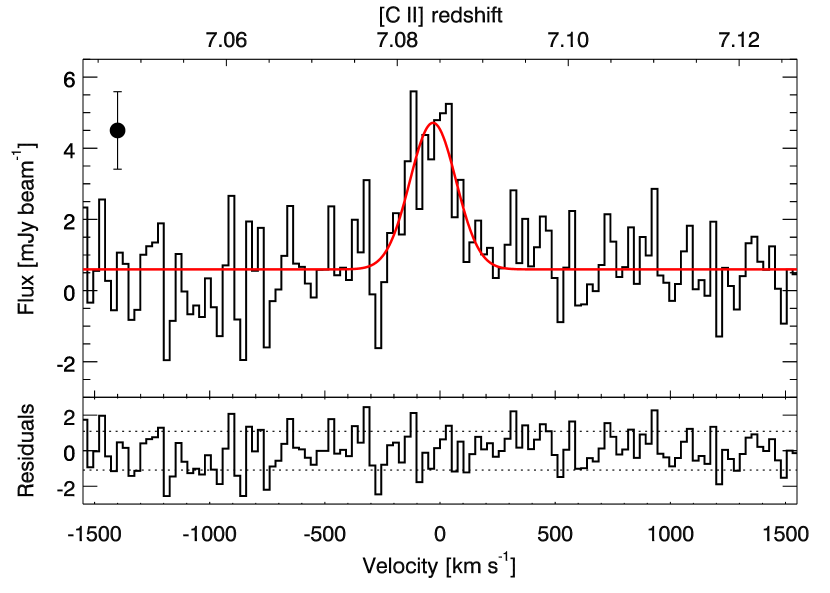
The final spectrum of the [C II] emission line and the underlying continuum towards J1120+0641 is shown in Figure 1 (top panel). The [C II] emission is clearly detected at a redshift of . This is slightly blueshifted (by km s-1) but consistent with the redshift of (Mortlock et al., 2011), which was derived by fitting the template of Hewett & Wild (2010) to the rest-frame UV emission lines. The [C II] emission line has a peak flux density of mJy beam-1. In addition, the underlying (rest-frame) far-infrared continuum is also detected, albeit at lower significance. Fitting the line with a Gaussian gives a dispersion of km s-1, corresponding to a full width at half maximum (FWHM) of 23535 km s-1.
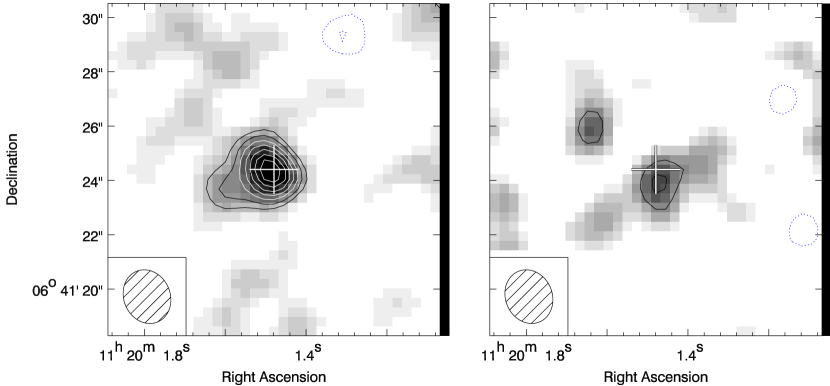
Figure 2 shows an image of the [C II] line and the underlying continuum emission. The map in the [C II] emission line (which was averaged from 153 km s-1 to +102 km s-1) results in a 9.4 detection at the near-infrared location of the quasar. The integrated flux of the line is Jy km s-1 (or W m-2), which corresponds to a luminosity of . This [C II] luminosity is a factor of 4 lower than that of the bright quasar SDSS J1148+5251 ( ; Maiolino et al., 2005; Walter et al., 2009). The width of the [C II] line of 23535 km s-1 in J1120+0641 is, on the other hand, similar to the line width seen in SDSS J1148+5251 of 35050 km s-1.
The line free part of the spectrum can be used to estimate the far-infrared continuum emission around 158 m in the rest-frame of the quasar. Averaging the channels from 1500 km s-1 to 290 km s-1 and from +215 km s-1 to +1500 km s-1 results in a detection of the continuum at a level of 0.610.16 mJy. This is a factor 2 below the average 250 GHz flux density found towards all observed quasars222 Although the luminosity distance increases by 20% between and , the negative -correction results in a flux density at a fixed observed frequency that is nearly constant. In our case, the observed continuum at 235 GHz will appear 15% brighter for a source at compared to one at observed at 250 GHz (assuming that the FIR emission comes from a grey body with , see Section 4.1). (1.260.10 mJy; Wang et al., 2008), but comparable to the average flux density of quasars that were not individually detected at 1 mm (0.520.13 mJy; Wang et al., 2008).
Finally, neither the [C II] emission line nor the underlying continuum are spatially resolved with the current resolution of the data, i.e., arcsec2, corresponding to a spatial scale of 10.48.9 kpc2 at .
4. Discussion
4.1. Far-infrared Luminosity
The far-infrared luminosity () of J1120+0641 can be computed by approximating the shape of the far-infrared continuum with an optically thin graybody. Here we assume a dust temperature of K and dust emissivity power-law spectral index of (), based on the mean spectral energy distribution (SED) of quasar hosts in the redshift range (Beelen et al., 2006). The grey body is scaled to 0.61 mJy (our continuum detection) at an rest-frame frequency of GHz. Following the prescription of Helou et al. (1988) and integrating the graybody from 42.5 to 122.5 m in the rest-frame, we derive for J1120+0641 log()0.12 . Assuming a temperature of 41 K and a (the best-fitting values found for a sample of quasars, Priddey & McMahon, 2001) gives a that is 8% lower. If we instead fit our continuum detection to a template of Arp 220 or M82 (Silva et al., 1998), we derive a log() and log() , respectively. To conclude, our best estimate for is in the range – .
From our detections of the FIR continuum we can estimate an SFR. A key question here is which fraction of the FIR emission in quasars is powered by star formation. Studies of lower redshift quasars found fractions ranging from 25% (e.g. Shi et al., 2007), 30%–100% (e.g. Schweitzer et al., 2006) to 50% (e.g. Walter et al., 2009). Below we assume that all the 158 m flux density arises from star formation. This should be treated as an upper limit on the SFR in J1120+0641.
Integrating the grey body from 8 m to 1000 m we get a total infrared luminosity of . Applying the relation between the total infrared luminosity and SFR by Kennicutt (1998), we derive an SFR of yr-1 adopting a Salpeter initial mass function (IMF). This SFR is a factor 1.51 lower when using a Kroupa IMF. On the other hand, using the template of Arp 220 (M82), we infer ( ) and an SFR of yr-1 ( yr-1).
The measured far-infrared flux density combined with the assumed dust temperature and emissivity can provide an estimate of the total dust mass in the quasar host (e.g., Hildebrand, 1983; Magdis et al., 2011):
| (1) |
where is the far-infrared continuum flux density measured at rest-frame wavelength , is the luminosity distance, is the Planck function at for temperature , and is the dust mass opacity coefficient and is given by cm2 g-1 (Dunne et al., 2000). Assuming that the properties of dust grains at are similar to those at low redshift, we derive , where the error only includes the uncertainty in the far-infrared continuum flux. Alternatively, we can make use of the templates of Arp 220 and M82 for which Silva et al. (1998) derived total dust masses. If the properties of the dust in J1120+0641 are similar to that in Arp 220 (M82), then we obtain a dust mass of ( ).
4.2. [C II] Line to FIR Continuum Ratio
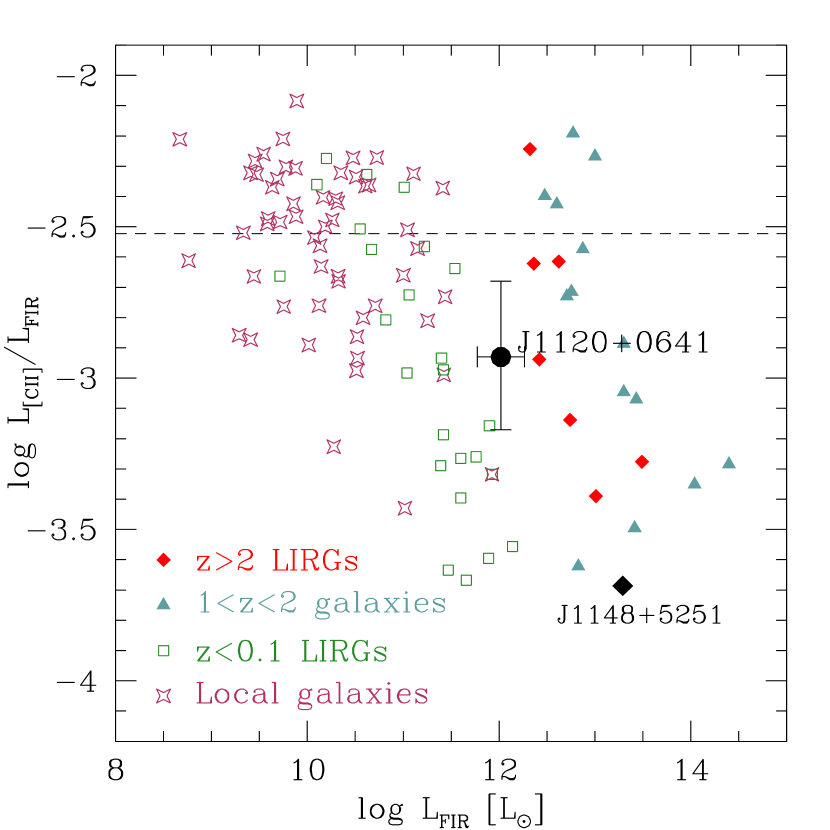
Surveys of local starbursts and quiescent star-forming galaxies have shown a tight correlation between and (e.g., Stacey et al., 1991), although the ratio / seems to decrease for galaxies with (ULIRGs). In Figure 3 we plot a compilation of / ratios as function of , obtained from the literature. Also shown is the measurement of J1120+0641 of /, based on our estimate of of – . The ratio we measure for J1120+0641 is below those of local starburst galaxies and star-forming galaxies at which have / . However, it is a factor few higher than the only other / ratio currently known above , the one measured in the quasar SDSS J1148+5251 (which has / ; Maiolino et al., 2005).
4.3. Dynamical Constraints
It is instructive to compare the implied gas dynamics to that of other high-redshift quasars. We here assume that the [C II] and CO line widths are roughly the same, which is the case for J1148+5251 at (Maiolino et al., 2005). The CO lines observed in quasars have line FWHMs between 160 and 860 km s-1, with a median around 350 km s-1 (e.g. Wang et al., 2010, 2011). Quasars in the range have a very similar median line width of 325 km s-1 (Solomon & Vanden Bout, 2005; Riechers et al., 2006). The width of the [C II] line in J1120+0641 (23535 km s-1) is therefore less than the median found in quasars. Out of 12 published CO line widths in quasars only one has a line width less than 235 km s-1 (FWHM = 160 km s-1 in SDSS J1044–0125; Wang et al., 2010).
In the following discussion, we assume that the [C II] emission comes from a disk and that we can calculate a dynamical mass from the observed line width using (Ho, 2007), where is the radius of the source and its inclination angle. With an observed FWHM of km s-1, we derive a dynamical mass for J1120+0641 of . Since our observations do not resolve the source spatially, we can only obtain an upper limit on the size of kpc. Assuming an (unknown) inclination angle of 30∘ leads to a dynamical mass of . Even in the extreme case that all of this mass was present in the form of stars in the bulge of the host galaxy and assuming that the bulge does not extend beyond 5 kpc, this would imply a black hole-bulge mass ratio of . Unless the inclination angle is below 20∘, this is above the locally observed ratio of (e.g., Merritt & Ferrarese, 2001; Marconi & Hunt, 2003; Graham, 2012), similar to what has been found in other high-redshift quasars (Wang et al., 2008). Future observations, especially high resolution observations to derive the size and inclination angle of the emission with ALMA, will improve the constraints on the dynamical mass of the system and could lead to a better estimate of the ratio.
5. Summary
Observations at 235 GHz using the PdBI resulted in the detection of the [C II] emission line and underlying dust continuum emission in the host galaxy of the quasar J1120+0641 at . These results show, for the first time, the existence of significant amounts of cold gas and dust at , when the universe was just 740 Myr old. Based on the mm observations, we can derive the following properties of the quasar host galaxy:
-
•
The [C II] luminosity of is only a factor 4 lower than the one observed in the more luminous quasar J1148+5251. The width of the line ( km s-1) is smaller that what has typically been found in quasar host galaxies around . The emission remains unresolved at a resolution of 202171, which corresponds to 10.58.9 kpc2 at the redshift of the line.
-
•
The far-infrared flux density (at a rest-frame wavelength of 158 m) of mJy implies, depending on the model that is used, a far-infrared luminosity of . If all the far-infrared dust emission is powered by star formation, the SFR is between 160 and 440 yr-1. The total dust mass implied by the FIR emission is estimated to be in the range . The / ratio of is lower than those measured in local star-forming galaxies, but (at least) a factor 3 higher than in J1148+5251.
-
•
If we assume that the [C II] emission arises from a disk geometry, then the narrow line width implies a relatively small dynamical mass of . Taking an upper limit on the size of kpc results in a limit on the dynamical mass of . Even if all of the dynamical mass is in the form of stars, the / is above the locally observed ratio, unless the inclination angle is .
Future observations will allow us to better constrain the properties of the host galaxy of J1120+0641. For example, the detection of the far-infrared continuum at other frequencies with, e.g., ALMA or the upgraded PdBI, the Northern Extended Millimeter Array (NOEMA), will constrain the shape of the FIR SED and thus . On the other hand, observations of the [C II] line at higher spatial resolution will provide information about the extent of the line emission and will give better constraints on the dynamical mass. Finally, the detection of other (millimeter) emission lines such as CO, [C I] 370 m, [C I] 230 m, [O I] 146 m and/or [N II] 122 m (which could be observed with e.g. ALMA or NOEMA) will provide estimates of the total gas mass and could shed light on the metallicity and ionization state of the ISM in the host galaxy of J1120+0641.
References
- Beelen et al. (2006) Beelen, A., Cox, P., Benford, D. J., et al. 2006, ApJ, 642, 694
- Cox et al. (2011) Cox, P., Krips, M., Neri, R., et al. 2011, ApJ, 740, 63
- De Breuck et al. (2011) De Breuck, C., Maiolino, R., Caselli, P., et al. 2011, A&A, 530, L8
- Dunne et al. (2000) Dunne, L., Eales, S., Edmunds, M., et al. 2000, MNRAS, 315, 115
- Graham (2012) Graham, A. W. 2012, ApJ, 746, 113
- Helou et al. (1988) Helou, G., Khan, I. R., Malek, L., & Boehmer, L. 1988, ApJS, 68, 151
- Hewett & Wild (2010) Hewett, P. C. & Wild, V. 2010, MNRAS, 405, 2302
- Hildebrand (1983) Hildebrand, R. H. 1983, QJRAS, 24, 267
- Ho (2007) Ho, L. C. 2007, ApJ, 669, 821
- Isaak et al. (1994) Isaak, K. G., McMahon, R. G., Hills, R. E., & Withington, S. 1994, MNRAS, 269, L28
- Ivison et al. (2010) Ivison, R. J., Swinbank, A. M., Swinyard, B., et al. 2010, A&A, 518, L35
- Kennicutt (1998) Kennicutt, R. C. 1998, ARA&A, 36, 189
- Magdis et al. (2011) Magdis, G. E., Daddi, E., Elbaz, D., et al. 2011, ApJ, 740, L15
- Maiolino et al. (2009) Maiolino, R., Caselli, P., Nagao, T., et al. 2009, A&A, 500, L1
- Maiolino et al. (2005) Maiolino, R., Cox, P., Caselli, P., et al. 2005, A&A, 440, L51
- Malhotra et al. (2001) Malhotra, S., Kaufman, M. J., Hollenbach, D., et al. 2001, ApJ, 561, 766
- Marconi & Hunt (2003) Marconi, A. & Hunt, L. K. 2003, ApJ, 589, L21
- Merritt & Ferrarese (2001) Merritt, D. & Ferrarese, L. 2001, MNRAS, 320, L30
- Mortlock et al. (2011) Mortlock, D. J., Warren, S. J., Venemans, B. P., et al. 2011, Nature, 474, 616
- Priddey & McMahon (2001) Priddey, R. S. & McMahon, R. G. 2001, MNRAS, 324, L17
- Riechers et al. (2006) Riechers, D. A., Walter, F., Carilli, C. L., et al. 2006, ApJ, 650, 604
- Schweitzer et al. (2006) Schweitzer, M., Lutz, D., Sturm, E., et al. 2006, ApJ, 649, 79
- Shi et al. (2007) Shi, Y., Ogle, P., Rieke, G. H., et al. 2007, ApJ, 669, 841
- Silva et al. (1998) Silva, L., Granato, G. L., Bressan, A., & Danese, L. 1998, ApJ, 509, 103
- Solomon & Vanden Bout (2005) Solomon, P. M. & Vanden Bout, P. A. 2005, ARA&A, 43, 677
- Stacey et al. (1991) Stacey, G. J., Geis, N., Genzel, R., et al. 1991, ApJ, 373, 423
- Stacey et al. (2010) Stacey, G. J., Hailey-Dunsheath, S., Ferkinhoff, C., et al. 2010, ApJ, 724, 957
- Tremaine et al. (2002) Tremaine, S., Gebhardt, K., Bender, R., et al. 2002, ApJ, 574, 740
- Wagg et al. (2010) Wagg, J., Carilli, C. L., Wilner, D. J., et al. 2010, A&A, 519, L1
- Walter et al. (2009) Walter, F., Riechers, D., Cox, P., et al. 2009, Nature, 457, 699
- Wang et al. (2010) Wang, R., Carilli, C. L., Neri, R., et al. 2010, ApJ, 714, 699
- Wang et al. (2008) Wang, R., Carilli, C. L., Wagg, J., et al. 2008, ApJ, 687, 848
- Wang et al. (2011) Wang, R., Wagg, J., Carilli, C. L., et al. 2011, ApJ, 739, L34
- Wright et al. (1991) Wright, E. L., Mather, J. C., Bennett, C. L., et al. 1991, ApJ, 381, 200