Gamma-ray follow-up studies on Carinae
Abstract
Aims. Observations of high-energy -rays recently revealed a persistent source in spatial coincidence with the binary system Carinae. Since modulation of the observed -ray flux on orbital time scales has not been reported so far, an unambiguous identification was hitherto not possible. Particularly the observations made by the Fermi Large Area Telescope (LAT) posed additional questions regarding the actual emission scenario. Analyses show two energetically distinct components in the -ray spectrum, which are best described by an exponentially cutoff power-law function (CPL) at energies below 10 GeV and a power-law (PL) component dominant at higher energies.
Methods. The increased exposure in conjunction with the improved instrumental response functions of the LAT now allow us to perform a more detailed investigation of location, spectral shape, and flux time history of the observed -ray emission.
Results. We detect a weak but regular flux decrease over time. This can be understood and interpreted in a colliding-wind binary scenario for orbital modulation of the -ray emission. We find that the spectral shape of the -ray signal agrees with a single emitting particle population in combination with significant absorption by - pair production.
Conclusions. We are able to report on the first unambiguous detection of GeV -ray emission from a colliding-wind massive star binary. Studying the correlation of the flux decrease with the orbital separation of the binary components allows us to predict the behaviour up to the next periastron passage in 2014.
Key Words.:
Gamma rays: stars - Binaries: general - Stars: binaries1 Introduction
Owing to its dramatic history (the ‘great eruption’ of 1843, subsequent disappearance, envelopment in a huge bipolar nebula, etc.), Carinae ( Car) has been of interest for astronomical and astrophysical research for more than a century. Recent observations by AGILE (Tavani et al. 2009) and -LAT (Abdo et al. 2010b) established high-energy -ray emission in spatial coincidence with the location of Car. Physical association, e.g. through observation of correlated multiband variability or orbital modulation of the -ray signal, has not yet been confidently presented. If this identification can be established, the Car system would be the first massive star colliding-wind binary system (CWB) in the -ray sky, in contrast to known -ray binaries, which all contain a compact object.
It is widely accepted (e.g., Damineli et al. 2008) that Car is a binary system consisting of two massive stars (one being a member of the rare stellar class of luminous blue variables (LBV), the other being an O or WR star) with an orbital period of 5.54 yr. Stellar and orbital parameters as determined by various studies are listed in Table 1. Both massive stars in the Car system are expected to produce powerful stellar winds. Mass-loss rates and terminal wind velocities (as given in the table) are thought to be sufficiently high to form a wind-wind collision zone of shocked, hot gas, wherein particle acceleration (as illustrated by e.g., Eichler & Usov 1993; Dougherty et al. 2003) in general and subsequent -ray emission in particular (as described by e.g., Reimer et al. 2006; Bednarek & Pabich 2011) can occur. The conditions in the wind-wind collision zone depend on the orbital phase of the binary system. Therefore, these models predict -ray emission that is generally modulated on orbital time scales. In addition there may exist complex dependencies, such as spectral cutoffs in the underlying particle spectrum due to excessive energy losses, anisotropy in the Inverse Compton process, or types of particle transport.
| Parameter | Value | Reference |
|---|---|---|
| 2.30.1 kpc | Davidson & Humphreys (1997) | |
| 20242 d | Corcoran et al. (2005) | |
| 45∘ | Okazaki et al. (2008) | |
| 0.9 | Smith et al. (2004) | |
| 27∘ | Okazaki et al. (2008) | |
| 0-30∘ | Parkin et al. (2009) | |
| 15.4 AU | Corcoran (2001) | |
| 90 M⊙ | Hillier et al. (2001) | |
| 30 M⊙ | Verner et al. (2005) | |
| M⊙yr-1 | Hillier et al. (2001) | |
| M⊙yr-1 | Pittard & Corcoran (2002) | |
| M⊙yr-1 | Pittard & Corcoran (2002) | |
| M⊙yr-1 | Parkin et al. (2009) | |
| 500 kms-1 | Hillier et al. (2001) | |
| 3000 kms-1 | Pittard & Corcoran (2002) |
Previous analyses of -LAT data (Abdo et al. 2010b; Farnier et al. 2011) have elaborated on the catalogued -source 1FGL J1045.25942 (Abdo et al. 2010a) that was found to be spatially consistent with the location of Car. Following the nomenclature of the new -LAT two-year catalogue (Nolan et al. 2012), the source designation 2FGL J1045.05941 is used from here on. The high-energy spectrum has been best described by an exponential cutoff power-law function (CPL) that appears to be dominant below 10 GeV, and an additional component described by a power-law function (PL) at higher energies. Neither study presented a flux time history that would unambiguously relate the observed -ray emission to a physical origin in the Car system. Whereas there is evidence for nonthermal emission of Car at energies well below the MeV range (Leyder et al. 2008; Sekiguchi et al. 2009), no -ray emission at energies above the energy range of the -LAT instrument has been reported from the vicinity of Car (HESS Collaboration et al. 2012).
2 Observations with the Large Area Telescope
2.1 Dataset
The -LAT started regular survey-mode observations on 2008 August 4, providing a complete, regular sky-coverage with approximately uniform exposure. Accordingly, the source of interest was monitored regularly over the whole time range of the dataset that is used in this analysis (35 months, 2008 August 4 to 2011 July 5). The data were reduced and analysed using the Fermi Science Tools v9r23 package111See the Fermi Science Support Centre (FSSC) website for details: http://fermi.gsfc.nasa.gov/ssc/. To reject atmospheric -rays from the Earth’s limb, we excluded time periods in which the region was observed at a zenith angle greater than 100∘ and for observatory rocking angles greater than 52∘. All remaining photons with energy E 200 MeV within a square of 21∘ base length (aligned in directions of right ascension and declination ) centred on the nominal location of Car, (, )=(161.265∘, 59.685∘) were used.
2.2 Likelihood analysis
Because Car is located at low Galactic latitude and within the projection of the Carina-Sagittarius arm of the Milky Way, careful modelling of the diffuse -ray emission is required. Due to the size of the -LAT’s point-spread function (PSF) – the 68% containment radius is more than 2∘ at 200 MeV – possible contributions from nearby sources have to be taken into account as well. We performed maximum likelihood analyses using the instrument response function P7SOURCEV6 in conjunction with the Galactic diffuse model gal2yearp7v6v0.fits and an isotropic background component isop7v6source.txt. The applied source model includes 38 point sources that are located within a radius of 15∘ around the source of interest and are listed in the -LAT two-year (2FGL) catalogue (Nolan et al. 2012). For each source the same spectral model as in the catalogue was used. The spectral parameters of all sources within a radius of 10∘ were allowed to vary in the likelihood analysis. Most sources are modelled either by a simple PL
| (1) |
(where is the normalization parameter and is the spectral index) or by a LogParabola function, which provides additional information on the spectral curvature of some sources by introducing a break energy and the parameters and ,
| (2) |
Exceptions are -ray pulsars, which are modelled by a CPL functional expression,
| (3) |
where is the cutoff energy (other parameters defined as above.) In all three cases gives the differential flux.
Source detection significance can be described by the likelihood test statistic value , which compares the ratio of two values that are obtained by a maximum likelihood procedure. is the likelihood for a model without an additional source at a specified location (the null-hypothesis) and is the maximum likelihood value for a model including an additional source. Surrounding sources and background are taken into account in both cases. The same notion can also be applied in comparing the likelihood of two source models that are described by different spectral models for a specific source of interest. Because the TS-value is expected to follow a -distribution for the difference in the number of degrees of freedom between the two models (Mattox et al. 1996), it can be converted into the detection significance for a point source.
3 Analysis details and results
3.1 Spatial analysis
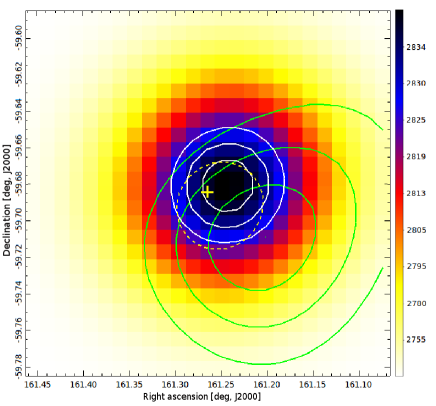
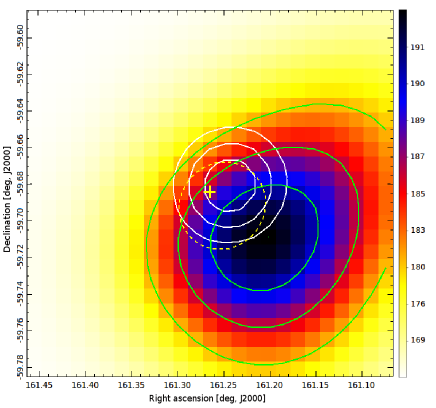
In the two Galactic coordinate grids in Figure 1, the TS-values indicate detection significances for a trial additional point source (a PL with two free parameters) considered sequentially at each of the grid positions. The left figure covers the region around 2FGL J1045.05941 at energies 0.2 to 10 GeV, the right figure at energies 10 to 300 GeV – each representing 35 months of data. The energy band has been divided according to the previous indication of two different emission components. Both TS-maps were obtained with the tool gttsmap. In addition, confidence contours mark the 68.3%, 95.4% and 99.7% uncertainty regions for the location of the source defined by the maximum TS value in the grids. For both energy bands the nominal position of Car is found within the 95.4% error region. For the low band it is contained within the 68.3% error region. The formal significance for the low- and high-energy band is 46 and 12 , respectively.
In the lower-energy band the -ray signal is centred at (, )=(161.243∘, 59.681∘) with a fairly circular 95% confidence region of radius =. In the higher-energy band the signal is centred at (, )=(161.209∘, 59.710∘) with an elliptical 95.4% confidence region that has a semimajor axis of =0.053∘ (NE-SW oriented) and a semiminor axis of =0.045∘. The interplay between a vast photon number at lower energies and statistical limitations at higher energies yields a smaller confidence region for the hard band. The angular separations of the maximum likelihood locations for the low- and high bands and the nominal position of Car are = 0.033∘, = 0.038∘, = 0.012∘. The centroid of the low-energy band is well inside the 95.4% error region of the high-energy band. Although the high band’s centroid lies slightly outside the low band’s 99.7% error circle, the error regions substantially overlap. The difference to the indicated catalogue position of 2FGL J1045.05941 is understood by acknowledging the difference in exposure and the decomposition into low- and high-energy bands. We stress that all aforementioned positions sufficiently agree to allow interpretation in a single-source scenario.
Considering the possibility of observing the -ray emission superimposed by two sources in close spatial coincidence, we consider this to be extremely unlikely. Although the nominal distance between the centroid of the observed low- and the high-energy emission would not exclude source confusion between a low-energy source with exponential cutoff and a hard-spectrum source at high energies, the probability of finding two spatially coincident sources that exhibit a similar flux modulation pattern (see Section 3.3), characteristic only for objects in the rare class of long-period -ray binaries, appears to be the main argument for rejecting this hypothesis.
3.2 Spectral analysis
The energy spectrum of 2FGL J1045.05941 has been determined by a maximum-likelihood fitting technique using the tool gtlike (dataset and source model as described above). The energy bins were chosen such that a minimum detection significance of 10 per bin is required (logarithmic scale with three bins between 0.2 GeV and 1 GeV and five bins between 1 GeV and 10 GeV). Owing to statistics, the criterion was lowered to require at least 5 detections per energy bin in the range from 10 GeV to 100 GeV. The highest energy bin (100 GeV to 300 GeV) corresponds to a 3 detection significance. For each bin a single PL shape was assumed. The normalization parameter and the index were allowed to vary during the fitting process. The effective energy of each bin is defined as the midpoint of the integral photon flux in the bin; therefore each energy bin carries some information about the underlying photon spectrum.
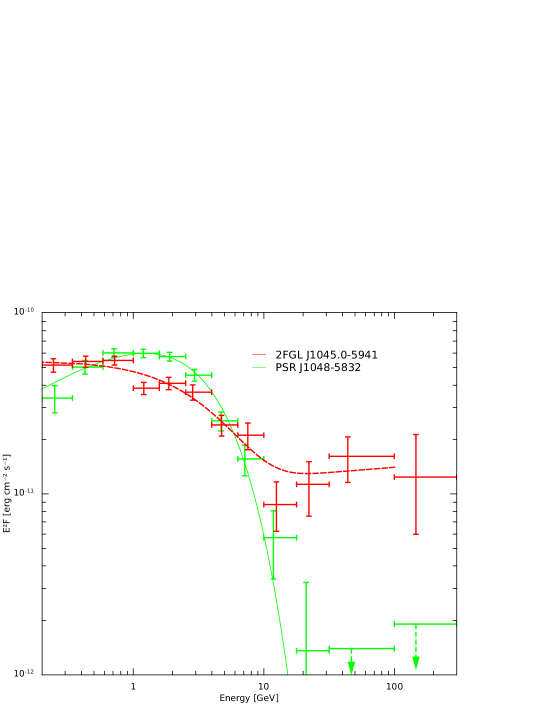
A spectral fit over the energy range (0.2 to 100 GeV) was obtained by fitting a source model with a CPL+PL function (both at the catalogue position of 2FGL J1045.05941) to the dataset up to 100 GeV using the maximum-likelihood tool gtlike. Events at energies E 100 GeV have not been considered in fitting spectral models, because they do not significantly influence the results. Figure 2 shows the energy spectra of 2FGL J1045.05941 along with the overlaid broad-band spectrum. The CPL+PL multi-component functional form has been applied previously by Abdo et al. (2010b) and continues to yield better spectral representation than a single PL or CPL function. For comparison to a signal without a second emission component, the spectrum of the nearby pulsar PSR J10485832 (1.2∘ angular distance) is shown, too. The best-fit parameters are a spectral index =1.97 0.05 and energy cutoff Ecutoff=3.5 0.1 GeV with an integrated flux of F =(1.20 0.04) 10-7 cm-2s-1 for the CPL, which dominates the low-energy band and =1.94 0.04 and an integrated flux of F =(3.2 0.3) 10 -8 cm-2s-1 for the PL dominant in the high-energy band. The corresponding formal significances of the two spectral components are 30 and 16 , respectively.
3.3 Temporal analysis
We now investigate the flux time history of the observed -ray emission. To search for coarse temporal signatures, two adjacent energy intervals were analysed: 0.2 to 10 GeV and 10 to 300 GeV, respectively. This choice corresponds to the apparent structure in the spectral energy distribution (SED) at 10 GeV as evident in Figure 2, which marks the transition between two spectral components. On the basis of 35 months of -LAT data it is not useful to search the power spectrum for the existence of the characteristic 5.5 yr orbital period in the Car system. Therefore we restrict the temporal analysis to flux variability investigations, conducted over the whole energy interval and in the two energy regimes separately.
3.3.1 Flux studies in the lower-energy band (0.2 to 10 GeV)
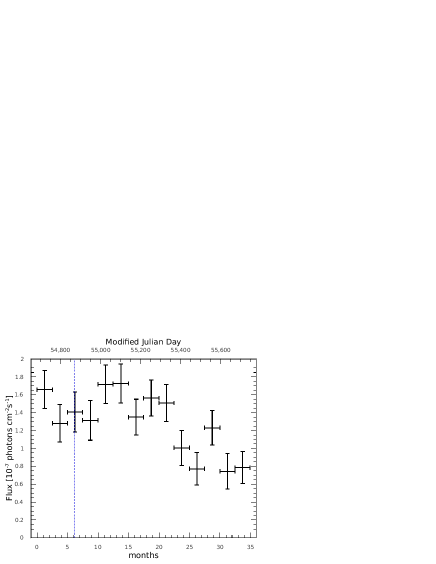
In Figure 3, left, we show the flux time history of 2FGL J1045.05941 for the energy band 0.2 to 10 GeV as obtained by likelihood analysis. The dataset was divided into fourteen consecutive intervals, each representing 2.5 months. For each time bin a CPL function (all parameters free) was fitted to the data. The average photon flux is (1.290.01) 10-7 cm-2s-1. Taking this value as the hypothesis for a non-varying source, a -test gives a probability of 99.986% (corresponding to 3.8 ) that this hypothesis is false. Conducting the same study on the two nearby pulsars PSR J10485832 and PSR J10445737 (at angular separation of 1.2∘ and 2.0∘), which are expected to show a steady flux behaviour, we obtain merely a 1.3 and 0.8 significance of null-hypothesis violation.
We conclude that in contrast to the nearby pulsars, the -ray source 2FGL J1045.05941 does show a significant degree of variability in the low-energy band. Detailed analysis shows that this is mainly because of the low flux values obtained for the most recent 12.5 months of our data sample. The mean flux for this period lies about a factor 1.7 below the mean flux of the remaining data sample. The nearby pulsars do not show this downward trend.
The corresponding cumulative TS-value evaluation for 2FGL J1045.05941 is shown in Figure 3, right. A non-variable source is expected to show a linear increase in the cumulative TS-value (Mattox et al. 1996) and deviations from that can be an indication of statistical fluctuations, stochastic flux variability, or periodic flux variation. In addition to minor deviations, the figure indicates an approximately linear rise in the cumulative TS-value for the first 22.5 months of 2FGL J1045.05941 data (blue dotted line). Then, however, the growth in TS decreases in correspondence to the lower flux values in Figure 3, left. Thus, the conclusions motivated by the light curve are reinforced by the cumulative TS evaluation.
3.3.2 Flux studies in the higher-energy band (10 to 300 GeV)
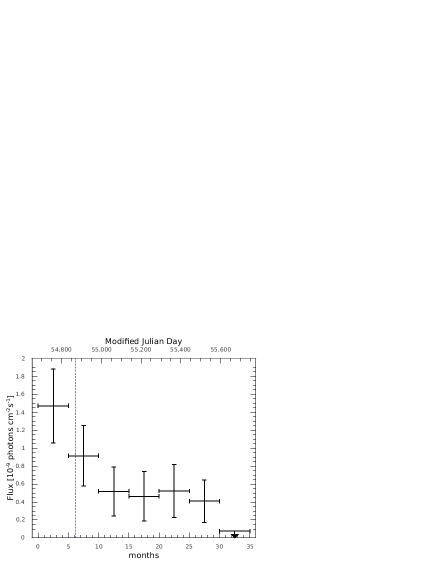
Figure 4 is the equivalent of Figure 3 for the energy regime between 10 and 300 GeV. Due to the lower statistics at higher energies, the time binning was increased from 2.5 to 5 months. The first two bins – representing the flux of the first ten months of -LAT observation - are about a factor of 2.5 higher than the following five bins. For the most recent five months only an upper limit could be obtained. A -test shows that a null-hypothesis of observing a constant flux can be rejected with 7.4 significance in favour of flux variability.
This conclusion is supported by the evaluation of the corresponding cumulative TS-values. Due to the cut-off spectra of the nearby pulsars there is no other source in the vicinity of 2FGL J1045.05941 that can serve for comparison in this energy interval. Yet, the behaviour of the TS-value is indicative of -ray variability: whereas the cumulative TS-value constantly rises seemingly linearly and steadily over the first ten months (blue dotted line), it flattens and turns over afterwards. A line connecting the origin of the graph and the last cumulative TS-value (green dashed line) would indicate steadily increasing detection significance over time and thus absence of flux variability. Because this is not the case, we have to conclude that the cumulative TS-curve is indicative of flux variability. However, this indication builds up only after the first ten months of data; after an initial period of constant flux, the -ray emission at energies 10 to 300 GeV begins to fade out.
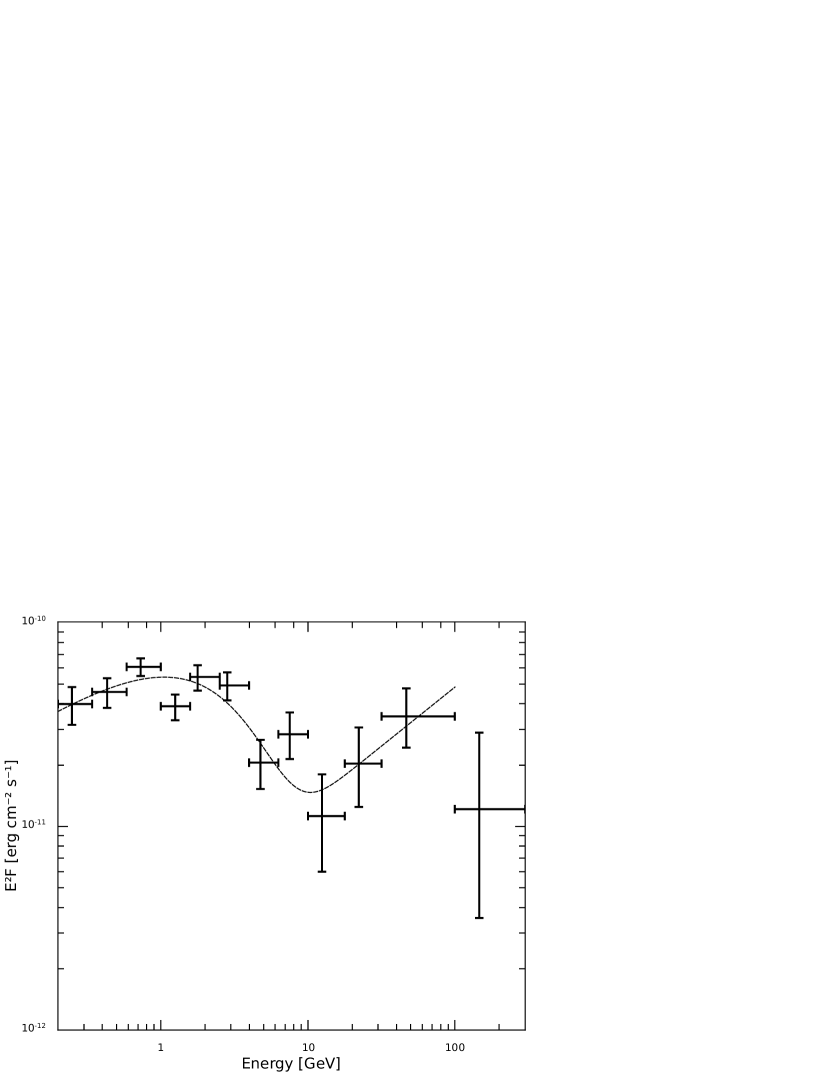
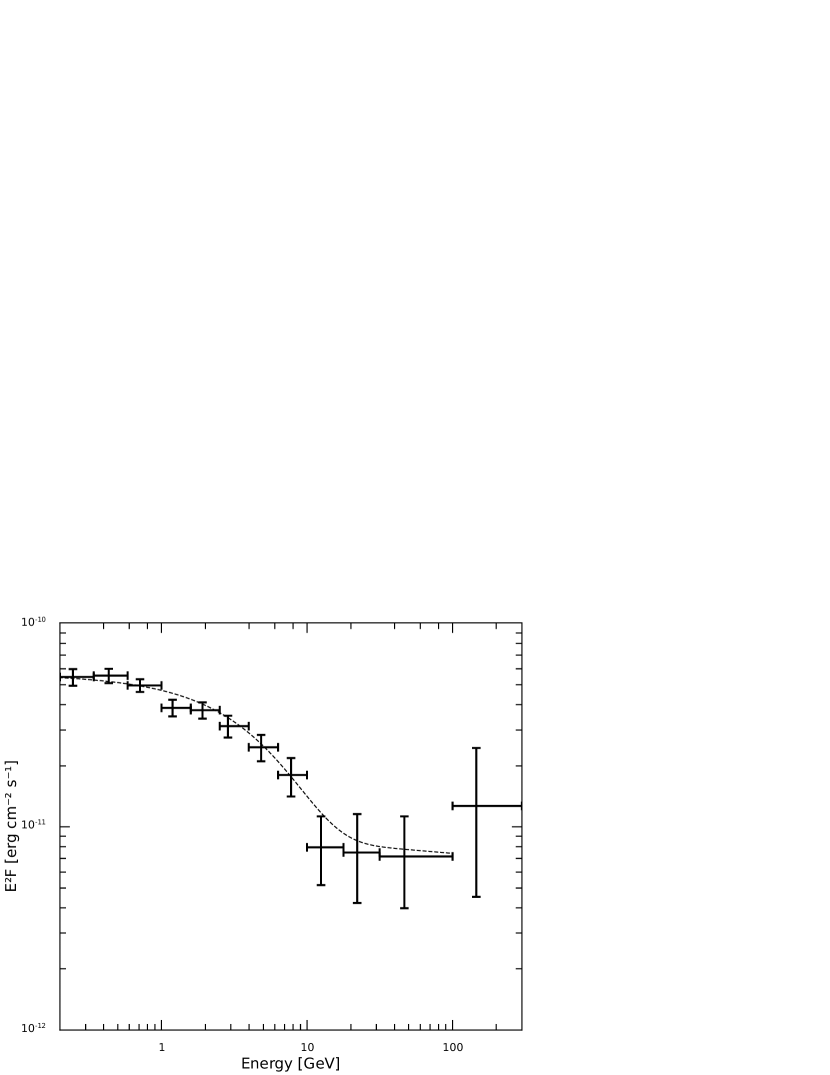
3.3.3 Spectral evolution
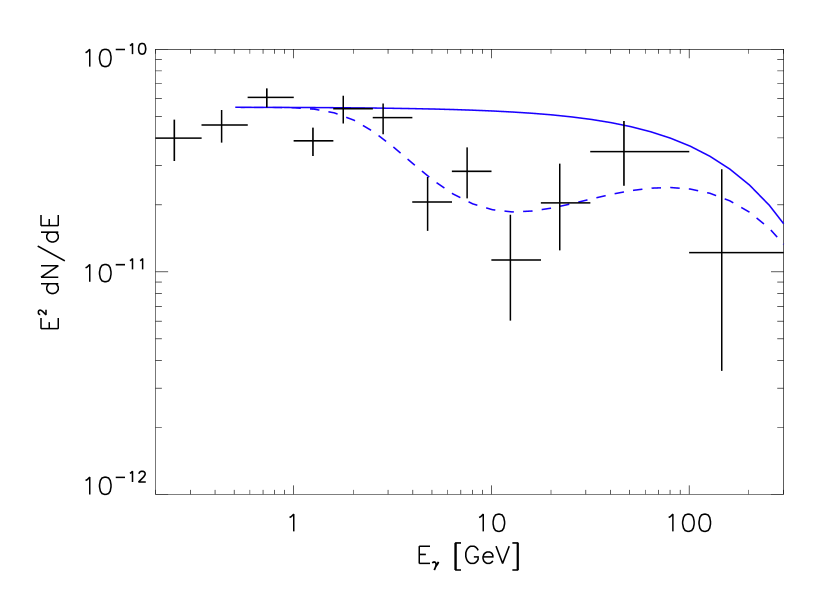
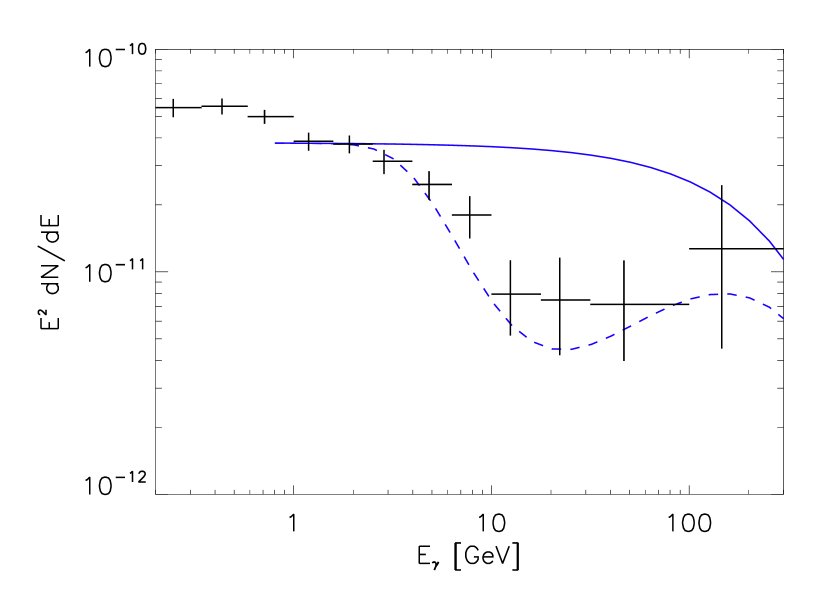
Figure 5 shows two SEDs (determined as in Section 3.2). The SED on the left represents the first ten months of our dataset for which an increased flux was observed at energies 10 to 300 GeV. The SED on the right covers the remaining 25 months. As suggested by Figure 4, the data points of the hard component appear to be systematically lower in the latter part of the data set. Similarly as in Section 3.2, a CPL+PL was fitted to the data for both time intervals using energies below 100 GeV. The most substantial change is to be seen in the high-energy PL component in which the index drops from =1.41 0.08 for the first ten months to =2.06 0.06 for the latter 25 months. Using the obtained spectral parameters to derive the integrated flux from 10 to 100 GeV (the contribution of both spectral functions are taken into account), we obtain F (1.2) 10-9 cm-2s-1 and F (0.49 0.05) 10-9 cm-2s-1, which implies a modulation by a factor of about 2.4. The difference in flux therefore agrees well with the findings of Section 3.3.2.
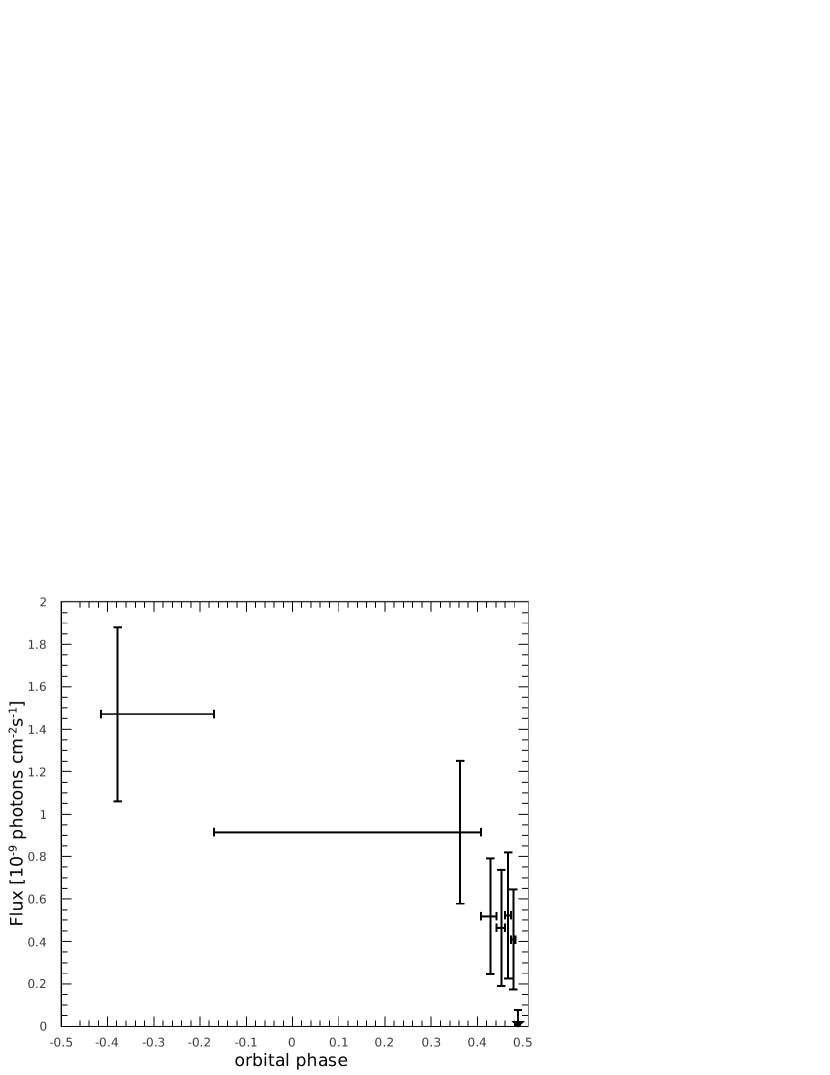
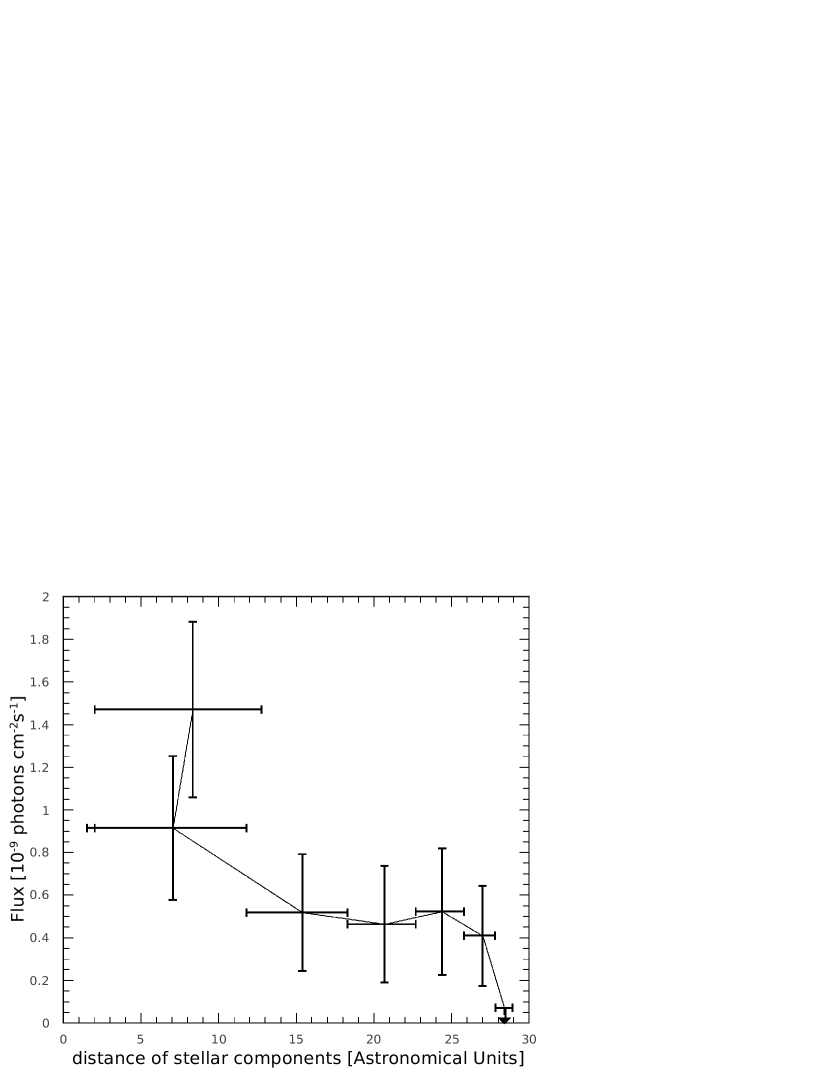
3.3.4 Connection to the orbit of the Car system
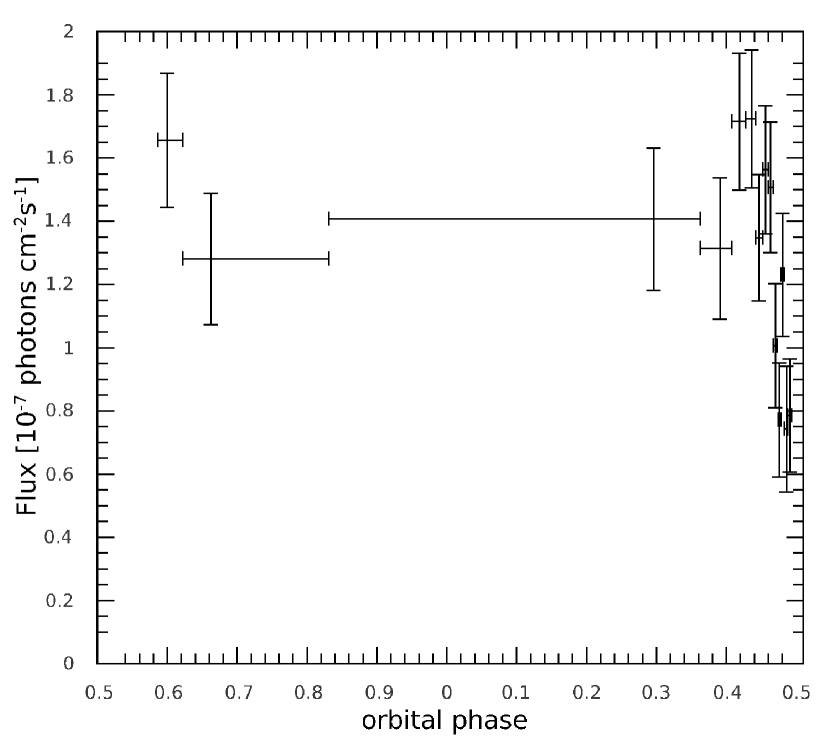
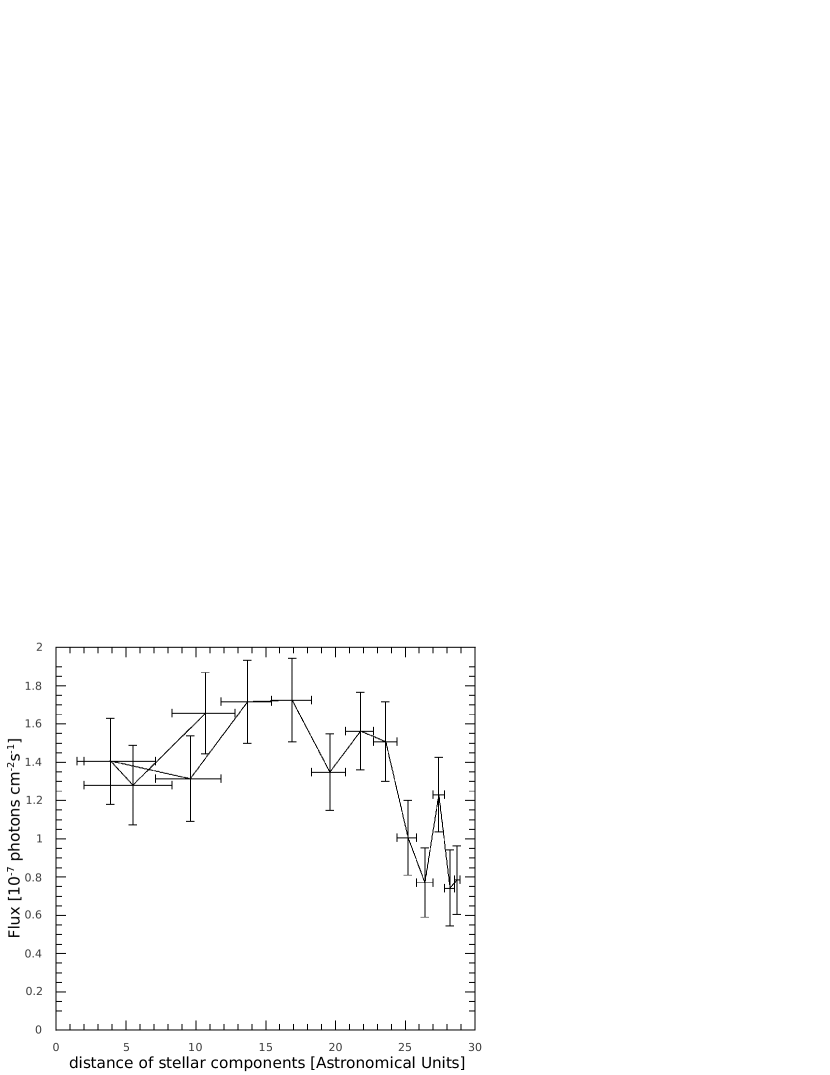
As indicated by the vertical line in Figure 4, the period of increased flux in the high-energy component (10 to 300 GeV) at the start of -LAT observations corresponds to the periastron passage of the Car binary system. To further illustrate this relation, Figure 6, left, shows the flux of 2FGL J1045.05941 at energies from 10 to 300 GeV over the orbital phase of Car. The periods of increased flux clearly correspond to orbital phases close to periastron. Figure 6, right, shows flux in relation to the physical distance of the two stellar components (ranging from 1.5 AU at periastron to 30 AU at apastron, which was reached by October 2011). The intervals of increased flux correspond to a time in which the separation of the stars is less than about 12 AU, with a flux maximum (bin 1) just prior to the periastron passage. Otherwise the data indicate a clear decrease in flux as the binary components approach apastron. The same is shown in Figure 7 for the low-energy component (0.2 to 10 GeV). In this case the flux decrease seems to commence later, with periods of lower flux corresponding to stellar separations of more than 25 AU.
4 Discussion and summary
As the analysis above has shown, we see a clear flux decrease in relation to the orbital state of Car. The decrease is significant at low- (0.2 to 10 GeV) as well as high- (10 to 300 GeV) energies, albeit showing a different time dependence (see above). In general, the observed flux decrease can be qualitatively understood with predictions in the framework of colliding-wind binary models for high-energy -ray emission (Reimer et al. 2006; Bednarek & Pabich 2011). As the stars move away from each other, the matter density – as well as the radiation density – decreases in the wind collision region where particle acceleration and subsequent -ray emission are thought to occur. Although the observed flux variation does not yet allow an unambiguous association, we consider in the following that the detected emission indeed arises from Car for reasons explained above.
Note that source modulations of the two spectral components at the same amplitude can be fully recovered for the two energy intervals only if the model used for the diffuse gamma-ray emission and for nearby point sources is perfect (e.g., without statistical and systematic uncertainties). Any realistic assessment of the backgrounds (e.g., for statistical fluctuation or, even more, systematic deviations between model and reality) will have an impact on the principal ability to recover source modulation. This will matter comparably less at higher energies due to the better signal-to-noise ratio. Hence, our inability to produce a perfect diffuse emission model principally limits our capability to recover variability in the low-energy component of Car.
The presence of phase-locked flux changes in any emission component refutes the idea of Ohm et al. (2010), who suggested that a -ray signal from Car can be related to particle acceleration in the expanding blast wave that originated in the great eruption of 1843 when the primary star (the LBV) ejected about 10% of its total mass in a massive outburst. Through shock interaction with the surrounding interstellar medium the blast wave that was created at that event might produce charged particles and subsequent -ray emission. In such an emission scenario one would not expect to see -ray flux variability in connection with the orbital configuration of the Car binary system.
Based on the observations with the LAT of two apparently distinct emission components, a model has been proposed (Farnier et al. 2011) to identify the low-energy component as due to inverse Compton scattering of Car’s photospheric photon field off a relativistic electron population extending up to 104 MeV, and the high-energy component above 10 GeV as due to hadronic interactions of a relativistic proton component extending up to 104 GeV with a high-density material in the shock region (enhanced by a factor 10 with respect to the unperturbed wind density). This requires electron and proton acceleration at maximum rate (Bohm diffusion regime) for values of the shock magnetic field in the sub-Gauss range. The target material and photospheric photon density at the shock location change with orbital phase as the inverse square of the distance between the shock and the LBV. Therefore, phase-locked orbital variations of both inverse Compton and hadronic components are expected unless the intensities of the putative accelerated particle populations change along the orbit such that it counteracts this trend. We stress here that both components are expected to vary significantly with the same amplitude for an isotropic target radiation field and no significant orbital variations in the accelerated electron-to-proton number densities. If anisotropy effects were considered, even larger variability amplitudes are expected in the inverse Compton component than in the hadronic component. Applied to the energy spectra determined for the first 10 months and the subsequent 25 months of LAT observations (see Figure 5) for which the mean stellar separation were 8 AU and 21.8 AU, respectively, the flux amplitude is expected to decrease from the first to the second time period by more than a factor 7 in both spectral components, possibly by an even greater factor for the leptonic component. The observed spectra, however, reveal flux variations in the high-energy component by a factor 2.5 while the low-energy component shows a rapid spectral decline at a few GeV with no indication for a phase dependence of the spectral shape, spectral index, or cutoff energy.
We note that the observed low variability of the low-energy -ray component with phase-locked variations of the high-energy component can be plausibly interpreted as inverse Compton scattering in the photospheric radiation field of Car and hadronic interactions with the wind material, respectively, if the accelerated electron number density is higher around apastron than periastron while at the same time the accelerated proton number density does not exhibit significant orbital variations.
Motivated by the peculiar shape of the measured spectra and the complex strong radiation fields in the vicinity of Car, we here consider yet another scenario. Photon-photon absorption has long been suspected to play a significant role in the dense radiation environments of massive stars. For instance, first indications of -ray absorption modulating a TeV spectrum have been reported from the -ray binary LS 5039 (Aharonian et al. 2005).
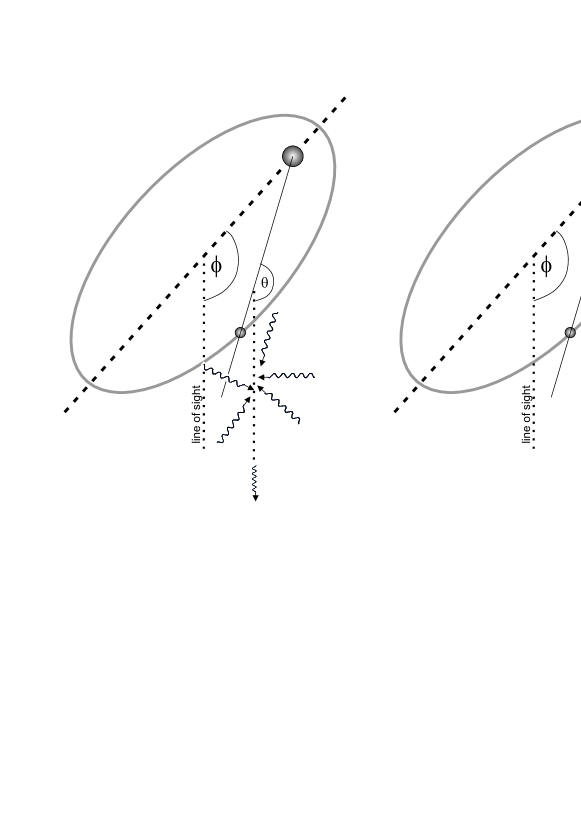
For Car, the observed -ray spectra can be well represented by a primary differential photon spectrum with GeV that suffers from -ray absorption in a black-body photon field (Gould & Schréder 1967) of effective temperature K (corresponding to target photon energies of eV at the maximum of the black-body radiation field) during the first ten months of observations, and decreases to K ( eV) during the subsequent 25 months (see Figure 8). The required maximum optical depths are and , corresponding to fluxes (at the distance of Car) of erg cm-2s-1 and erg cm-2s-1, respectively. Considering the total spectrum (35 months), the required black-body absorber has an effective temperature of K ( eV) and corresponding to a flux of erg cm-2s-1. In this scenario, a possible origin of the absorber could be hot X-ray gas, as observed recently by XMM-Newton and Chandra (e.g., Hamaguchi et al. 2007; Townsley et al. 2011). Both experiments revealed spatially extended, structured X-ray emission components that surround the binary system. Figure 9 (left) illustrates the geometry of such an external absorber scenario. The change of the LAT spectrum would indicate a slightly hotter rarefied plasma towards periastron than towards apastron.
In a second scenario the absorber could be linked to Car’s wind collision (e.g., hot shocked gas). In this case (see Figure 9 (right)) the angular dependence of the absorption coefficient and threshold energy on the photons’ collision angle has to be taken into account. The resulting optical depth therefore depends on the orientation of the wind collision region, the line of sight, and the stars of the Car binary system. For example, for a mean angular phase for the first 10 and subsequent 25 months of 0.973 and 0.422, respectively, and an inclination angle of and , the propagation angle (between the collision region and line of sight) for target photons impinging from the direction of Car is and , respectively. In this case we find satisfactory spectral representations for an absorber of temperature K and for the first 10 (see Figure 8, left), and K and for the latter 25 months (see Figure 8, right).
Orbitally modulated -ray emission up to TeV energies has been observed from a number of high-mass X-ray binary systems (see e.g., Hill et al. 2010) with orbital periods ranging from 3.4 years (PSR B125963) down to a few weeks or days (e.g., LSI +61 303, LS 5039). For the latter two systems, peak fluxes at MeV/GeV energies occur close to superior conjunction where the companion is behind the star (which also turns out to be close to periastron passage), while the flux decreases towards inferior conjunction/apastron. This behaviour is similar to the observed flux modulation in the spectrum of Car despite the lack of detection at VHE rays.
Ultimately, if one concludes that the observed decrease in -ray flux indeed relates to orbital conditions in the Carinae system, a prediction can be made for how the -ray flux will evolve until periastron is reached again. It is expected to remain at a low level until the end of 2013, when the flux should increase again and, ultimately, reach maximum shortly before the next periastron passage in mid-2014. The observation of this regular variability pattern will be a decisive test for current models of -ray emission in colliding-wind binary systems. Until then, we anticipate that numerical simulations will consider the multitude of details not yet taken into account in present -ray emission models (e.g., complexity in stellar radiation fields specific for the Car system and the Homunculus nebula). This will allow a quantitative comparison of model predictions to the observed -ray data over a full orbit.
5 Acknowledgements
Acknowledgements.
The Fermi LAT Collaboration acknowledges generous ongoing support from a number of agencies and institutes that have supported both the development and the operation of the LAT as well as scientific data analysis. These include the National Aeronautics and Space Administration and the Department of Energy in the United States, the Commissariat à l’Energie Atomique and the Centre National de la Recherche Scientifique / Institut National de Physique Nucléaire et de Physique des Particules in France, the Agenzia Spaziale Italiana and the Istituto Nazionale di Fisica Nucleare in Italy, the Ministry of Education, Culture, Sports, Science and Technology (MEXT), High Energy Accelerator Research Organization (KEK) and Japan Aerospace Exploration Agency (JAXA) in Japan, and the K. A. Wallenberg Foundation, the Swedish Research Council and the Swedish National Space Board in Sweden.Additional support for science analysis during the operations phase is gratefully acknowledged from the Istituto Nazionale di Astrofisica in Italy and the Centre National d’Études Spatiales in France.
The publication is supported by the Austrian Science Fund (FWF).
References
- Abdo et al. (2010a) Abdo, A. A., Ackermann, M., Ajello, M., et al. 2010a, ApJS, 188, 405
- Abdo et al. (2010b) Abdo, A. A., Ackermann, M., Ajello, M., et al. 2010b, ApJ, 723, 649
- Aharonian et al. (2005) Aharonian, F., Akhperjanian, A. G., Aye, K.-M., et al. 2005, Science, 309, 746
- Bednarek & Pabich (2011) Bednarek, W. & Pabich, J. 2011, A&A, 530, A49+
- Corcoran (2001) Corcoran, M. F. 2001, ApJ, 547, 1034
- Corcoran et al. (2005) Corcoran, M. F. et al. 2005, AJ, 129, 2018
- Damineli et al. (2008) Damineli, A. et al. 2008, MNRAS, 384, 1649
- Davidson & Humphreys (1997) Davidson, K. & Humphreys, R. M. 1997, ARA&A, 1
- Dougherty et al. (2003) Dougherty, S. M., Pittard, J. M., Kasian, L., et al. 2003, A&A, 409, 217
- Eichler & Usov (1993) Eichler, D. & Usov, V. 1993, ApJ, 402, 271
- Farnier et al. (2011) Farnier, C., Walter, R., & Leyder, J.-C. 2011, A&A, 526, A57+
- Gould & Schréder (1967) Gould, R. J. & Schréder, G. P. 1967, Physical Review, 155, 1408
- Hamaguchi et al. (2007) Hamaguchi, K., Corcoran, M. F., Gull, T., et al. 2007, ApJ, 663, 522
- HESS Collaboration et al. (2012) HESS Collaboration, Abramowski, A., et al. 2012, MNRAS, 424, 128
- Hill et al. (2010) Hill, A. B. et al. 2010, arXiv: 1008.4762
- Hillier et al. (2001) Hillier, D. J. et al. 2001, ApJ, 553, 837
- Leyder et al. (2008) Leyder, J.-C., Walter, R., & Rauw, G. 2008, A&A, 477, L29
- Mattox et al. (1996) Mattox, J. et al. 1996, ApJ, 461, 396
- Nolan et al. (2012) Nolan, P. L., Abdo, A. A., Ackermann, M., et al. 2012, ApJS, 199, 31
- Ohm et al. (2010) Ohm, S. et al. 2010, ApJ Letters, 718, L161
- Okazaki et al. (2008) Okazaki, R. et al. 2008, MNRAS Letters, 388, L39
- Parkin et al. (2009) Parkin, E. R. et al. 2009, MNRAS, 394, 1758
- Pittard & Corcoran (2002) Pittard, J. M. & Corcoran, M. 2002, A&A, 383, 636
- Reimer et al. (2006) Reimer, A. et al. 2006, MNRAS, 644, 1118
- Sekiguchi et al. (2009) Sekiguchi, A., Tsujimoto, M., Kitamoto, S., et al. 2009, PASJ, 61, 629
- Smith et al. (2004) Smith, N. et al. 2004, ApJ, 610, L105
- Tavani et al. (2009) Tavani, M. et al. 2009, ApJ Letters, 698, L142
- Townsley et al. (2011) Townsley, L. K. et al. 2011, ApJS, 194, 15
- Verner et al. (2005) Verner, E. et al. 2005, ApJ, 624, 973
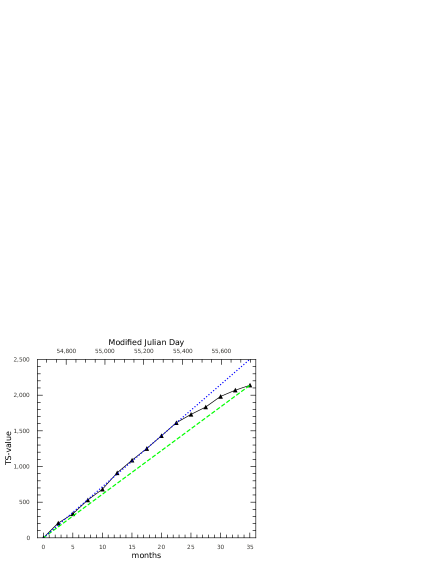
Right: Cumulative TS-value evaluation of 2FGL J1045.05941 as obtained by likelihood analysis in the 0.2 to 10 GeV energy band. Each data point represents the cumulative TS-value of the source for the time interval from the start of the -LAT data taking. The dotted blue line is a linear fit to the first nine data points. The dashed green line connects the origin and the cumulative TS-value obtained last.
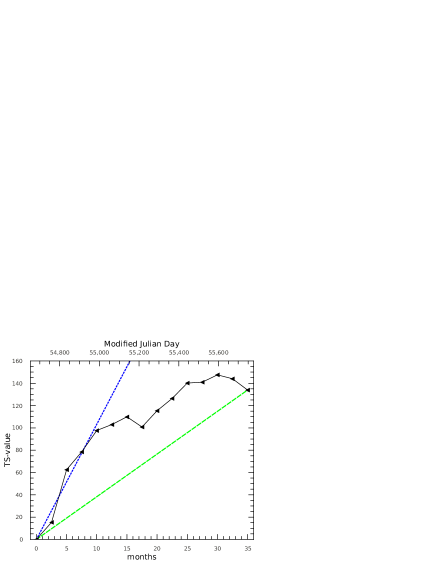
Right: Cumulative TS-value evaluation of 2FGL J1045.05941 as obtained by likelihood analysis in the 10 to 300 GeV energy band. Each data point represents the cumulative TS-value of the source for the time interval from the start of the -LAT data taking. The dotted blue line is a linear fit to the first four data points. The dashed green line connects the origin and the cumulative TS-value obtained last.