The magnetized medium around the radio galaxy B2 0755+37: an interaction with the intra-group gas
Abstract
We explore the magneto-ionic environment of the isolated radio galaxy B 2 0755+37 using detailed imaging of the distributions of Faraday rotation and depolarization over the radio source from Very Large Array observations at 1385, 1465 and 4860 MHz and new X-ray data from XMM-Newton. The Rotation Measure (RM) distribution is complex, with evidence for anisotropic fluctuations in two regions. The approaching lobe shows low and uniform RM in an unusual ‘stripe’ along an extension of the jet axis and a linear gradient transverse to this axis over its Northern half. The leading edge of the receding lobe shows arc-like RM structures with sign reversals. Elsewhere, the RM structures are reasonably isotropic. The RM power spectra are well described by cut-off power laws with slopes ranging from 2.1 to 3.2 in different sub-regions. The corresponding magnetic-field autocorrelation lengths, where well-determined, range from 0.25 to 1.4 kpc. There is little large-scale RM structure in the receding lobe, where the outer scale of the fluctuations is between 16 and 30 kpc. The variation of RM fluctuation amplitude across the source is inconsistent with that expected from a beta-model gas distribution fitted to our X-ray data, even allowing for cavities in the thermal gas associated with the radio lobes. It is likely that the fluctuations are mostly produced by compressed gas and field around the leading edges of the lobes. The X-ray count rate is too low to determine the density distribution around 0755+37 in sufficient detail to estimate the field strength accurately, but values of a few G are plausible. We identify areas of high depolarization around the jets and inner lobes. These could be produced by dense gas immediately surrounding the radio emission containing a magnetic field which is tangled on small scales. We also identify four ways in which the well known depolarization (Faraday depth) asymmetry between jetted and counter-jetted lobes of extended radio sources can be modified by interactions with the surrounding medium.
keywords:
– galaxies: magnetic fields – radio continuum: galaxies – (galaxies:) intergalactic medium – X-rays: galaxies: clusters1 Introduction
Radio continuum observations have detected magnetic fields at microGauss levels in galaxy disks and halos and in the intergalactic media of groups and clusters of galaxies. A detailed knowledge of the strength and structure of these fields is important to a better understanding of the physical processes in the gaseous environment of galaxies. The most direct proof of the presence of magnetic fields mixed with the intergalactic or intracluster medium (IGM/ICM) is provided by the detection of diffuse radio synchrotron emission on scales up to Mpc in galaxy clusters (see e.g. Ferrari et al. 2008 for a review). However, the Faraday effect (Faraday, 1846) across radio galaxies provides a more detailed picture of these magnetic fields.
This effect is the rotation of the plane of polarization of linearly polarized radiation traveling through a magnetized thermal plasma. Such a situation occurs for example when polarized radio galaxies are located behind or embedded in magnetized intergalactic media. The rotation of the E-vector position angle of linearly polarized radiation by a magnetized thermal plasma is given by:
| (1) |
where and are the -vector position angle of linearly polarized radiation observed at wavelength and the intrinsic angle, respectively. RM is the rotation measure. For a fully resolved foreground Faraday screen, the relation of Eq. 1 holds exactly at any observing wavelength. The RM can be expressed as:
| (2) |
where is the electron number density in the thermal plasma, is the magnetic field along the line-of-sight and is the integration path. for the units in equation 2.
Observations of Faraday rotation variations across extended radio galaxies, once corrected for the contribution from our Galaxy, allow us to derive information about the integral of the density-weighted line-of-sight field component. In several cases, the linearity of the relation between and over a range and the absence of depolarization at high angular resolution require that the majority of the material responsible for the variations must be in front of the synchrotron emission (e.g. Dreher et al. 1987; Laing et al. 2008; Guidetti et al. 2010); most observations of other sources are also consistent with pure foreground rotation. If the Faraday rotation is produced by hot thermal plasma, the density distribution can be derived from X-ray observations and the magnetic-field strength can be estimated. The main remaining uncertainties are the field topology and the geometry of the source and plasma.
There has been some controversy about the relative importance of Faraday rotation from material which has been affected by the radio galaxy (e.g. compressed by a bow-shock or entrained in a turbulent mixing layer) and the undisturbed intra-group or intra-cluster medium (e.g. Rudnick & Blundell 2003; Enßlin et al. 2003). Many of the published RM images of radio galaxies show patchy patterns without any obvious preferred direction in their iso-RM contours which might indicate a correlation with the source structure. In these cases, the hypothesis that the RM is dominated by the undisturbed hot component is self-consistent. Models in which the magnetic field is an isotropic, random variable with structure on a wide range of scales and with a strength that scales with density can fit the observations for reasonable source geometries (e.g. Murgia et al. 2004; Guidetti et al. 2008; Laing et al. 2008; Kuchar & Enßlin 2011; Guidetti et al. 2010). Three of the examples discussed in these references, Hydra A, 3C 31 and 3C 449, are central radio galaxies in groups or clusters with tailed radio morphologies.
In contrast, we have demonstrated unequivocally that the interaction between radio galaxies and their immediate environments can affect the magnetization of the plasma surrounding some lobed radio galaxies (Guidetti et al., 2011). These sources show areas of ordered rotation (‘RM bands’) with iso-RM contours orthogonal to the axes of the radio lobes. They are embedded in different environments, but all show evidence of strong interaction with the surrounding medium, either from brightness gradients at their leading edges or from cavities and shells of swept-up and compressed material observed in X-rays. Enhanced Faraday rotation should occur in the shocked plasma surrounding a radio lobe which is expanding supersonically and is indeed inferred to be present in Cygnus A (Carilli, Perley & Dreher, 1988). If the field in the undisturbed ambient plasma is disordered, then the Faraday rotation produced by the post-shock plasma will still appear patchy, as it does in the simulations by Huarte-Espinosa, Krause & Alexander (2011). The anisotropy of the RM bands was therefore unexpected: a two-dimensional magnetic field draped around the front end of the radio lobes is required to produce the observed structures (Guidetti et al., 2011).
Guidetti et al. (2011) also presented evidence for significant depolarization along the edges of the inner lobes in two sources, M 84 and 3C 270, coincident with shells of enhanced X-ray emission. There is little sign of associated large-scale variations of RM, and the most likely explanation is that the field is tangled on small scales.
The picture that emerges is that the magneto-ionic environments of radio galaxies are complex, potentially having at least three components: the undisturbed IGM/ICM; a region of enhanced density and (sometimes highly anisotropic) field around the leading edges of active lobes, and smaller-scale field fluctuations in denser thermal gas close to the nucleus.
In order to distinguish between these (and other) components, we need to image the Faraday rotation and depolarization at a large number of independent points with high signal-to-noise ratio, allowing us to estimate spatial statistics accurately, as well as to determine large-scale variations. Highly-polarized radio galaxies with large lobes are suitable targets, and in this paper we present observations of one of these: B2 0755+37111From now on we drop the B2., located at the centre of a nearby and very sparse group of galaxies. We have imaged the RM and depolarization over the radio source at two angular resolutions using high-quality VLA data in the 20 and 6 cm bands, revealing another good (but different) example of anisotropic RM structure. In this paper we give a detailed analysis of the RM fluctuations across the source. We also present new XMM-Newton X-ray observations and use them to characterize the hot gas associated with the galaxy group.
The paper is organized as follows. Section 2.1 summarizes the properties of the host galaxy and group and the main features of the polarized radio emission of 0755+37. In Section 2.2, we describe our new XMM-Newton observations and use them to derive the density profile and temperature of the group gas. Section 3 presents high-quality RM and depolarization images. The spatial statistics of RM are analysed using structure-function techniques and depolarization simulations in Section 3.3. Section 4 discusses the implications of our results for the interaction of the source with the surrounding magnetized medium. Finally, Section 5 summarizes our results.
2 0755+37 and its gaseous environment
2.1 Radio and optical properties
0755+37 is an extended FR I radio source (Fanaroff & Riley, 1974) whose optical counterpart, NGC 2484, is a D-galaxy with a redshift of 0.04284 (Falco et al., 1999). We assume a cosmology with = 71 km s-1Mpc-1, = 0.3, and = 0.7, implying that 1 arcsec corresponds to 0.833 kpc. The source is one of the most isolated radio galaxies in the B2 sample and is classified as the central member of a very poor group (Mulchaey et al., 2003).
The VLA observations in the 20 and 6 cm bands used in this paper were presented by Laing et al. (2011). At a resolution of 1.3 arcsec the source shows a very bright core and two-sided jets embedded in diffuse lobes of lower surface brightness. The jet East222We refer to the E (East) and W (West) radio lobes and jets, following Laing et al. (2011). of the nucleus is the brighter one and the inclination of the jets to the line of sight is estimated to be about 35∘ with the E side approaching (Bondi et al. 2000; Laing & Bridle, in preparation). Although the lobes resemble those in powerful FR II sources in morphology, spectral-index distribution and magnetic-field structure, they do not show evidence for hot-spots or shocks at the ends of the jets (Laing et al., 2011). The radio emission is highly polarized with the apparent magnetic field aligned perpendicular to the highest brightness gradients over both lobes.
2.2 XMM-Newton observations and X-ray properties
0755+37 was previously observed with the PSPC and HRI instruments on ROSAT (Worrall & Birkinshaw, 1994, 2000) and with Chandra (Worrall et al., 2001). The X-ray emission consists of thermal and non-thermal components, respectively associated with the hot medium on group and galactic scales, and with the core and brighter jet (Worrall & Birkinshaw, 2000; Worrall et al., 2001; Wu, Feng & Xinwu, 2007). The X-ray surface brightness profile for the thermal emission is spatially resolved and can be modelled as the superposition of two components: a dense, kpc-scale corona seen by Chandra (Worrall et al., 2001) and a much larger and more tenuous group atmosphere detected by the ROSAT PSPC (Worrall & Birkinshaw, 2000).
| Component | ref. | ||||
| keV | kpc | cm-3 | |||
| Corona | 0.84 | 1.7 | 9.9 10-2 | 0.8 | 1 |
| Group | 1.3 | 66 | 1.2 10-3 | 0.7 | 2 |
| References: | (1) Worrall et al. (2001) | ||||
| (2) Section 2.2 | |||||
0755+37 was observed with XMM-Newton on 2002 March 27 for ks. Unfortunately the observation was affected by high background levels, which meant that the EPIC pn data were unusable. The EPIC MOS data were processed in the standard manner using XMM-Newton SAS version 11.0, and the latest calibration files from the XMM-Newton website. The data were filtered according to the standard flag and pattern masks (PATTERN and #XMMEA_EM, excluding bad columns and rows). Good-time-interval (GTI) filtering was applied to remove periods of high background, which led to filtered exposure times of 51.3 and 50.0 ks for the MOS1 and MOS2 cameras, respectively. Images were extracted in the 0.5 – 5 keV energy range, and combined. They were not vignetting-corrected to minimize artefacts associated with the particle background. A confusing point source at RA 07h 58m 26s, Dec +37°46′26″(J2000), coincident to within XMM-Newton positional errors with a known quasar, was subtracted from the X-ray image.
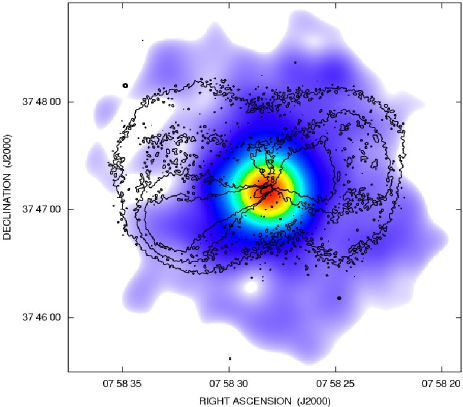
Fig. 1 shows an overlay of the XMM-Newton image smoothed with a Gaussian of 14.1 arcsec FWHM on contours of 1385-MHz emission at a resolution of 1.3 arcsec FWHM. The XMM-Newton image shows an apparent deficit in X-ray surface brightness associated with the Northern part of the E radio lobe. We investigated the significance of this feature by dividing the radio source into four quadrants (using the jet to define an axis) and found that the deficit is significant only at the 2 level. Detection of any cavities associated with the radio lobes would require significantly deeper X-ray imaging.
Spectral and spatial analysis were carried out on the filtered X-ray events files using the methods of Croston et al. (2008). These included double background subtraction using filter-wheel closed files to account for the particle contribution and local reference regions to model the Galactic and cosmic X-ray emission. Results were compared with those using a local background only in a restricted energy band (0.3 – 2.0 keV) to ensure that background contamination was not affecting our measurements.
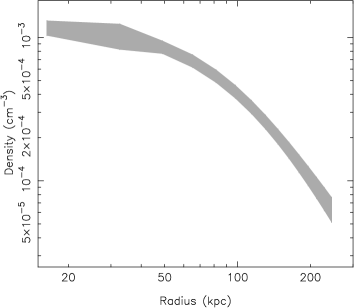
A global spectrum was obtained for an annular region between radii of 60 and 300 arcsec (excluding the central AGN). This was fit with an apec model. We found a best-fitting temperature of keV for a fixed abundance of 0.3 times solar. A surface brightness profile was extracted from the MOS1 and MOS2 datasets, and the combined profile was fit with a beta model convolved with the XMM-Newton point-source function using the Markov-Chain Monte Carlo fitting methods described in Goodger et al. (2012, an updated version of the method described in ). The emission from the nucleus, inner jet and corona all lie within the excluded inner circular region. The beta model parameters are individually poorly determined, with Bayesian estimates of and arcsec (66 kpc). Nevertheless, the density profile (shown in Fig. 2) is well constrained. We estimated the total (unabsorbed) bolometric luminosity to be erg s-1 by integration of the surface brightness profile. We cannot entirely rule out the possibility that the high particle background in this dataset has affected our temperature estimate; however, we believe that the group temperature is indeed higher than Worrall & Birkinshaw (2000)’s estimate of 0.73 keV. Our measured temperature is high for the group’s luminosity (e.g. based on the X-ray luminosity–temperature relations discussed in Croston et al. 2008), but within the scatter for other radio-loud groups. The value measured by Worrall & Birkinshaw (2000) is more consistent with the luminosity-temperature relationship for radio-quiet groups, which makes it slightly low compared to other radio-galaxy environments of similar luminosity. The density profile, which is of most importance for comparison with the rotation measure results, is not significantly affected by the uncertainty in temperature and our luminosity estimate is consistent with that of Worrall & Birkinshaw (2000).
3 Rotation measure and depolarization distributions
3.1 Rotation measure images
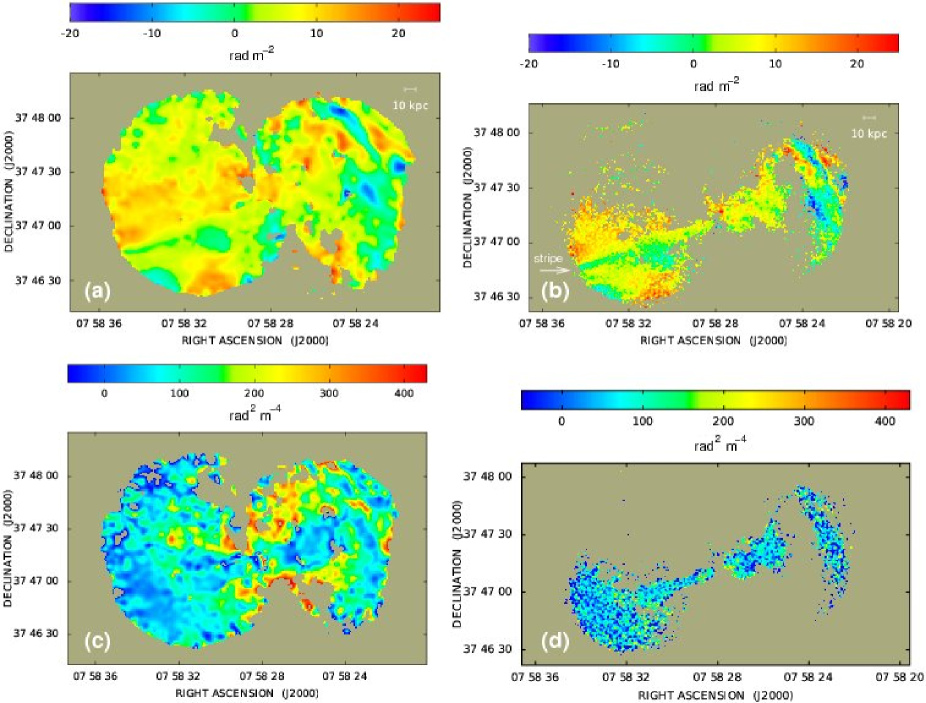
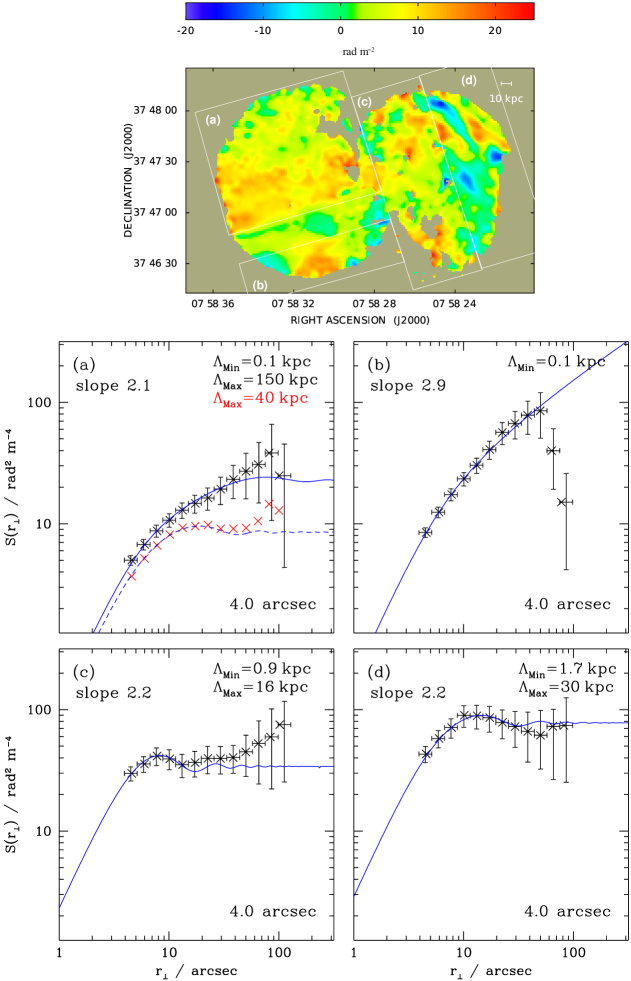
We produced images of RM and its rms error by weighted least-squares fitting to the polarization angle maps as a function of (Eq. 1) at frequencies of 1385.1, 1464.9 and 4860.1 MHz. The RM images were made at resolutions of 1.3 and 4.0 arcsec FWHM and calculated only at pixels with polarization angle uncertainties 10 ∘ at all frequencies. They are shown in Figs 3(a) and (b).
The fits are very good at both resolutions, showing no evidence for deviations from a law, although the total range of rotation is quite small. In what follows, we implicitly assume that there is no small-scale mixing of thermal and relativistic plasma, so that all of the observed Faraday rotation is due to foreground thermal material. This is consistent with our observations of 0755+37, but is not explicitly required by them. We argue by analogy with FR I sources in denser environments (for which foreground rotation is definitely required; e.g. Laing et al. 2008; Guidetti et al. 2010) that this is also the case for 0755+37.
At 4.0 arcsec resolution, the RM distribution has rad m-2 with = 4.9 rad m-2 and an average fitting error rad m-2. At 1.3 arcsec the mean RM is rad m-2 with =5.9 rad m-2 and rad m-2. The range in RM at the higher resolution is from to rad m-2.
In order to estimate the contribution from Galactic Faraday rotation, we used measurements of RM for compact sources selected from the NVSS Catalogue (Taylor, Stil & Sunstrum, 2009). The RM distribution for the 69 sources within a radius of 4∘ of 0755+37 is shown in Fig. 4. This has a well-defined peak centred on a small positive value. The median of the distribution is rad m-2 and the error-weighted mean is rad m-2. We adopt the former as the best available estimate of the Galactic RM.
The W lobe shows a higher average fluctuation level, with = 5.6 rad m-2 and = 6.6 rad m-2 at 4.0 and 1.3-arcsec resolutions, respectively. The equivalent numbers for the E lobe are = 4.1 rad m-2 and 4.9 rad m-2. Fig. 5 shows histograms of the RM distributions over the E and W lobes separately at the two resolutions. The larger range in the W lobe is evident.
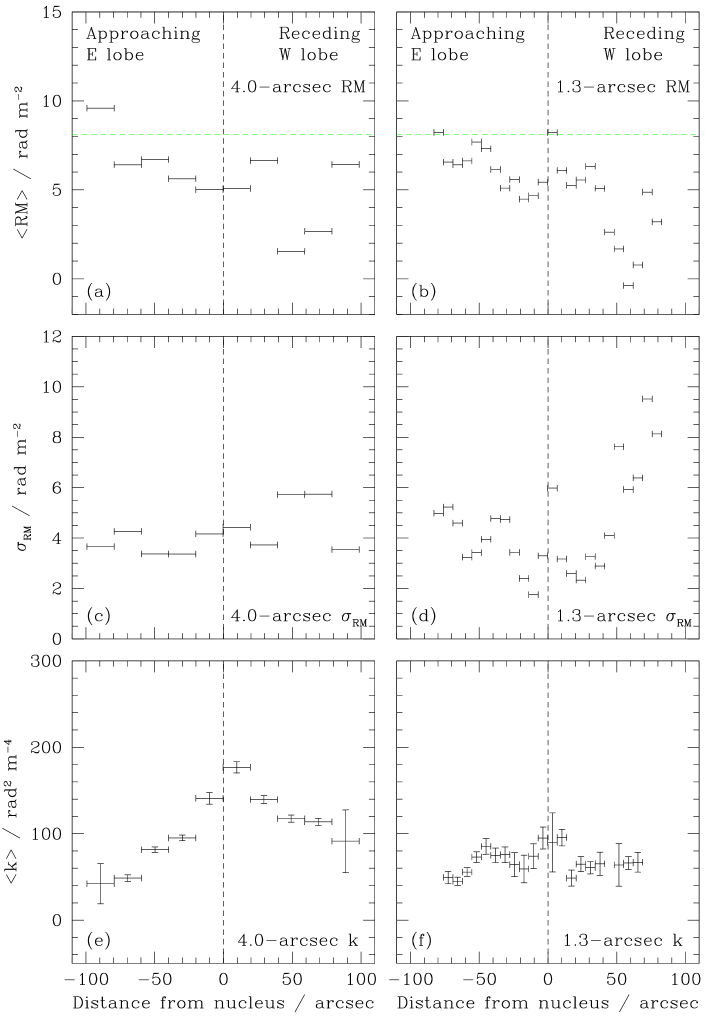
There is an asymmetry in RM structure between the E and W lobes at both resolutions. To a first approximation, the N part of the E (approaching) lobe is characterized by a smoothly-varying, positive RM whereas the S part of that lobe and the whole of the W lobe show irregular fluctuations. The largest RM fluctuations, of both signs, are at the end of the W lobe. Profiles of averaged in boxes along the source axis (taken to be in position angle ) at the two resolutions are shown in Figs 6(a) and (b). There is a trend to lower values of RM from E to W and the dispersion between the boxes is larger in the W lobe. The corresponding profiles of , corrected to first order for fitting error, are shown in Figs 6(c) and (d). There are three local maxima in the higher-resolution profile: at the outer edges of both lobes and close to the nucleus.


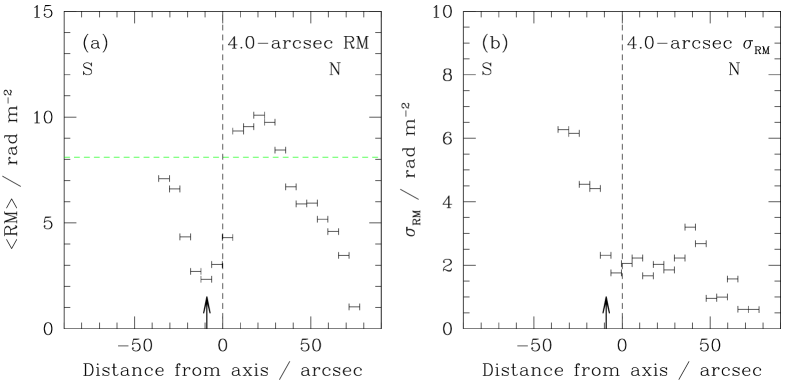
Profiles of and transverse to the source axis in the E lobe at 4.0-arcsec resolution are plotted in Fig. 7. The N half of the lobe is characterized by a linear gradient of and a low level of random fluctuation. decreases from rad m-2 on-axis to rad m-2 at the edge of the emission. In order to quantify this gradient, we fit the relevant portion of the RM image with a function of the form:
where is along the source axis increasing towards the nucleus (PA ) and orthogonal to it, increasing in PA . We found rad m-2 arcsec-1 and rad m-2 arcsec-1, so the direction of steepest gradient is in PA , not quite orthogonal to the source axis. The residual fluctuation levels before and after subtraction of the best-fitting linear gradient are 3.5 and 2.6 rad m-2 respectively, compared with a mean fitting error of 1.3 rad m-2.
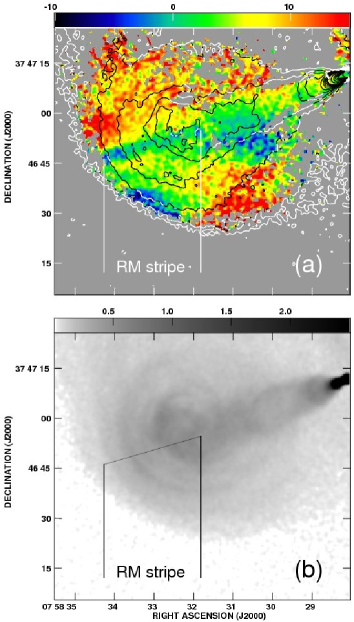
The area of smoothly-varying, positive RM in the E lobe is bounded by a thin, straight structure elongated parallel to the source axis with almost zero . This ‘stripe’ is striking at 1.3-arcsec resolution (Fig. 8a). It is almost but not quite aligned with the nucleus and lies along a continuation of the main jet axis. It starts just before the apparent termination of the jet and continues as far as the boundary of the lobe, in the process crossing the prominent circular ridges of emission (Fig. 8b). It does not obviously extend over the high-brightness emission of the E jet closer to the nucleus, although remains small there. Correction for the Galactic contribution implies that the intrinsic RM of the stripe is negative ( rad m-2). S of the stripe, again becomes positive, and the fluctuation level increases away from the source axis.
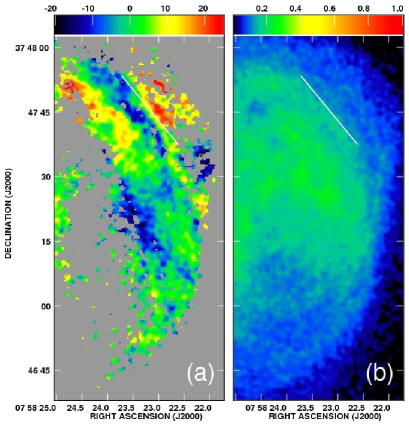
In contrast, the outer half of the W lobe has the highest level of RM fluctuations in the source. The iso-RM contours have a preferred direction in position angle 50∘, so the field responsible for the Faraday rotation cannot be isotropic. The clearest example of this anisotropy is the change in sign of RM at the prominent brightness step marked on Fig. 9. The RM fluctuations in this part of the source have alternating signs with respect to the Galactic value and must therefore be associated with field reversals. They resemble the RM bands discussed by Guidetti et al. (2011), but are neither as closely orthogonal to the source axis nor as well-defined as the clearest examples of bands.
3.2 Depolarization
We have chosen to parametrize the dependence of the degree of polarization on wavelength by the Burn law (Burn, 1966):
| (3) |
where is the intrinsic value of the degree of polarization. This expression is appropriate for well (but not fully) resolved foreground rotation: if the spatial variations of RM can be approximated as linear across the (Gaussian) beam, then the wavelength dependence of the depolarization is expected to follow the relation with =2 and (Laing et al., 2008). The position angle continues to obey the relation of Equation 1 in this approximation. Simulations of foreground rotation by magnetic fields with more complex power spectra (Laing et al., 2008) show that Equation 3 is a good approximation to the mean value of in the short-wavelength limit ().
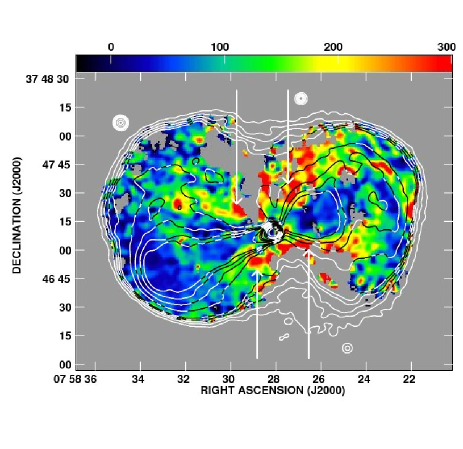
Equation 3 is consistent with our observations of 0755+37 and fitting to it allows us to include all three frequencies in the analysis. We therefore produced Burn law images at 4.0 and 1.3-arcsec resolution, just as for the RM, by fitting to the relation at all pixels with at all three frequencies. The Burn law maps are shown in Figs 3(c) and (d). At 4.0 and 1.3-arcsec resolutions, the mean values of are 108 rad2m-4 and 63 rad2m-4 respectively, corresponding to depolarizations and 0.87 at our lowest frequency. One obvious reason for this difference is that RM fluctuations on intermediate scales cause depolarization at the lower resolution: this is the primary effect in the brighter parts of the source. In addition, some of the low-surface-brightness emission, which can be detected in polarization only at 4.0-arcsec resolution, shows more rapid depolarization.
The most depolarized parts of the source are in the W lobe, in a V-shaped region with rad2m-4 on either side of the counter-jet. This is most clearly seen on Fig. 10, where the 4.0-arcsec image is superposed on contours of total intensity at the same resolution. There are also traces of a similar but less prominent structure in the W lobe, around the main jet. The cap of emission at the end of the W lobe is also more depolarized ( rad2m-4) than its eastern counterpart ( rad2m-4). The combination of these features leads to a marked asymmetry, illustrated by a longitudinal profile of averaged transverse to the source axis (Fig. 6e). rad2m-4 and 137 rad2m-4 for the whole of the E and W lobes, respectively.
We note that much of the depolarized emission is well inside the edges of the source and is resolved: i.e. the depolarization is not observed just at individual pixels at the boundaries of the emission where the signal to noise is low. In addition, simulations of our fitting procedure (Laing et al., 2008) confirm that our blanking criterion gives secure detections of depolarization with negligible bias, so we believe that even the high depolarizations seen at the edges of the source are real. There are many independent points with significant detections of high depolarization: for example, the depolarized region to the N of the counter-jet has 2000 pixels (40 independent beam areas). Over this region, the detection of depolarization is highly significant: rad2 m-4 compared with a mean error derived from the fits of 40 rad2 m-4. Finally, high depolarization is not observed close to the boundary of the E lobe, where it might be expected if it is an edge artefact. We are therefore confident in the reality of the highly depolarized regions.
At 1.3-arcsec resolution (Fig. 3d), only the jets and the caps of the two lobes have enough polarized emission to be imaged above the noise level at any of the three frequencies and we therefore cannot determine for the V-shaped regions around the jets. The cap of the W lobe has rad2m-4 compared with 109 rad2m-4 at 4.0-arcsec resolution, indicating that the depolarization at the lower resolution is partly due to fluctuations in RM on scales between 1 and 4 arcsec. There is much less difference between the values of for the cap of the E lobe: these are 45 and 42 rad2m-4, respectively at 4.0 and 1.3-arcsec resolution. The combination of these effects causes the longitudinal profile of at 1.3-arcsec resolution (Fig. 6f) to be much flatter and more symmetrical than the equivalent at lower resolution.
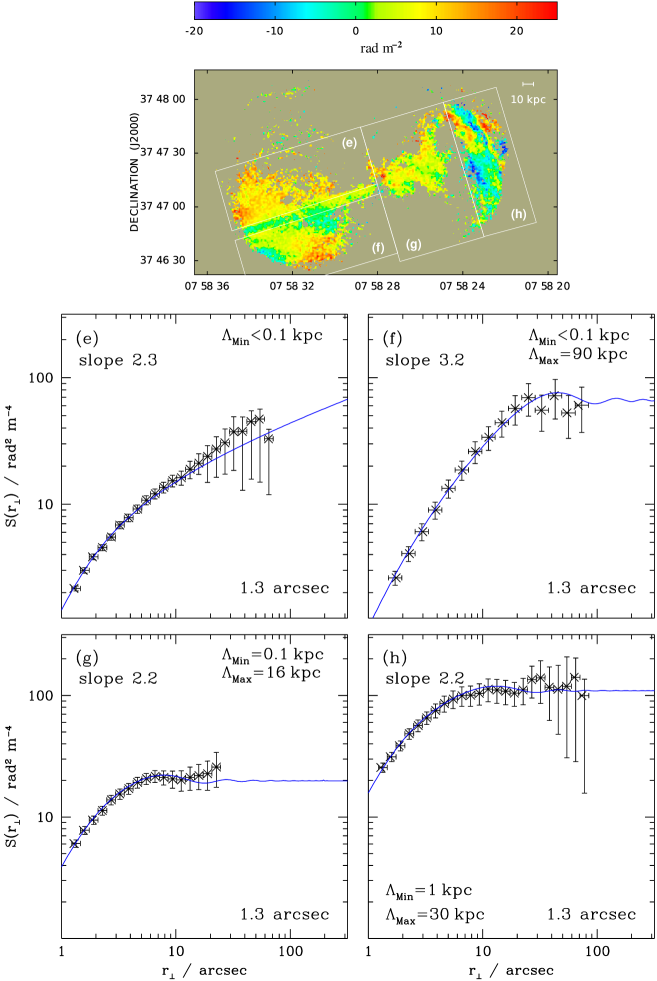
3.3 Structure functions
To quantify the two-dimensional fluctuations of Faraday rotation measure on scales larger than the observing beam, we used the RM structure function (Simonetti, Cordes & Spangler 1984; Minter & Spangler 1996) defined by:
| (4) |
where and are vectors in the plane of the sky and is an average over . The spatial statistics of a magnetic field which can be approximated as a Gaussian random variable are specified completely by the power spectrum of the field or, equivalently, by its Fourier transform (the autocorrelation function). If the thermal electron density is uniform, then the RM structure function can be used to infer the power spectrum of the magnetic field directly (Enßlin & Vogt, 2003; Laing et al., 2008). Even if these assumptions do not hold, the RM structure function provides a robust way of characterizing the fluctuations of field and density on different angular scales.
We computed RM structure functions at 4.0 and 1.3-arcsec resolution over the areas shown in the top panels of Fig. 11. These were chosen so that the characteristics of the RM fluctuations are fairly homogeneous over each sub-region, with enough independent points to determine reliable structure functions. The sub-regions a, b, c and d (4.0 arcsec) overlap with e, f, g and h (1.3 arcsec), respectively. More points are blanked at the higher resolution, so the precise selection of points is not the same. We have therefore not attempted joint fits to the structure functions at the two resolutions, but the parameters determined for corresponding sub-regions are in good agreement. Sub-regions a and e, covering the N part of the E lobe, were defined to border on but exclude the RM stripe; sub-regions b and f are positioned similarly in the S of the lobe. We applied a first-order correction for uncorrelated random noise by subtracting from the structure function and averaged in logarithmic separation bins. The results are plotted in Fig. 11.
We fit the observed structure functions using a Hankel-transform method (Laing et al., 2008). This exploits the fact that the observed RM image is closely approximated by the convolution of the true RM image with the observing beam provided that the wavelength is sufficiently small. In this case, the observed structure function (including the effects of the beam) can be derived straightforwardly for any assumed RM power spectrum. A cut-off power law (CPL) RM power spectrum:
| (5) | |||||
where is a scalar spatial frequency, gives model structure functions in good agreement with the data (Fig. 11). We then estimated the maximum frequency (minimum scale) by fixing these values and varying to find the best match to the mean value of for the region, also as described by Laing et al. (2008). Finally, we produced multiple realisations of RM distributions corresponding to the CPL model power spectrum on the observed grid, including the effects of the convolving beam, and calculated their structure functions. The rms of these structure functions gives an estimate of the error due to statistical fluctuations and is plotted as error bars attached to the observed points in Fig. 11, again as in Laing et al. (2008).
The best-fitting parameters are quoted for each sub-region separately in Table 2, together with the observed and predicted values of Burn law .
The RM fluctuations on large scales in the W lobe of 0755+37 are very weak. As a consequence, the slopes of the model power spectra are not well constrained, particularly at 4.0-arcsec resolution. The best-fitting values of the minimum frequency are 0.05 arcsec-1 close to the nucleus (regions c and g) and 0.03 arcsec-1 at larger distances (d and h). These correspond to outer scales of 16 and 30 kpc, respectively. The best-determined slopes are for the E lobe at 1.3-arcsec resolution, where for region e (N of the source axis) and for region f; the values for the overlapping regions a and b at 4.0-arcsec resolution are consistent with these, but with larger errors. The fitted outer scale for region a is 150 kpc, but most of the large-scale power is in the linear gradient. After removing this, the slope is unchanged, but the outer scale for the residual fluctuations drops to 40 kpc (Fig. 11a). Finally, there is no firm evidence for a long-wavelength cut-off in the power spectrum of regions a and e (the Southern part of the E lobe), but the sampling on scales 50 arcsec (40 kpc) is poor.
The maximum frequency can be chosen to make the predicted and observed values of Burn law consistent in all sub-regions except b, e and f (E lobe), where the former are too small for any choice of . In other words, an extrapolation of the RM power spectrum to higher spatial frequencies predicts too little power on scales 1 arcsec. This argues for an additional depolarizing component, as we discuss further in Section 4.3.
In Section 4.1, we predict the variation of across the source using a single-scale model. The appropriate scale to use is roughly the magnetic autocorrelation length (Murgia et al., 2004; Laing et al., 2008), which we therefore also give in Table 2. If no value of the minimum frequency could be determined from the structure function, we assumed arcsec, corresponding to separations slightly larger than the maximum in the data for the regions in question.
| Region | FWHM | ||||||
|---|---|---|---|---|---|---|---|
| [arcsec] | [arcsec-1] | [arcsec-1] | [rad2 m-4] | [rad2 m-4] | [arcsec] | ||
| a | 4.0 | 2.1 | 8.3 | 0.005 | 835 | 743 | 0.3 |
| 2.1 | 8.3 | 0.02 | 0.2 | ||||
| b | 2.9 | 8.3 | 993 | 253 | 3.5 | ||
| c | 2.2+0.8 | 8.3 | 0.05 | 1734 | 1645 | 1.0 | |
| d | 2.2+0.8 | 0.5 | 0.03 | 1203 | 1045 | 1.7 | |
| e | 1.3 | 2.3 | 8.3 | 564 | 145 | 0.5 | |
| f | 3.2 | 8.3 | 0.01 | 704 | 115 | 6.0 | |
| g | 2.2 | 8.3 | 0.05 | 705 | 555 | 0.8 | |
| h | 2.2 | 0.8 | 0.03 | 636 | 404 | 1.2 |
4 Discussion
Given the complexity of the RM distribution in 0755+37 and in particular its obvious lack of axisymmetry, we have not attempted to build a three-dimensional model (cf. Laing et al. 2008; Guidetti et al. 2010). Instead, we give a qualitative discussion. We first (Section 4.1) discuss the location and properties of the magnetized plasma responsible for the resolved fluctuations in RM, excluding the region to the N of the jet in the E lobe, to which we return in Section 4.2. The regions of enhanced depolarization around the jets are the subject of Section 4.3.
4.1 RM fluctuations
For 0755+37, the average value of (5.9 rad m-2 at 1.3-arcsec resolution) is comparable with that for NGC 315 (also a member of a sparse group; Laing et al. 2006) and significantly less than for 3C 31 and 3C 449, which are central galaxies in rich groups (Laing et al., 2008; Guidetti et al., 2010). In turn, much larger values are found for central radio galaxies in cool core clusters such as M 87, Hydra A and Cygnus A (Owen, Eilek & Keel, 1990; Taylor & Perley, 1993; Dreher et al., 1987). The observed correlation between and X-ray surface-brightness (Dolag et al., 2001; Dolag, 2006) implies a scaling between central field strength and density with ; 0755+37 is consistent with this relation. The existence of a correlation between and ambient density implies that the plasma surrounding the radio source generates the Faraday rotation, but does not differentiate models in which the dominant contribution is from undisturbed IGM at large distances from those in which compressed material close to the lobes is more important.
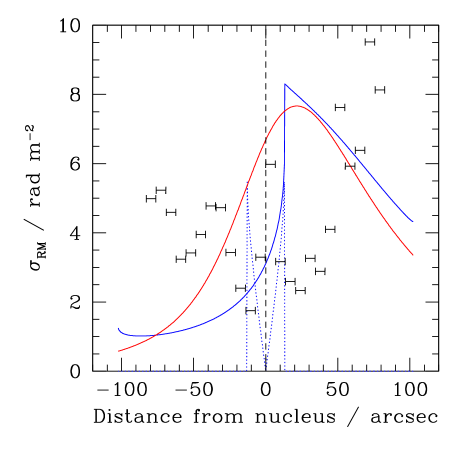
A model in which the plasma distribution is spherically symmetrical, with the field strength proportional to a power of the electron density, , determined from X-ray observations and a planar source model gives a good first approximation to the RM distribution expected from the undisturbed IGM. Such a model was applied successfully to fit the RM distribution of 3C 449 by Guidetti et al. (2010). Slightly more elaborate axisymmetric models in which thermal plasma is assumed to be excluded from cavities occupied by relativistic, radio-emitting electrons, can also fit the observed RM for 3C 31 and Hydra A (Laing et al., 2008; Kuchar & Enßlin, 2011). For 0755+37, neither type of model can fit the observed profiles adequately. In order to demonstrate this, we show RM profiles along the source axis derived using the single-scale approximation (Felten, 1996; Laing et al., 2008). The scale size is assumed to be 1 kpc (representative of the values in Table 2) and the electron density profile is for the group component in Table LABEL:ongoingX, scaled from the proton number density by the factor appropriate for a normal cosmic composition. The central field strengths ( and G respectively for the planar and cavity models) are set so that the maximum of the curve roughly matches the peak at the end of the W lobe. For a source modelled as a plane at an angle of 35∘ to the line of sight, the RM profile is peaked at 45 arcsec from the nucleus in the W lobe (Fig. 12; red curve) and decreases smoothly away from this point. In the more realistic model shown by the blue curve in Fig. 12, thermal plasma is excluded from the radio lobes (represented as ellipsoids). The profile in the receding (W) lobe is quite flat, while that for the approaching (E) lobe drops smoothly except for a slight rise close to the end of the source. The one-dimensional profiles are not strictly comparable with the observed results, which are averaged across the lobes and depend on sampling details, but are realistic enough to demonstrate a qualitative inconsistency: models in which the density and field strength decrease monotonically away from the nucleus cannot reproduce the peaks in at the ends of the lobes, and in particular the rapid rise at the extreme W of the source seen at 1.3-arcsec resolution (Fig. 12). The implication is that the observed RM is not dominated by the undisturbed group plasma surrounding the source, although this may contribute at the level of 2 – 3 rad m-2 (G). We have not included any prediction for the Faraday rotation due to the central corona of hot plasma associated with the host galaxy (Table LABEL:ongoingX), since this will be localized within a few arcseconds of the nucleus, but it may contribute to the observed peak in at 1.3-arcsec resolution (Fig. 12).
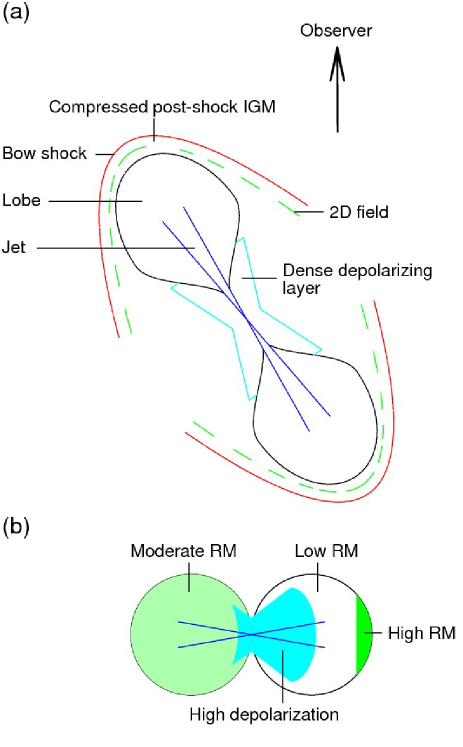
The most likely reason for the peaks in at the ends of the lobes is that the plasma immediately surrounding the fronts of the lobes has been compressed by a bow-shock driven by the expanding radio source and that the post-shock field has been both amplified and aligned in shells roughly parallel to the lobe surface. The geometry is sketched in Fig. 13. In this picture, the maximum fluctuation amplitude occurs close to the end of the receding lobe, where the magnetic field in the compressed IGM is preferentially aligned parallel to the line of sight and the path length is high. If the shock is weak or absent closer to the nucleus, then the remainder of the receding lobe will have low RM values, since the line of sight does not pass through any compressed IGM. In the approaching lobe, on the other hand, the compressed plasma covers a larger fraction of the lobe, but the path length is relatively low and the field is closer to the plane of the sky. We would therefore expect a moderate level of RM fluctuation over a larger fraction of the lobe. This picture is in at least qualitative agreement with the profiles of observed in 0755+37 (Figs 6c and d). Additional support for the idea comes from simulations of FR II sources evolving in an isotropically-magnetized ICM (Huarte-Espinosa et al., 2011, e.g. their Fig. 6), which show qualitatively similar RM distributions to those we observe for model sources at 45∘ to the line of sight. If we assume constant density and two-dimensional field tangling in a plane containing the line of sight, then the single-scale approximation gives , where is the scale size and is the path length. Normalizing to plausible values of , and , we find
At the leading edge of the W lobe, the RM fluctuations have rad m-2 and the appropriate scale size is kpc (Table 2, region h). For our fiducial path length and density, the field strength would be G. Unfortunately the XMM-Newton count levels in the outer parts of the 075537 group are too low to identify any shells of high density surrounding the leading edges of the lobes. A more sensitive X-ray observation would be required to search for enhancements associated with regions of high .
This simple picture is complicated by the evidence for a preferred direction in the RM distribution at the end of the W lobe (Fig. 9). As noted earlier, the anisotropic RM features resemble the ‘bands’ found in four other lobed sources (Guidetti et al., 2011). The straightness of the best-defined bands and their orthogonality to the source axis led Guidetti et al. (2011) to argue that they must be produced by two-dimensional magnetic fields draped around the leading edges of the lobes in the post-shock IGM, rather than by simple compression. It is more straightforward to produce shorter, misaligned arc-like RM features like those seen in 0755+37 by compression of an ordered pre-shock field (Guidetti et al., 2011, Fig.10), but generating reversals in RM is more problematic.
The conditions under which the RM and magnetic-field power spectra have the same form (i.e. that the density and path-length are uniform over an area large compared with the fluctuation scale and that the field can be taken to be an isotropic Gaussian random variable) are clearly not satisfied for 0755+37. We note, however, that all of the derived indices are relatively flat, with with in the range 2.1 to 3.2, as we have found for other sources (Laing et al., 2008; Guidetti et al., 2010, 2011) and that none of the well-constrained slopes are consistent with the Kolmogorov value of expected if the turbulence is hydrodynamic (Kolmogorov, 1941) or for an MHD cascade (Goldreich & Sridhar, 1997). One interesting possibility, consistent with the field geometry sketched in Fig. 13, is that the magnetic turbulence is closer to two-dimensional, in which case (Minter & Spangler, 1996). The range of outer scales we find from the RM structure functions for 0755+37 bracket the value of 65 kpc determined for the magnetic field power spectrum in 3C 449 by Guidetti et al. (2010). Their analysis includes the effects of large-scale spatial variations in density and field strength and is therefore more rigorous than we can attempt here. Further investigation of the spatial statistics of the field around 0755+37 would again require a much better understanding of the density distribution and geometry of the source.
4.2 Anomalous RM in the E lobe
The simple picture presented in Section 4.1 ignores the region with a linear RM gradient and low which forms the Northern part of the E lobe. There is a hint that this is associated with a deficit of surrounding plasma: the XMM-Newton image (Fig. 1) shows a lower level of X-ray emission coincident with this part of the lobe. As noted in Section 2.2, however, this feature is only significant at the 2 level. There is also some evidence from radio imaging for continuing, but less well collimated flow after the termination of the E jet. Images of the spectral index between 1385 and 4860 MHz (Laing et al., 2011, Figs 6e and f) show flat-spectrum (; ) emission extending due North from the end of the E jet to the Northern boundary of the lobe. It therefore seems possible that the flow deflects Northwards into a region of lower external density.
The ‘RM stripe’ (Fig. 8) appears to mark an abrupt boundary between fluctuating and ordered RM and lies close to a continuation of the jet axis (Fig. 1). Its RM is +2 rad m-2, significantly lower than our best estimate of the Galactic value ( +8 rad m-2). North of the stripe, the RM increases over a short distance to +10 rad m-2, the fluctuation amplitude suddenly drops and the smooth gradient in RM begins (Fig. 7). The nature of the stripe remains a mystery.
The origin of the RM gradient in 0755+37 is also obscure. The smoothness of the variation, together with the lack of small-scale fluctuations, argues that the field responsible for the Faraday rotation is well-ordered on scales of several tens of kpc and that the path length also varies slowly. A clear linear trend in RM is also seen over 700 arcsec (235 kpc at the source) along the jets of NGC 315, which is another source located in a sparse environment (Laing et al., 2006). This compares with 70 arcsec (58 kpc) for 0755+37. The lack of dependence on local gas density and the relatively large value of the Galactic RM led Laing et al. (2006) to argue that the gradient in NGC 315 is due to our Galaxy. Both of these arguments are much weaker for 0755+37, where the gradient (which in any case covers only part of the source) is over a much smaller angular scale and the absolute value of the Galactic contribution is a factor of 10 smaller. The component of the gradient parallel to the jets in NGC 315 is 0.075 rad m-2 kpc-1 at the source and the (much less well-determined) total value is 0.16 rad m-2 kpc-1. For 0755+37, the gradient, 0.14 rad m-2 kpc-1, is comparable in magnitude. It remains unclear whether the gradients in these two sources have similar origins. Comparable linear RM gradients in other sources might well be masked by larger fluctuation levels.
4.3 Depolarization
The high values of Burn law observed around the edges of both jets (particularly the W one) in 0755+37 are not associated with particularly large RM fluctuation amplitudes (Figs 3a and c). They appear to result from thermal plasma which introduces depolarization without much ordered Faraday rotation. We conjecture that there is a layer of dense thermal plasma, forming a rough hollow cone, immediately surrounding the jets and the inner lobes and containing a magnetic field with a small mean component and many reversals across the observing beam. This is the type of model described by Burn (1966, Eq. 21), which again has , but this time with zero RM in the limit of many reversals. The proposed geometry (sketched in Fig. 13) has the following implications.
-
1.
Emission from the inner parts of both lobes is affected by the dense depolarizing layer, but there is more depolarization in the half of the receding (W) lobe closer to the nucleus, primarily because a larger fraction of the lobe emission is seen through the dense, thermal plasma.
-
2.
There is a minimum in the depolarization on-axis (at the locations of the jets) since the path length is lower there than around the edges.
- 3.
-
4.
If this material is in a hollow cone, then , where is the distance from the core. The slow variation of with (Fig.3c) suggests that the product must decrease roughly .
-
5.
A typical value of rad2 m-4. This gives , where we have parametrized the unknown quantities by ratios to plausible values. and could be estimated from high-resolution X-ray observations.
Similar depolarized areas observed in M 84 and 3C 270 (Guidetti et al., 2011) are associated with dense, highly disturbed X-ray emitting plasma around the jets and inner lobes (Finoguenov et al., 2008; Worrall et al., 2010). We have searched for similar structures in our XMM-Newton image (Fig. 1) without success: the resolution is too low to distinguish them from the bright core, jet and corona in the centre of the source or from more diffuse emission on larger scales.
The excess of observed over predicted Burn law in sub-regions b, e and f of the E lobe (Table 2) may be due to the inclusion of emission seen through the depolarizing layer. In general, the presence of the layer makes it difficult to constrain the minimum scale of the medium responsible for larger-scale fluctuations in Faraday rotation where the two overlap and the values of given in Table 2 should be treated with caution.
4.4 Implications for the interpretation of depolarization asymmetry
It has been known for many years that the lobe containing the brighter (or only) jet is less depolarized than that on the counter-jet side for both FR I and FR II sources (Laing, 1988; Garrington et al., 1988, 1991; Morganti et al., 1997). This is interpreted straightforwardly as an orientation effect (Laing, 1988): if the jets are symmetrical and relativistic, then the approaching one will appear brighter as a result of Doppler beaming, and will also be seen through less Faraday-rotating material, resulting in lower depolarization or RM dispersion, depending on the resolution. The simplest models of the effect assume that the magnetized medium has spherical symmetry and the lobes have negligible depth (Garrington & Conway, 1991), but these approximations are not always adequate. The present study has prompted us to clarify the nature of the difference in Faraday depth between the approaching and receding sides for more realistic distributions of field and thermal plasma. For 0755+37, we have identified four different variants, as follows.
-
1.
Faraday rotation produced by a varying field in the undisturbed IGM surrounding the host galaxy will have a centrally-peaked profile. This is asymmetric unless the source is in the plane of the sky. We expect thermal plasma to be excluded from the radio lobes: if these occupy a significant volume, then the profile will be modified even if the external density and field are unaltered (e.g. as in Fig. 12; more realistic simulations are described by Laing et al. 2008).
-
2.
The IGM will be compressed by the expansion of the radio lobes, particularly if this is supersonic, in which case a bow shock forms. The strongest compression will be around the leading edges of the lobes. Components of an external field perpendicular to the shock will be amplified, leading to an anisotropic post-shock configuration. Faraday rotation produced by the shocked IGM will be higher for the receding lobe not only because the path is longer, but also because the field is on average closer to the line of sight. For some geometries, the largest RM fluctuations in the receding lobe will be restricted to a small area close to the end of the source (Fig. 13).
-
3.
The simple compression model cannot entirely explain the anisotropic RM structures seen in the receding lobe of 0755+37 and fails completely for sources showing RM bands across the full widths of their lobes. As pointed out by Guidetti et al. (2011), the bands require a two-dimensional ‘draped’ field configuration. It is not yet clear whether the amplitude of the bands is systematically lower for the approaching lobe, although this is the case for the one known example with a reasonably small angle to the line of sight, 0206+35 (Guidetti et al., 2011). If the effect is general, then the likely cause is a combination of differences in path length and field orientation through the draped-field region.
-
4.
There is enhanced depolarization associated with shells of denser thermal plasma around the inner lobes and jets of M 84 and 3C 270 (Guidetti et al., 2011) and we have suggested that this is also the case for 0755+37. There is little ordered Faraday rotation associated with the depolarization, indicating that the field has many reversals across the beam and/or that the plasma is clumped on small scales. Differential depolarization between the approaching and receding lobes is produced primarily because a larger fraction of emitting volume of the latter is seen through the depolarizing plasma (Fig. 13).
All four of these geometries produce more Faraday rotation of radiation from the receding lobe; which is dominant will depend on the type of radio source and the state of the thermal plasma associated with the galaxy and group or cluster.
5 Summary
We have derived detailed images of Faraday rotation measure (RM) and depolarization (quantified by fitting to a Burn law) at resolutions of 4.0 and 1.3 arcsec FWHM for the FR I radio galaxy 0755+37 from deep VLA observations at 1385, 1465 and 4860 MHz. The spatial statistics of the RM distributions have been investigated using a structure-function technique. We have also presented new XMM-Newton observations of X-ray emission from 0755+37.
The results of this analysis can be summarized as follows.
-
1.
The X-ray emission from hot gas on scales comparable with the size of the associated sparse group of galaxies can be fit by a beta model with central proton density cm-3, core radius 66 kpc, and temperature kT = 1.3 keV.
-
2.
The polarization position angles accurately follow a relation and the observed depolarization is low. This is consistent with Faraday rotation by foreground material, as found for many other sources, but the range of rotation is too small to require it in this particular case.
-
3.
The amplitude of the RM fluctuations in 0755+37 (= 5.9 rad m-2 averaged over the source) is smaller than for FR I sources embedded in rich groups of galaxies (Laing et al. 2008; Guidetti et al. 2010, 2011) and comparable with that in NGC 315, which is also in a sparse environment (Laing et al., 2006). This is consistent with the known correlation between gas density and (Dolag, 2006).
-
4.
There is an asymmetry in RM structure between the E (approaching) and W (receding) lobes: the N part of the E lobe is characterized by a positive RM with a linear gradient roughly transverse to the source axis whereas the S part of that lobe and the whole of the W lobe show irregular fluctuations. There is a hint that the linear gradient is associated with a lower external density.
-
5.
The boundary between smoothly-varying and patchy RM in the E lobe is marked by a narrow ‘stripe’ of low and constant RM. This is almost aligned with the jet axis. It covers the outer part of the jet, but also continues beyond the end of the jet to the edge of the lobe. Its cause is not understood.
-
6.
The largest RM fluctuations are at the end of the W (receding) lobe. They show reversals with respect to the Galactic value and are anisotropic, with iso-RM contours preferentially parallel to the edge of the lobe and to a prominent brightness step. The anisotropic features resemble RM bands (Guidetti et al., 2011).
-
7.
The distribution of cannot be explained by a model in which a tangled magnetic field is embedded in a spherically-symmetric distribution of external plasma, even if the effect of excluding the plasma from the radio lobes is taken into account. Instead, we suggest that the resolved Faraday-rotation fluctuations are dominated by compressed IGM around the ends of the lobes. Unfortunately, the X-ray surface brightness is too low for us to test for density enhancements directly. We point out that the magnetic field in the compressed plasma will be orientated preferentially along the line of sight in front of the receding lobe, contributing to the observed asymmetry in Faraday rotation. The geometry and density distribution cannot be determined well enough to allow us to estimate field strengths accurately, but values of a few G are plausible.
-
8.
The structure functions in different parts of the source can be fit assuming that the RM power spectra are cut-off power laws. The fits show that there is little power on spatial scales 16 – 30 kpc in the W lobe and 90 – 150 kpc in the E lobe. We find that the slopes of the power laws are in the range from 2.1 to 3.2 where they can be determined adequately, inconsistent with the value of 11/3 expected for Kolmogorov turbulence, but similar to estimates for other sources (e.g. Laing et al. 2008; Guidetti et al. 2010, 2011). The fitted minimum scales range from 1 kpc to 0.1 kpc.
-
9.
Excess depolarization is observed at the edges of both jets, particularly in the receding lobe. There is no obvious correlation with RM. We suggest that this is due to a layer of denser plasma around the jets and inner lobes with a magnetic field tangled on small scales.
The lack of symmetry in the source structure precludes three-dimensional modelling which, together with accurate estimation of field strengths, must await a more detailed understanding of the external density distribution. This requires more sensitive and higher-resolution X-ray observations.
Acknowledgements
We thank Martin Huarte-Espinosa and Martin Krause for useful clarifications of their work, Matteo Murgia for the use of the Synage package and Martin Hardcastle for use of his MCMC surface-brightness profile modelling software. RAL is grateful to INAF-IRA for hospitality. DG thanks Lorenzo for delaying his arrival until the completion of this work. The National Radio Astronomy Observatory is a facility of the National Science Foundation operated under cooperative agreement by Associated Universities, Inc. JHC would like to acknowledge support from the South East Physics Network (SEPNet).
References
- (1)
- Bondi et al. (2000) Bondi M., Parma P., de Ruiter H., Fanti R., Laing R.A., Fomalont E.B., 2000, MNRAS, 314, 11
- Burn (1966) Burn B.J., 1966, MNRAS, 133, 67
- Carilli et al. (1988) Carilli C.L., Perley R.A., Dreher J.H., 1988, ApJ, 334, L73
- Croston et al. (2008) Croston, J.H., Hardcastle, M.J., Birkinshaw, M., Worrall, D.M., Laing, R.A., 2008, MNRAS, 386, 1709
- Dolag (2006) Dolag K., 2006, Astronomische Nachrichten, 327, 575
- Dolag et al. (2001) Dolag K., Schindler S., Govoni F., Feretti L., 2001, A&A, 378, 777
- Dreher et al. (1987) Dreher J.W., Carilli C.L., Perley R.A., 1987, ApJ, 316, 611
- Enßlin & Vogt (2003) Enßlin T.A., Vogt C. 2003, A&A, 401, 835
- Enßlin et al. (2003) Enßlin T.A., Vogt C., Clarke T.E., Taylor G.B., 2003, ApJ, 597, 870
- Falco et al. (1999) Falco E.E., et al., 1999, PASP, 111, 438
- Fanaroff & Riley (1974) Fanaroff B.L., Riley J.M., 1974, MNRAS, 167, 31p
- Faraday (1846) Faraday M., 1846, Phil. Trans. R. Soc. Lond., 136, 1
- Felten (1996) Felten J.E., 1996, in Trimble V., Reisenegger A., eds, ASP Conf. Ser. 88, Clusters, Lensing and the future of the Universe, Astron. Soc. Pac., San Francisco, p. 271
- Ferrari et al. (2008) Ferrari C., Govoni F., Schindler S., Bykov A. M., Rephaeli Y., 2008, Space Sci. Rev., 134, 93
- Finoguenov et al. (2008) Finoguenov A., Ruszkowski M., Jones C., Brüggen M., Vikhlinin A., Mandel E., 2008, ApJ, 686, 911
- Garrington & Conway (1991) Garrington S.T., Conway R.G., 1991, MNRAS, 250, 158
- Garrington et al. (1991) Garrington S.T., Conway R.G., Leahy J.P., 1991, MNRAS, 250, 171
- Garrington et al. (1988) Garrington S.T., Leahy J.P., Conway R.G., Laing R.A., 1988, Nat, 331, 147
- Goldreich & Sridhar (1997) Goldreich P., Sridhar S., 1997, ApJ, 485, 680
- Goodger et al. (2012) Goodger J.L., et al., 2012, MNRAS, submitted
- Guidetti et al. (2008) Guidetti D., Murgia M., Govoni F., Parma P., Gregorini L., de Ruiter H.R., Cameron R.A., Fanti R., 2008, A&A, 483, 699
- Guidetti et al. (2010) Guidetti D., Laing R.A., Murgia M., Govoni F., Gregorini L., Parma P., 2010, A&A, 514, 50
- Guidetti et al. (2011) Guidetti D., Laing R.A., Bridle A.H., Parma P., Gregorini L., 2011, MNRAS, 413, 2525
- Huarte-Espinosa et al. (2011) Huarte-Espinosa M., Krause M., Alexander P., 2011, MNRAS, 418, 1621
- Kolmogorov (1941) Kolmogorov A.N., 1941, Dokl. Nauk. Acad. SSSR, 30, 301
- Kuchar & Enßlin (2011) Kuchar P., Enßlin T.A., 2011, A&A, 529, 13
- Laing (1988) Laing R.A., 1988, Nat, 331, 149
- Laing et al. (2006) Laing R.A., Canvin J.R., Cotton W.D., Bridle A.H., 2006, MNRAS, 368, 48
- Laing et al. (2008) Laing R.A., Bridle A.H., Parma P., Murgia M., 2008, MNRAS, 386, 657
- Laing et al. (2011) Laing R.A., Guidetti D., Bridle A.H., Parma P., Bondi M., 2011, MNRAS, 417, 2789
- Minter & Spangler (1996) Minter A.H., Spangler S.R., 1996, ApJ, 458, 194
- Morganti et al. (1997) Morganti R., Parma P., Capetti A., Fanti R., de Ruiter H.R., 1997, A&A, 326, 919
- Mulchaey et al. (2003) Mulchaey J.S., Davis D.S., Mushotzky R.F., Burstein D. 2003, ApJS, 145, 39
- Murgia et al. (2004) Murgia M., Govoni F., Feretti L., Giovannini G., Dallacasa D., Fanti R., Taylor G.B., Dolag K., 2004, A&A, 424, 429
- Owen, Eilek & Keel (1990) Owen F.N., Eilek J.A., Keel W.C., 1990, ApJ, 362, 449
- Rudnick & Blundell (2003) Rudnick L., Blundell K.M., 2003, ApJ, 588, 143
- Simonetti et al. (1984) Simonetti J.H., Cordes J.M., Spangler S.R., 1984, ApJ, 284, 126
- Taylor et al. (2009) Taylor A.R., Stil J.M., Sunstrum C., 2009, ApJ, 702 1230
- Taylor & Perley (1993) Taylor G.B., Perley, R.A., 1993, ApJ, 416, 554
- Worrall & Birkinshaw (1994) Worrall D.M., Birkinshaw M., 1994, ApJ, 427, 134
- Worrall & Birkinshaw (2000) Worrall D.M., Birkinshaw M., 2000, ApJ, 530, 719
- Worrall et al. (2001) Worrall D.M., Birkinshaw M., Hardcastle M.J., 2001, MNRAS, 326, 7
- Worrall et al. (2010) Worrall D.M., Birkinshaw M., O’Sullivan E., Zezas A., Wolter A., Trinchieri G., Fabbiano G., MNRAS, 2010, 408, 701
- Wu, Feng & Xinwu (2007) Wu Q., Yuan F., Cao X., 2007, ApJ, 669, 96