Post-AGB stars in the SMC as tracers of stellar evolution: the extreme s-process enrichment of the 21 m star J004441.04-732136.4. ††thanks: based on observations collected with the Very Large Telescope at the ESO Paranal Observatory (Chili) of programme number 084.D-0932.
Abstract
Context. This paper is part of a larger project in which we want to focus on the still poorly understood AGB third dredge-up processes and associated s-process nucleosynthesis.
Aims. We confront accurate spectral abundance analyses of post-AGB stars in both the LMC and SMC, to state-of-the-art AGB model predictions. With this comparison we aim at improving our understanding of the 3rd dredge-up phenomena and their dependencies on initial mass and metallicity.
Methods. Because of the well constrained distance with respect to Galactic post-AGB stars, we choose an extra-galactic post-AGB star for this contribution, namely the only known 21 m object of the Small Magellanic Cloud (SMC): J004441.04-732136.4 . We used optical UVES spectra to perform an accurate spectral abundance analysis. With photometric data of multiple catalogues we construct a spectral energy distribution and perform a variability analysis. The results are then compared to predictions of tailored theoretical chemical AGB evolutionary models for which we used two evolution codes.
Results. Spectral abundance results reveal J004441.04-732136.4 to be one of the most s-process enriched objects found up to date, while the photospheric C/O ratio of , shows the star is only modestly C-rich. J004441.04-732136.4 also displays a low = -1.34 0.32, which is significantly lower than the mean metallicity of the SMC. From the SED, a luminosity of is found, together with E(B-V) = 0.64 0.02. According to evolutionary post-AGB tracks, the initial mass should be . The photometric variability shows a clear period of 97.6 0.3 days. The detected C/O as well as the high s-process overabundances (e.g. [Y/Fe] = 2.15, [La/Fe] = 2.84) are hard to reconcile with the predictions. The chemical models also predict a high Pb abundance, which is not compatible with the detected spectrum, and a very high 12C/13C, which is not yet constrained by observations. The predictions are only marginally dependent on the evolution codes used.
Conclusions. By virtue of their spectral types, favourable bolometric corrections as well as their constrained distances, post-AGB stars in external galaxies offer unprecedented tests to AGB nucleosynthesis and dredge-up predictions. We focus here on one object J004441.04-732136.4, which is the only known 21 m source of the SMC. We show that our theoretical predictions match the s-process distribution, but fail in reproducing the detected high overabundances and predict a high Pb abundance which is not detected. Additionally, there remain serious problems in explaining the observed pulsational properties of this source.
Key Words.:
Stars: AGB and post-AGB - Stars: abundances - Stars: evolution - Stars: oscillations - Galaxies: Magellanic Clouds - Nuclear reactions, nucleosynthesis, abundances1 Introduction
The final evolution of low- and intermediate-mass stars is a fast transition from the Asymptotic Giant Branch (AGB) over the post-AGB transit towards the Planetary Nebula Phase (PN), before the stellar remnant cools down as a White Dwarf (WD). Although this scheme may be generally acknowledged, there is no understanding from first principles of different important physical processes that govern these evolutionary phases. The main shortcomings are related to the lack of understanding of the mass-loss mechanisms and mass-loss evolution along the AGB ascent, the subsequent shaping processes of the circumstellar shells, and the lack of fundamental understanding of the internal chemical evolution of these stars (Habing & Olofsson 2003; Herwig 2005).
Here we focus on the the poorly understood AGB 3rd dredge-up phenomenon, during which products of the internal nucleosynthesis are brought to the surface of the star. This is mainly 12C as the primary product of the triple alpha reaction, but also the products of neutron-capture synthesis. There are two main neutron sources in AGB stars: 1) the 22Ne(,n)25Mg reaction which is activated at temperatures of K, and 2) the 13C(,n)16O reaction, which is activated at much lower temperatures of K. Observational and theoretical evidence has shown that the 13C(,n)16O reaction is the main neutron source in low-mass AGB stars of (Straniero et al. 1995; Gallino et al. 1998; Abia et al. 2002).
Synthesis by the s-process in AGB stars is an important contributor to the cosmic abundances past the iron peak and these stars are also thought to be very important contributors to the total carbon and nitrogen enrichment (e.g. Romano et al. 2010; Kobayashi et al. 2011). Post-AGB photospheres bear witness to the total chemical changes accumulated during the stellar lifetime.
In recent years, theoretical models of these internal nucleosynthesis and photospheric enrichment processes gained enormously in sophistication: extensive nuclear networks with updated cross-sections were included (e.g. Cristallo et al. 2011, 2009; Karakas 2010; Church et al. 2009); non-convective mixing such as differential rotation and thermohaline mixing have been implemented (e.g. Siess et al. 2003; Siess 2007; Stancliffe et al. 2007; Angelou et al. 2011); the effect of deep mixing or extra mixing processes have been critically evaluated (e.g. Karakas et al. 2010; Busso et al. 2010) and overshoot regimes have been explored in more detail in order to explain the extent of the 13C pocket (Herwig 2005). All these processes involve great uncertainties and observational data are required to calibrate them.
Accurate determination of photospheric abundances in AGB stars is difficult (e.g. Abia et al. 2008, and references therein). First of all, the photosphere is dominated by molecular opacity, making the mere detection of trace elements over a wide range of atomic masses difficult. Moreover, AGB stars often have dynamic atmospheres caused by pulsations which develop into dust driven winds. Finally, chemical results of AGB stars are difficult to interpret, because stars with different initial mass and metallicity occupy the same region in the HR-diagram.
Post-AGB stars do not have these drawbacks: First, their atmospheres do not show the large amplitude pulsations as well as the large mass-loss rates that characterise evolved AGB atmospheres. Second, their photospheres are hotter, so atomic transitions prevail. This allows to quantify the abundances in post-AGB stars for a very wide range of elements, from CNO up to the most heavy s-process elements, well beyond the Ba peak (e.g. Van Winckel & Reyniers 2000; Reyniers & Van Winckel 2003).
During the past decade it has been realised that Galactic post-AGB stars are chemically much more diverse than anticipated (e.g. Van Winckel 2003). Some post-AGB stars are indeed the most s-process enriched objects known to date (e.g. Reyniers et al. 2004), while others are not enriched at all. A distinct subclass of Galactic post-AGB stars is formed by the so-called 21 m objects displaying a strong solid-state feature around 21 m (Kwok et al. 1989) in their IR spectra. The carrier of this feature still needs to be identified, although several suggestions have been discussed in literature (e.g. Posch et al. 2004). The feature is only detected in post-AGB Carbon stars (e.g. Hrivnak et al. 2008, 2009) and till now not yet in spectra of normal carbon stars nor in carbon-rich planetary nebula (Volk et al. 2011). The chemical studies of Galactic 21 m stars show that they display strong overabundances of s-process elements with a wide range of neutron capture efficiencies (Van Winckel & Reyniers 2000; Reddy et al. 2002; Reyniers & Van Winckel 2003; Reyniers et al. 2004). The poorly known distances and hence luminosities and masses of the limited Galactic post-AGB sample hamper, however, the interpretation of the variety of abundances in the broader theoretical context of stellar (chemical) evolution.
We therefore initiated a project to exploit our newly identified large sample of post-AGB stars in the Large Magellanic Cloud (van Aarle et al. 2011) and in the Small Magellanic Cloud (Kamath et al. 2011), to study the s-process production and associated 3rd-dredge-up processes. The unique spectral characteristics of post-AGB stars, together with the new large sample, covering a wide range in luminosities and metallicities, with well constrained distances, means that these objects provide unprecedented direct tests for the theoretical structure and enrichment models of solar-mass stars. In this contribution, we focus on the object J004441.04-732136.4 (hereafter abbreviated to J004441.04) which is the only object of the Small Magellanic Cloud (SMC) known to date in which the 21m feature is identified (Volk et al. 2011). The paper is organised as follows: In Sect. 2 we discuss the observational data of J004441.04. Sect. 3 describes the spectral analyses performed to determine the atmospheric parameters as well as the accurate photospheric composition. The spectral energy distribution (SED) of J004441.04 is analysed in Sect. 4 followed by the determination of the initial mass in Sect. 5. We then used two state-of-the-art evolution codes coupled to post-processing codes to compute the predicted chemical signature of this object in Sect. 6. The discussion and conclusions are given in Sect. 7.
2 Data
2.1 Photometric data
Photometric data from the Magellanic Cloud Photometric Survey (MCPS, Zaritsky et al. (2002)), the Deep Near-Infrared Survey (DENIS, Fouqué et al. (2000)), 2MASS (Cutri et al. 2003) and the Spitzer S3MC survey (Bolatto et al. 2007) are used for the construction of the SED of J004441.04 in Sect. 4. A summary of the absolute photometric datapoints is given in Table 1. The MCPS, 2MASS and DENIS data were taken in a timespan of 2 years (1997 till 1999) while the Spitzer data were acquired in 2004 and 2005. For the variability analysis, we used the OGLE II lightcurve (Szymanski 2005; Udalski et al. 1997) obtained in the I filter.
2.2 Spectroscopic data
We use high-resolution spectra obtained with the UVES spectrograph (Dekker et al. 2000), which is the echelle spectrograph mounted on the 8m UT2 Kueyen Telescope of the VLT array at the Paranal Observatory of ESO in Chili. Multiple spectra of J004441.04 were obtained on the same day within a time span of approximately two hours. We used the dichroic beam-splitter resulting in a wavelength coverage from approximately 3280 to 4530 Å for the blue arm of UVES, and from approximately 4780 to 5770 Å and from 5800 to 6810 Å for the lower and upper part of the mosaic CCD chip respectively. Each wavelength range was observed three times with an exposure time of 2871 seconds each.
The UVES reduction pipeline was used for the reduction of the spectra. This includes the standard steps of extracting frames, determining wavelength calibration and applying this scale to flat-field divided data. Also cosmic clipping was included in the reduction.
All spectra were normalised by fitting in small spectral windows, fifth order polynomials through interactively defined continuum points. Once all three subspectra of the same wavelength range are normalised, the weighted mean subspectrum was determined. These mean subspectra are then again merged into one normalised spectrum and this is used for the spectral abundance determination.
Unfortunately, the S/N is too poor for a large part of the blue spectrum (wavelength range 3280 to 4200 Å) making these wavelength ranges unusable for an accurate spectral abundance analysis hence they are not used for the study of J004441.04. Except for these bluer wavelength ranges, an overall S/N around 100 is obtained.
| band | survey | mag | (Jy) |
|---|---|---|---|
| V | MCPS | 15.96 | 1.573 |
| I | MCPS | 14.46 | 5.635 |
| DENIS | 14.44 | 4.260 | |
| J | DENIS | 13.62 | 6.310 |
| K | DENIS | 12.94 | 4.194 |
| J | 2MASS | 13.63 | 5.635 |
| H | 2MASS | 13.23 | 5.216 |
| 2MASS | 13.02 | 4.128 | |
| IRAC | 12.33 | 3.976 | |
| IRAC | 11.90 | 3.434 | |
| IRAC | 10.39 | 1.010 | |
| IRAC | 8.344 | 3.459 | |
| MIPS | 5.141 | 5.998 |
3 Spectral analyses
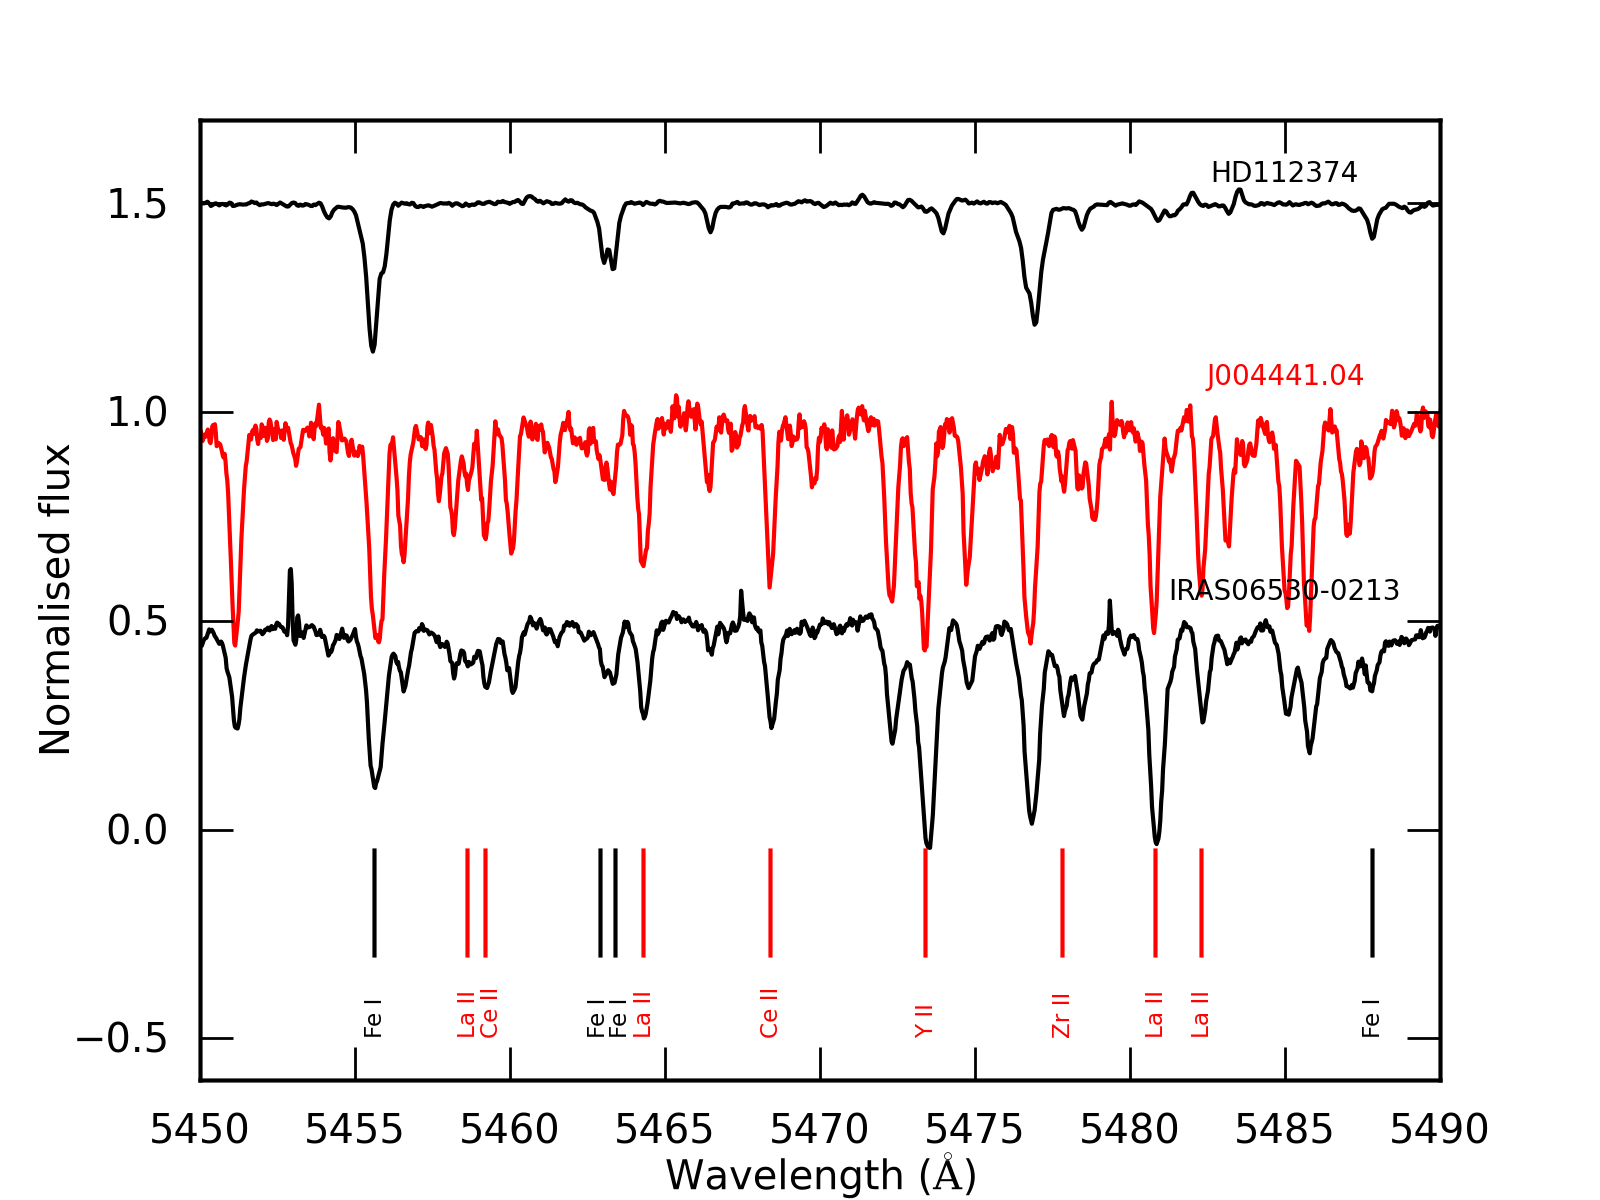
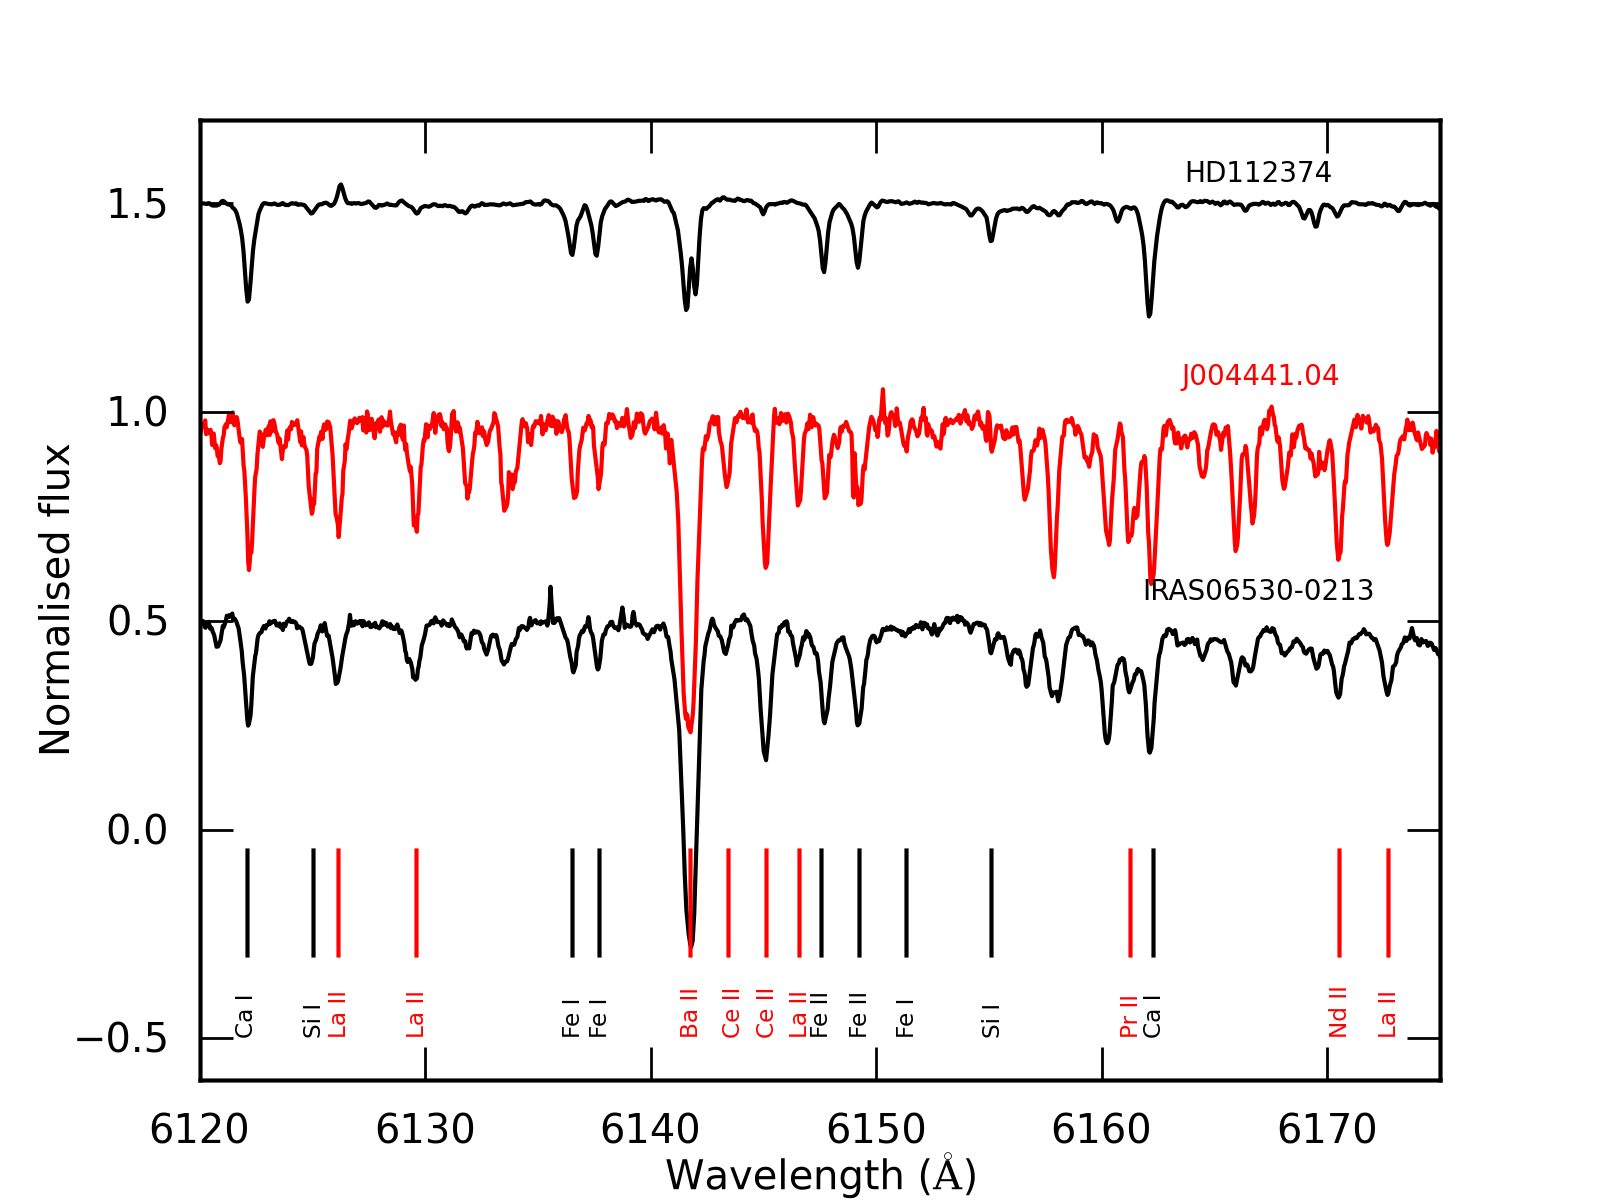
It is useful to compare the spectrum of J004441.04 with Galactic post-AGB stars. In Fig. 2 and 3 we compare a small spectral part of J004441.04 with the same spectral range of two Galactic post-AGB stars. The lower spectrum is from the Galactic post-AGB star IRAS06530-0213 (hereafter abbreviated to IRAS06530). This is a post-AGB star with a metallicity of = -0.46 and = 7250 K and it is recognised to be the star with the highest s-process overabundances known to date (Reyniers et al. 2004). The upper spectrum is from the non-enriched Galactic star HD112374 = HR 4912 (Lambert et al. 1983; Giridhar et al. 1997). This star has a similar spectral type and a metallicity of [Fe/H]=1.1. The normalised spectra are brought to the same velocity scale and offset for clarity. Red and black vertical lines mark positions of s-nuclei and non s-nuclei respectively. It is remarkable that the spectra of J004441.04 are very similar to IRAS06530-0213 which illustrates its high s-process overabundance. We therefore choose the used line list of IRAS06530 in Reyniers et al. (2004) for quantified relative spectral analyses.
3.1 General methods
Both the atmospheric parameter determination and the abundance determination are performed using the same routines. The local thermal equilibrium (LTE) Kurucz-Castelli atmosphere models (Castelli & Kurucz 2004) are used in combination with the LTE abundance calculation routine MOOG (version July 2009) by C. Sneden (1973). Non-LTE effects are not taken into account for the spectral analyses of J004441.04.
The equivalent width (EW) of lines are measured via direct integration and abundances are computed by an iterative process in which the theoretical EWs of single lines are computed for a given abundance and matched to the observed EWs. Blended lines are avoided as much as possible. To check whether lines are part of blends with other identified lines, synthetic spectra are modelled with MOOG using VALD linelists (Kupka et al. 1999) and compared to the stellar spectra.
In order to identify lines, the radial velocity of J004441.04 is estimated by fitting a Gaussian curve to a number of identified atomic lines to determine their central wavelength. Using the equation of the Doppler shift, this results in a heliocentric radial velocity v = 148 3 km/s which is accurate enough for line identification purposes. The useful line identification tool of Lobel (2006) was used for the first identifications. The heliocentric radial velocity of the SMC is in average 160 km/s (Richter et al. 1987) and the velocity of J004441.04 confirms the membership of the SMC.
3.2 Atmospheric parameter determination
The atmospheric parameters are derived using Fe I and Fe II lines and the standard spectroscopic methods: the effective temperature is derived by imposing the iron abundance, derived from individual Fe I lines, to be independent of lower excitation potential; surface gravity log g is derived by imposing ionization equilibrium between the iron abundance of individual Fe I and Fe II; the microturbulent velocity is derived by imposing the iron abundance from individual Fe I lines to be independent of reduced equivalent width (RW). For these analysis, 17 Fe I and 4 Fe II lines are used. Due to the high s-process enrichment of J004441.04, the number of useful non-blended Fe lines for the atmospheric determination is limited, especially for Fe II.
The results for the different atmospheric parameters are shown in Table 2 and lie in the range of typical post-AGB parameter values. The iron abundance for the determined atmospheric parameters is a good estimate of the overall chemical composition which is in this case = -1.34 0.32 (dex). The abundance error of 0.32 is the total error including the line to line scatter and the uncertainties by the used atmospheric model which will be further discussed in Sect. 3.3. The low iron abundance of J004441.04 with respect to the mean metallicity of the SMC of (Luck et al. 1998) classifies J004441.04 as a low-metallicity star which are generally acknowledged as astrophysical production sites of heavy s-nuclei provided the third dredge-up (TDU) takes place.
| (K) | |
|---|---|
| log g (dex) | |
| (km/s) | |
| (dex) | -1.34 0.32 |
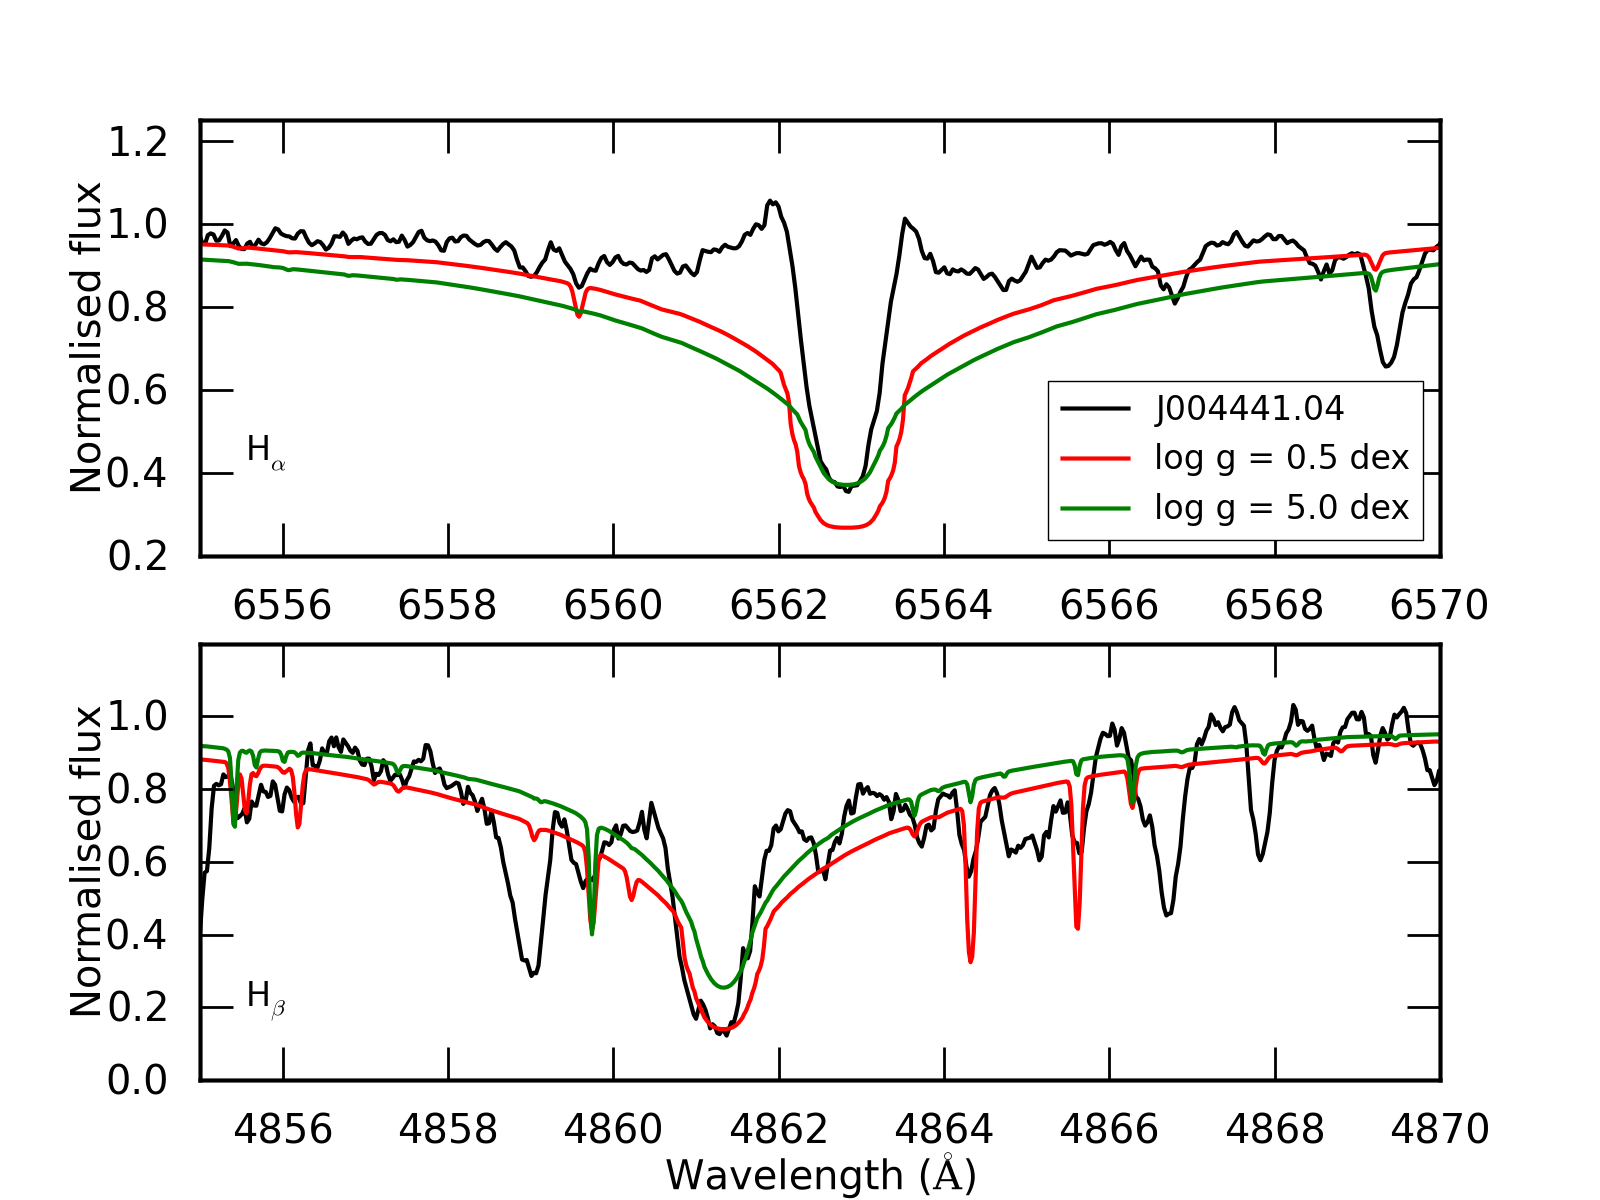
An attempt was made to determine the surface gravity of J004441.04 by fitting synthetic spectra to its Balmer lines and at 6562.8 Å and 4861.3 Å respectively. The comparison between the Balmer wings of the synthetic models with different log g and J004441.04 would provide an estimate of the surface gravity of J004441.04. However, this method is not usable for J004441.04, since its Balmer wings display emission lines as shown in Fig. 4. The upper panel shows the comparison between lines, the lower panel shows . The black spectrum represents J004441.04, the red and green spectrum are synthetic spectra of Coelho et al. (2005) with a log g of 0.5 and 5.0 dex respectively. Both panels display emission in the wings of both Balmer lines of J004441.04 which are most probably caused by ongoing mass loss. Also the strong enrichment of J004441.04 makes it impossible to fit the Balmer wings, since J004441.04 displays multiple strong atomic lines which are not included in the synthetic spectra. This is especially clear in the lower panel of Fig. 4.
The atmospheric parameters can be checked using results on other species only when the number of lines for that species is significant. Unfortunately, most species only have two, three or four useful lines (see already Table 3) due to the high number of blends. Fe I is the only neutral ion with single lines covering a large range in excitation potential. Fe is also the only element for which a useful number of lines of different ions is found. Therefore, the microturbulent velocity is the only parameter which can be checked using another species than Fe: although the used number of lines of La II, Ce II and Nd II is small, they do provide a mean to check the derived . This check with La II and Ce II yields km/s and Nd II gives km/s , which confirms the found microturbulent velocity.
3.3 Abundance determination
With our preferred model atmosphere as basis, we started with a full but strictly relative abundance analysis and limited ourselves first to the lines used in the spectral analyses of IRAS06530-0213.
We used mainly isolated non-blended, non-saturated lines and the individual atomic lines are all double-checked via a spectrum synthesis to investigate the possible presence of unresolved blends. N lines with EWs larger than 3 Å are not found and are not used due to possible confusion with noise in the spectrum. A redder spectrum will be needed for the N abundance determination.
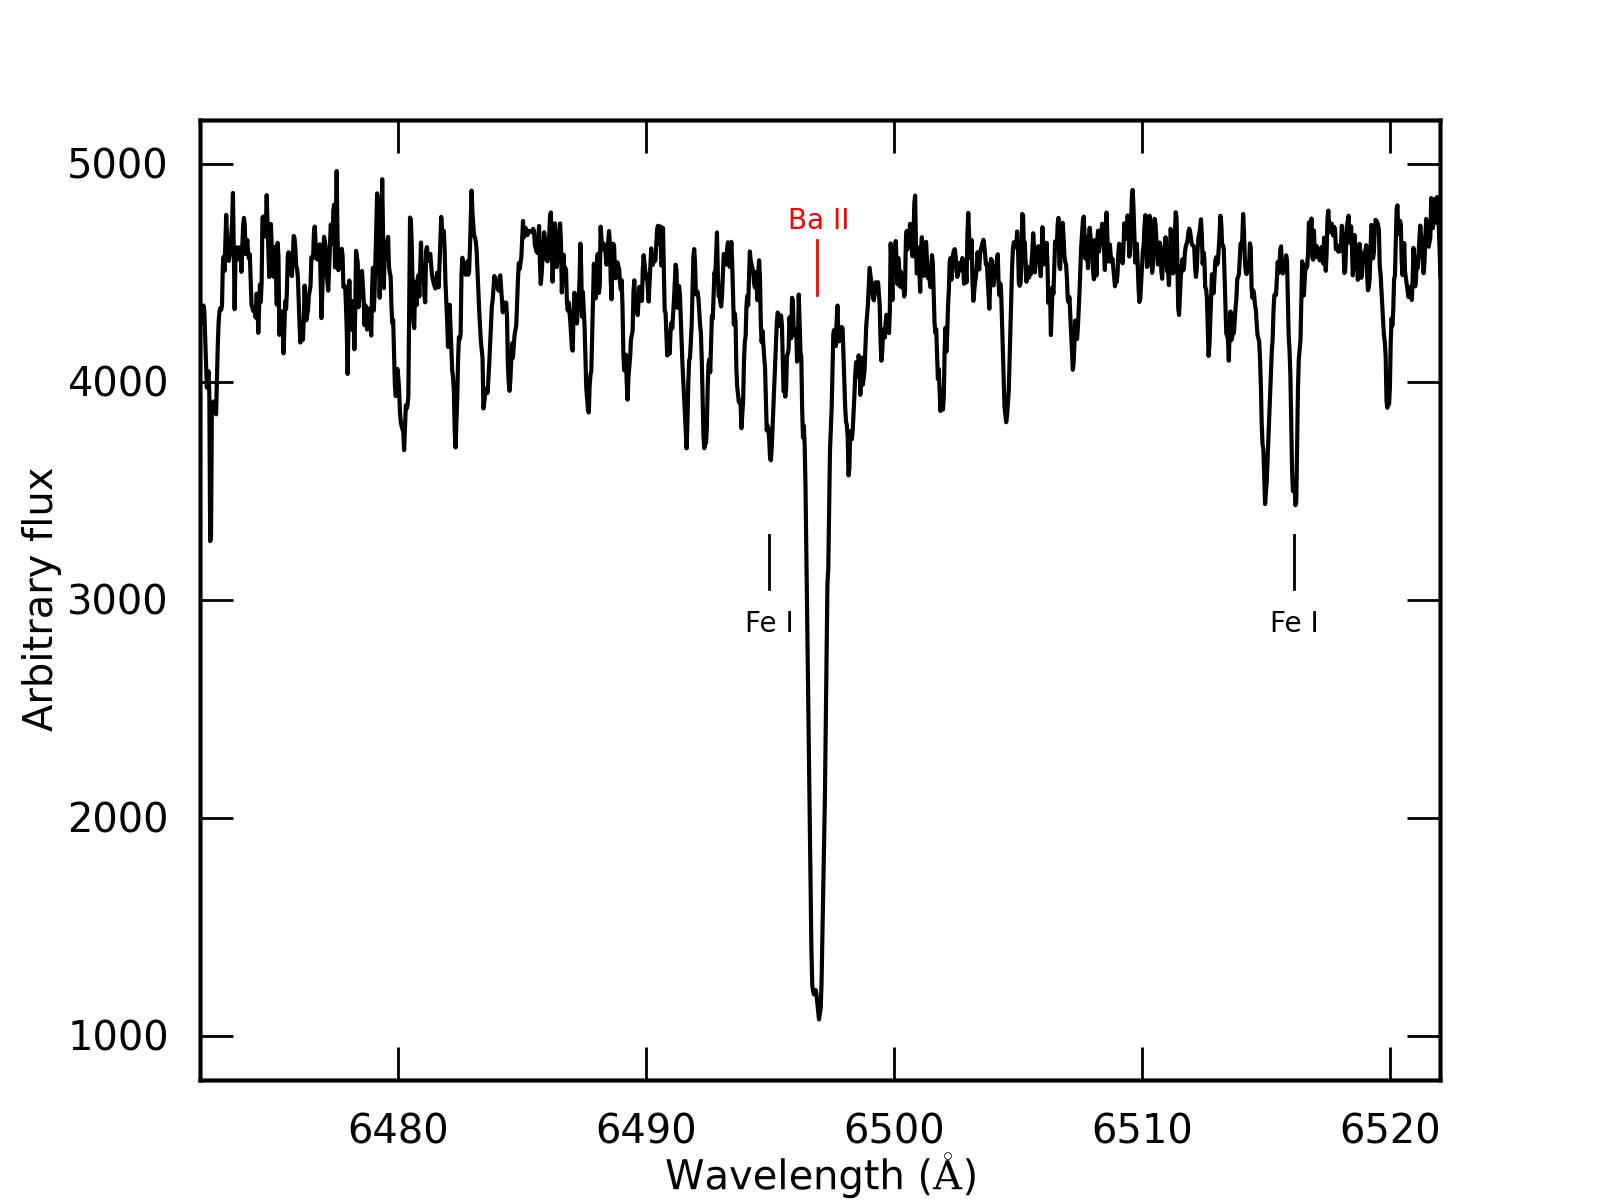
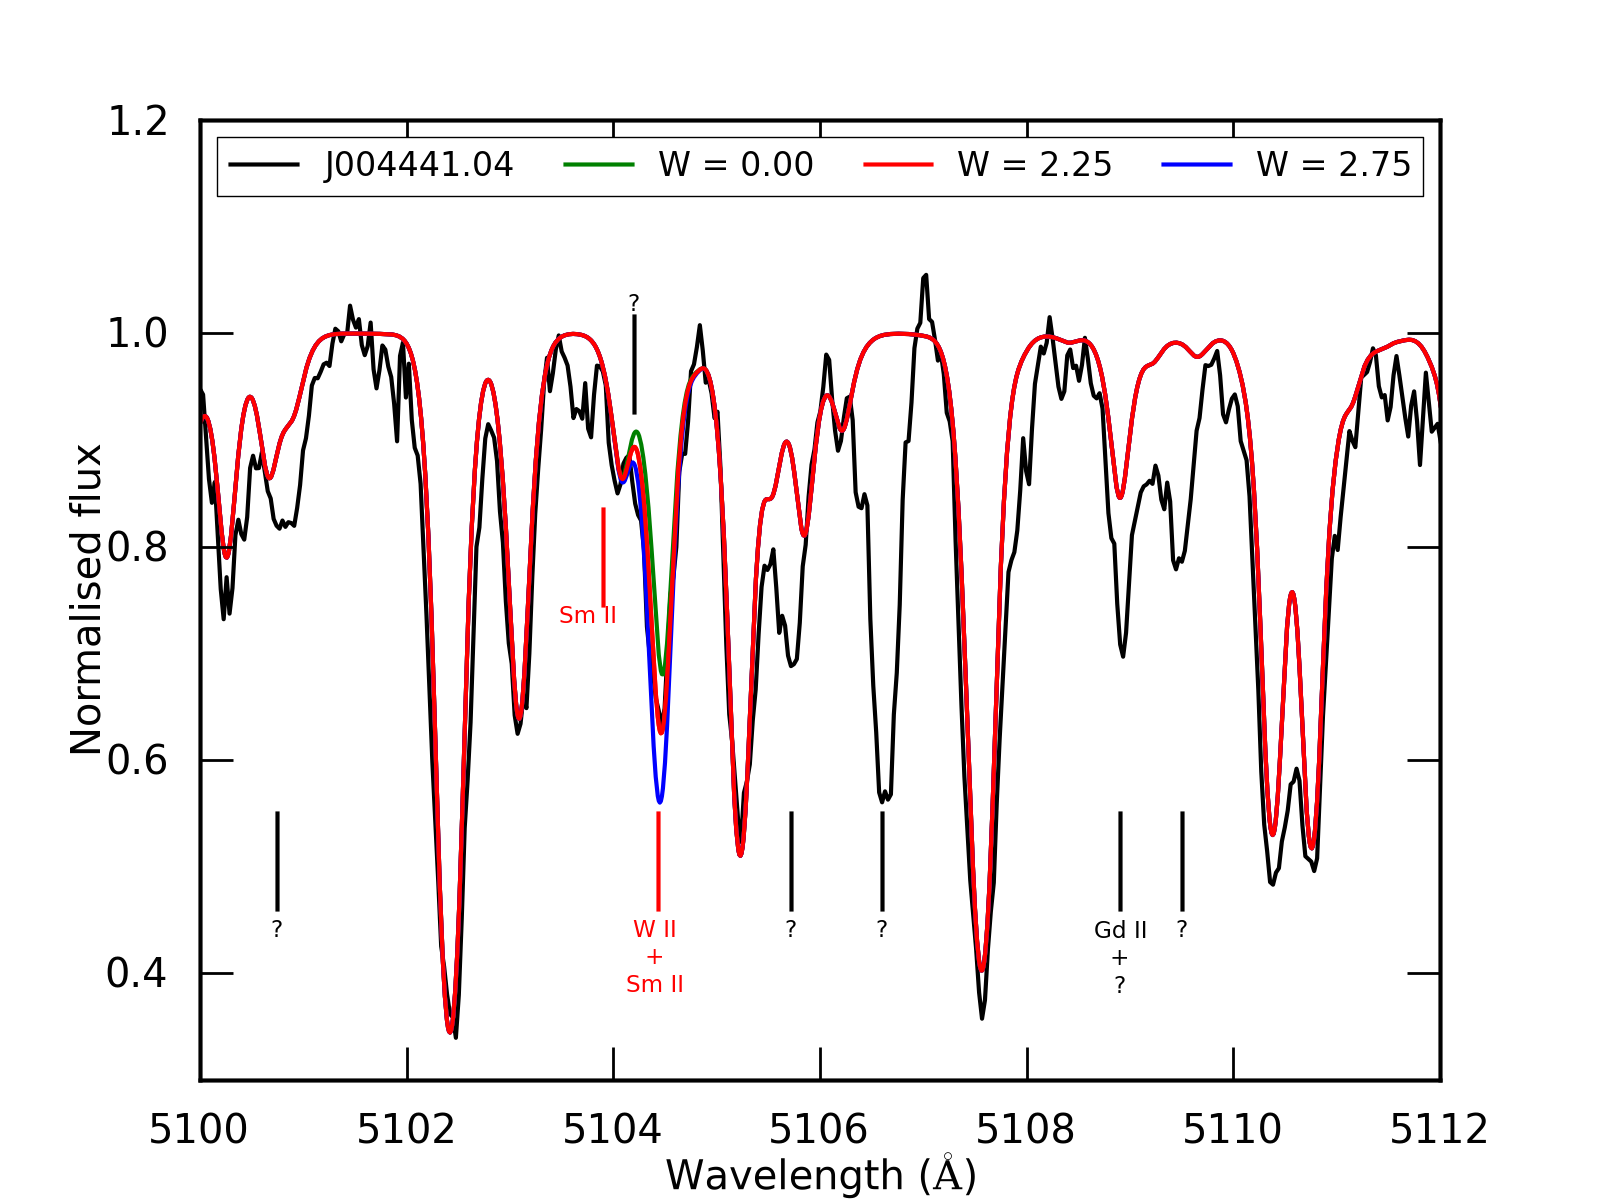
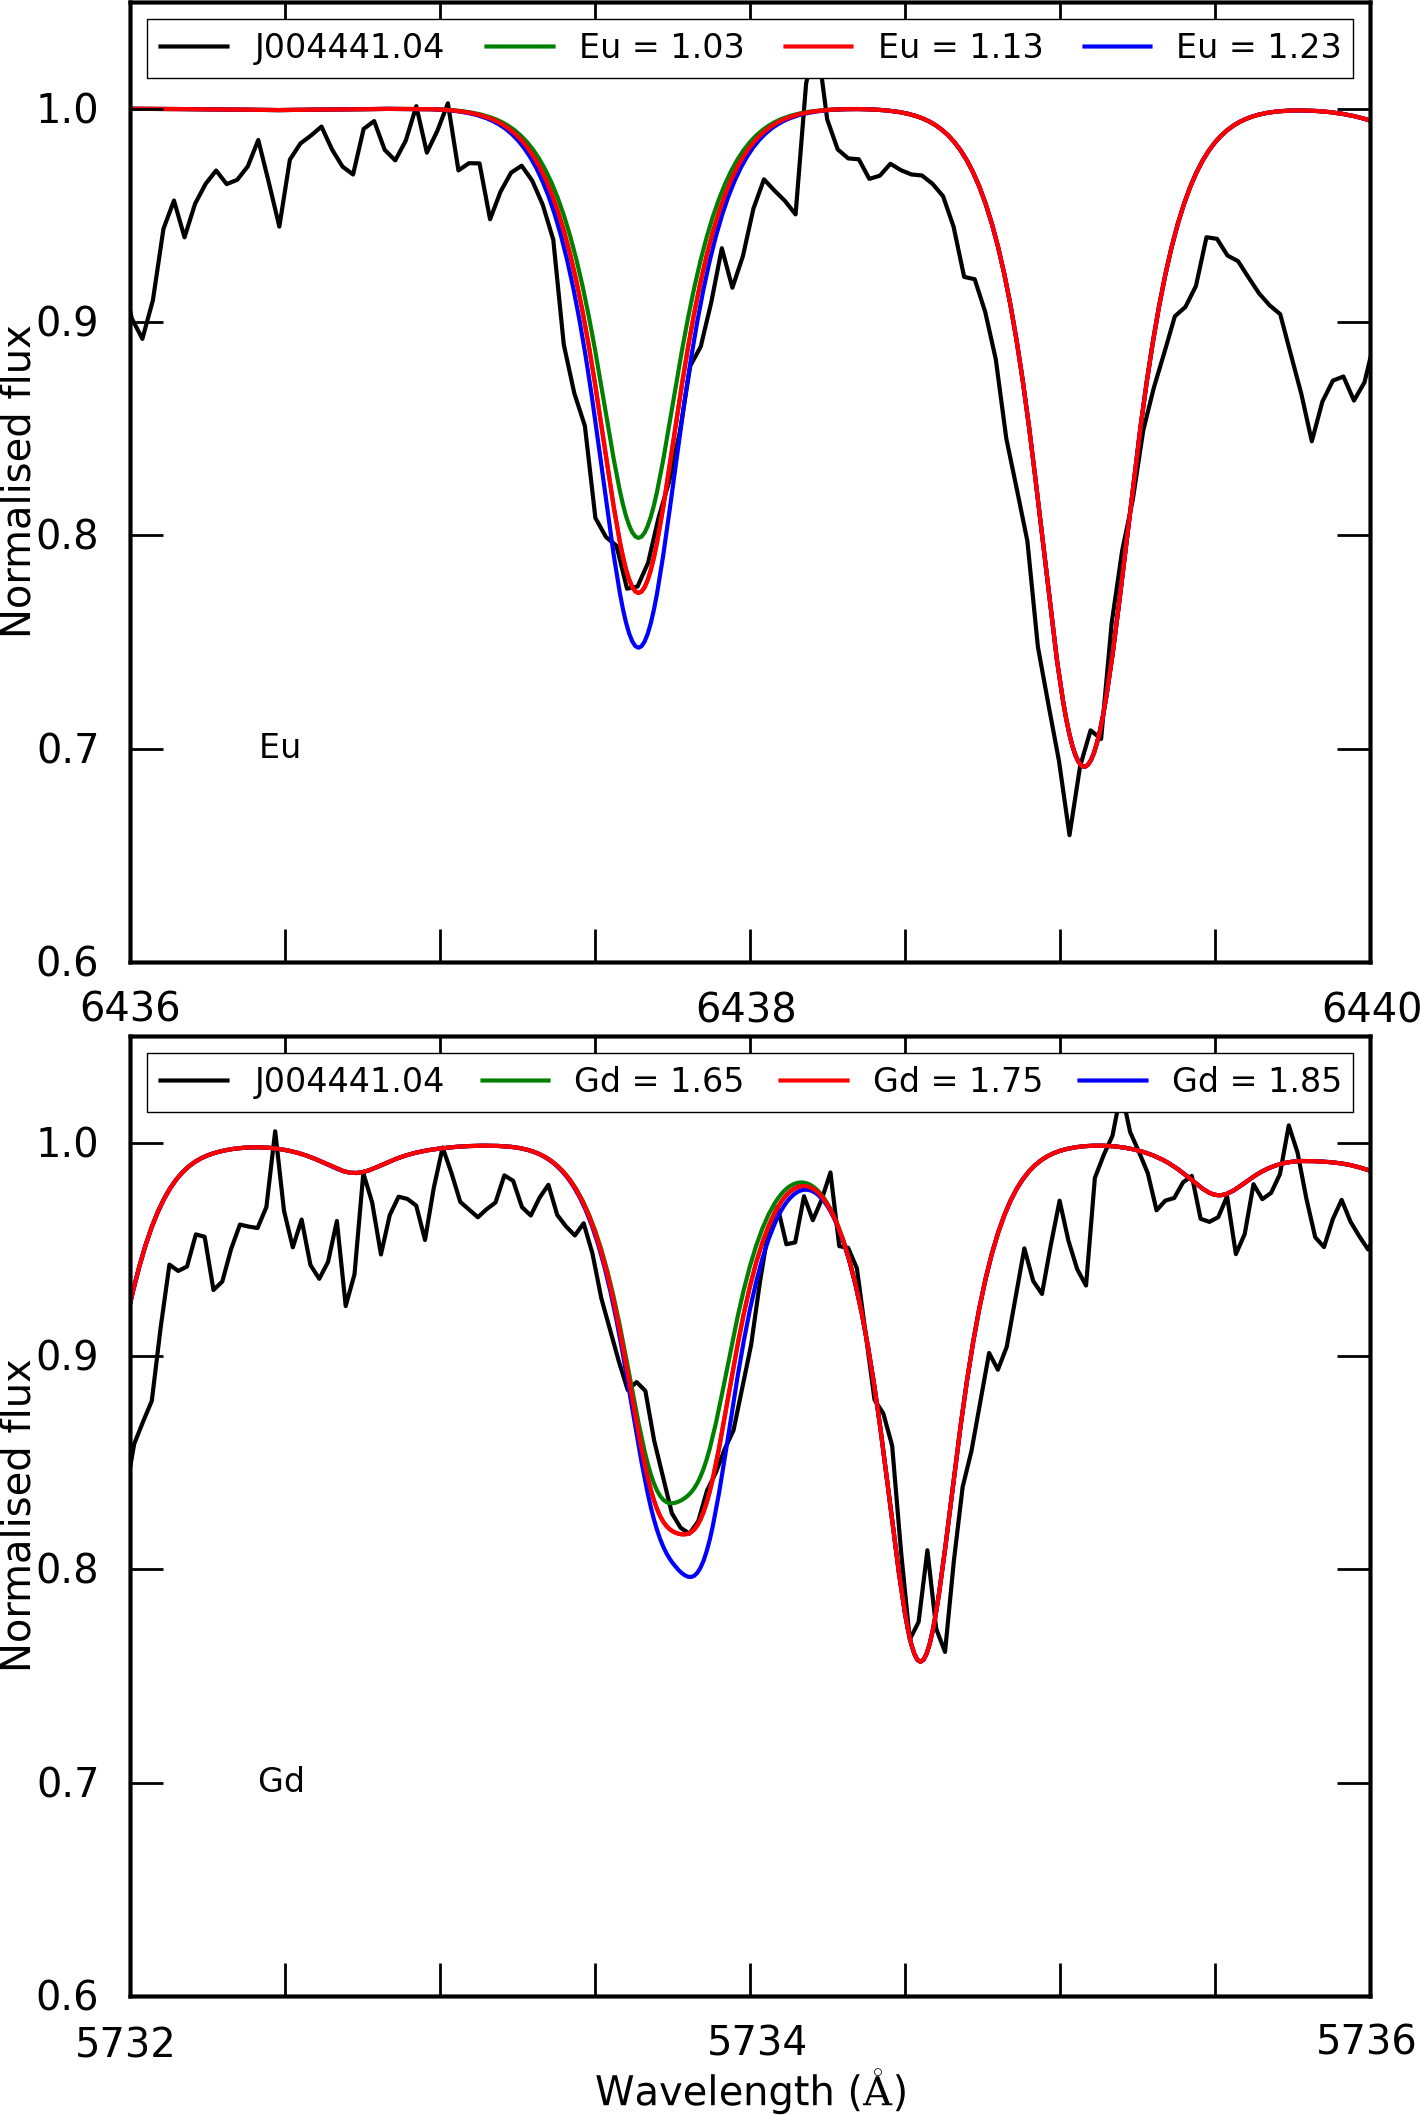
Unfortunately, at these high overabundances, all Sr and Ba lines are heavily saturated making accurate abundance determination of these two most famous s-process species impossible (Figs. 1 and 3). The other s-process abundances come from isolated single lines except for those species where all detectable lines turned out to be blended. These specific blends were fitted by creating synthetic spectra in MOOG using VALD line lists of specific wavelength ranges. The resulting fits for Eu II and Gd II are shown in Fig. 6 for the Eu II line at 6437.640 Å in the upper panel and the Gd II line at 5733.852 Å in the lower panel. The black spectrum is the spectrum of J004441.04, the colored spectra are synthetic spectra with different abundances of the studied element. The Eu II line at 6437.640 Å is part of a blend with a very weak Y II line at 6437.169 Å, the Gd II line is part of a blend with a relatively strong Ce II line at 5733.692 Å. Fig. 5 shows the spectrum synthesis of the W II line at 5104.432 Å. The black spectrum is J004441.04, the colored spectra are synthetic spectra with different W abundances. This W II line forms a blend with a Sm II line at 5104.479 Å which is indicated in the figure. The positions of lines unknown to VALD are indicated with ’’ proving that there are still a large number of lines that need to be identified in these highly enriched object.
The next step in the process was to constrain abundances for elements which have no isolated single lines. We used VALD line lists to predict the equivalenth widths for all lines of a given element by assuming a strong overabundance. For each element we then choose the strongest line in our observed spectrum and fitted this line with synthetic spectra of MOOG, analog to the Eu II and Gd II abundances so with appropriate input abundances of all elements which we could quantify previously. Unfortunately, also here the strong overabundances of s-process elements create spectral lines which are unknown to VALD linelists making abundance determinations difficult because of possible blends of unknown origin. Using the synthetic spectrum method, we estimated abundances for Mg I and Zn I together with the s-process elements Dy II, Er II, Yb II, Lu II and Hf II. Afterwards, we determined the EW of each used line in order to perform an error analysis on the derived abundances. For the abundance determination of O, we did not use the forbidden O I lines at 6300 and 6363 Å as they are part of an identified and unidentified blend respectively. After the abundance determination, we performed a spectral synthesis of the 6300 Å line using the derived O abundance which rendered a good fit. As forbidden lines are not sensitive to non-LTE effects (see e.g. Kiselman (2002)), this is a confirmation of the obtained high oxygen abudance.
The final abundance results of J004441.04 are shown in Table 3 where N represents the number of lines used for the abundance determination of the species, the full line list used for the abundance determination is shown in Table LABEL:tab:all_lines. Solar abundances are taken from Asplund et al. (2009), uncertanties in log and log due to line-to-line scatter are given by and respectively. The sensitivity of to uncertainties in the line-to-line scatter, effective temperature, surface gravity and microturbulent velocity are given by , , and respectively. The combined uncertainty in due to the above described sensitivity is represented by . Elemental abundances derived via synthetic spectrum fitting are indicated in an italic font in Table 3. We remark again that non-LTE effects are not taken into account in the abundance determination of the different species. Although the abundances of some useful elements for nucleosynthesis studies cannot be determined, Table 3 still contains quantified abundances of a wide range of s-elements.
| Species | N | log | log | |||||||
|---|---|---|---|---|---|---|---|---|---|---|
| +250 K | -250 K | +0.5 dex | +0.5 km/s | -0.5 km/s | ||||||
| C I | 6 | 0.14 | -0.23 | 0.24 | 0.11 | 0.02 | -0.02 | |||
| O I | 3 | 0.13 | -0.35 | 0.32 | 0.12 | 0.02 | -0.05 | |||
| Na I | 2 | 0.12 | -0.08 | 0.06 | -0.02 | 0.01 | -0.03 | |||
| Mg I | 1 | 0.22 | -0.11 | 0.05 | -0.05 | 0.02 | -0.04 | |||
| Si I | 2 | 0.09 | -0.11 | 0.07 | -0.05 | 0.02 | -0.04 | |||
| S I | 2 | 0.16 | -0.17 | 0.15 | 0.03 | 0.02 | -0.04 | |||
| Ca I | 4 | 0.09 | -0.03 | 0.03 | 0.01 | 0.00 | 0.00 | |||
| Sc II | 3 | 0.15 | 0.08 | -0.08 | 0.01 | -0.01 | 0.01 | |||
| Ti II | 3 | 0.25 | 0.06 | -0.05 | 0.01 | -0.02 | 0.01 | |||
| Cr II | 3 | 0.13 | -0.02 | 0.00 | -0.02 | 0.01 | -0.02 | |||
| Mn I | 2 | 0.14 | -0.07 | 0.01 | -0.05 | 0.01 | -0.04 | |||
| Fe I | 17 | 0.11 | 0.00 | 0.00 | 0.00 | 0.00 | 0.00 | |||
| Fe II | 4 | 0.17 | 0.00 | 0.00 | 0.00 | 0.00 | 0.00 | |||
| Ni I | 4 | 0.19 | -0.05 | 0.01 | -0.04 | 0.03 | -0.04 | |||
| Zn I | 1 | 0.22 | -0.06 | 0.00 | -0.04 | -0.01 | 0.00 | |||
| Y II | 2 | 0.13 | 0.26 | -0.08 | 0.20 | -0.13 | 0.19 | |||
| Zr II | 2 | 0.17 | 0.13 | -0.08 | 0.07 | -0.06 | 0.07 | |||
| La II | 9 | 0.18 | 0.23 | -0.14 | 0.09 | -0.08 | 0.10 | |||
| Ce II | 8 | 0.18 | 0.12 | -0.12 | -0.01 | -0.02 | 0.01 | |||
| Pr II | 2 | 0.12 | 0.23 | -0.18 | 0.02 | -0.06 | 0.06 | |||
| Nd II | 7 | 0.16 | 0.24 | -0.17 | 0.03 | -0.05 | 0.07 | |||
| Sm II | 2 | 0.13 | 0.22 | -0.16 | 0.05 | -0.05 | 0.07 | |||
| Eu II | 1 | 0.16 | 0.10 | -0.13 | -0.06 | -0.04 | 0.04 | |||
| Gd II | 1 | 0.16 | 0.05 | -0.10 | -0.04 | 0.00 | -0.02 | |||
| Dy II | 1 | 0.12 | 0.11 | -0.16 | -0.05 | -0.01 | -0.01 | |||
| Er II | 1 | 0.24 | 0.04 | -0.07 | -0.04 | 0.01 | -0.02 | |||
| Yb II | 1 | 0.26 | -0.02 | -0.01 | -0.04 | 0.57 | 0.00 | |||
| Lu II | 1 | 0.15 | 0.02 | -0.06 | -0.03 | -0.04 | 0.06 | |||
| Hf II | 1 | 0.12 | 0.03 | -0.08 | -0.03 | 0.00 | -0.01 | |||
| W II | 1 | 0.26 | 0.02 | -0.07 | -0.04 | -0.01 | -0.01 | |||
3.4 Abundance results
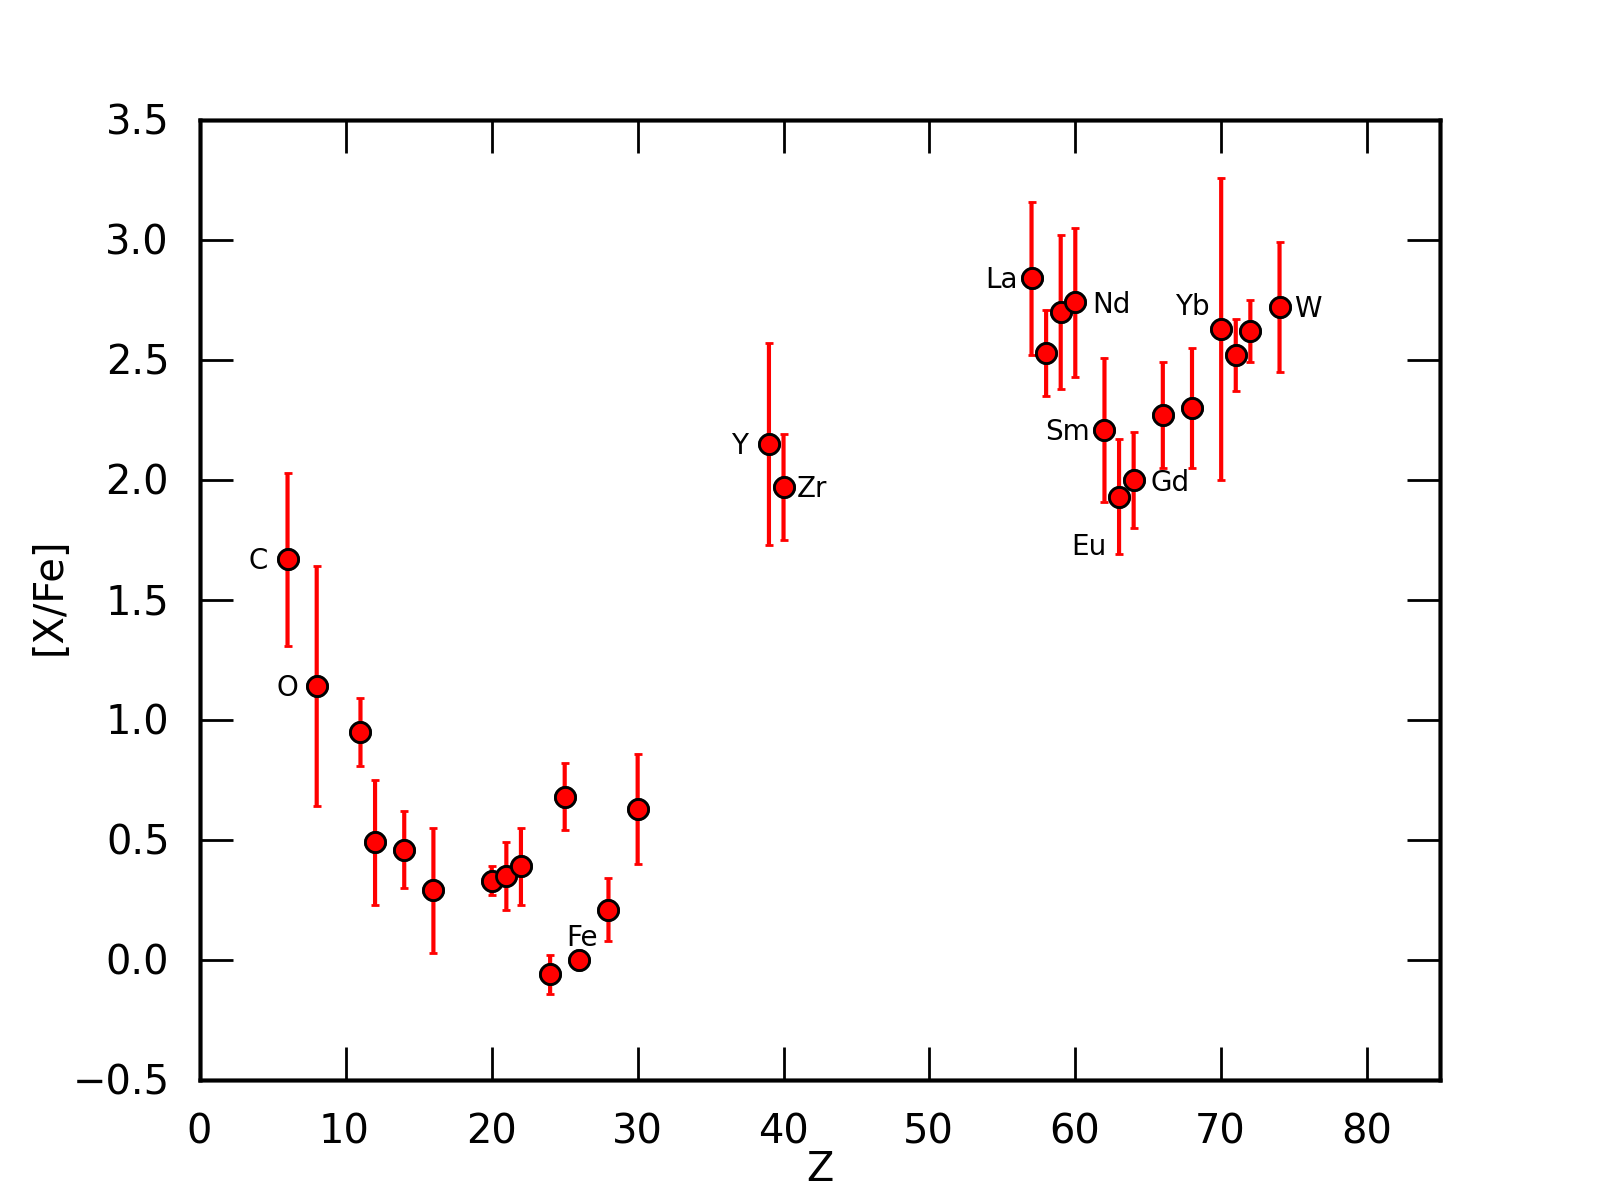
The results of Table 3 are plotted in Fig. 7, the errorbars represent the total uncertainty . For clarity some elements are labelled. The figure illustrates well the post-carbon star signature of J004441.04, with a C enrichement and very strong s-process enrichment. The C/O ratio is 1.9 0.7. The uncertainties of the model atmosphere has the biggest impact on the accuracy of this ratio. J004441.04 is a post-AGB Carbon star with a C/O larger than one, but only mildly so.
Concerning the available -elements Mg, Si, S, Ca and Ti, the simple mean of the is . Such an enhancement is normal for Galactic objects in this metallicity range as a consequence of galactic chemical evolution and would not point to an intrinsic enhancement. However, it is not clear whether this relation also holds for the SMC.
The extreme s-process abundances point to a very effective dredge-up. With [Y/Fe] = +2.2 and [La,Ce,Pr,Nd/Fe] all inbetween 2.5 and 2.8 the s-process overabundance is extreme. Also the s-process overabundances of elements well beyond the Ba peak are high. The abundance results show that J004441.04 is the strongest s-process enriched extra-galactic object studied to date.
Fig. 7 shows a stronger overabundance of the heavy s-process component (magic neutron number 82) around La and Ce with respect to the light s-process component (magic neutron number 50) around Y and Zr which indicates an effective 13C pocket for the production of heavy elements.
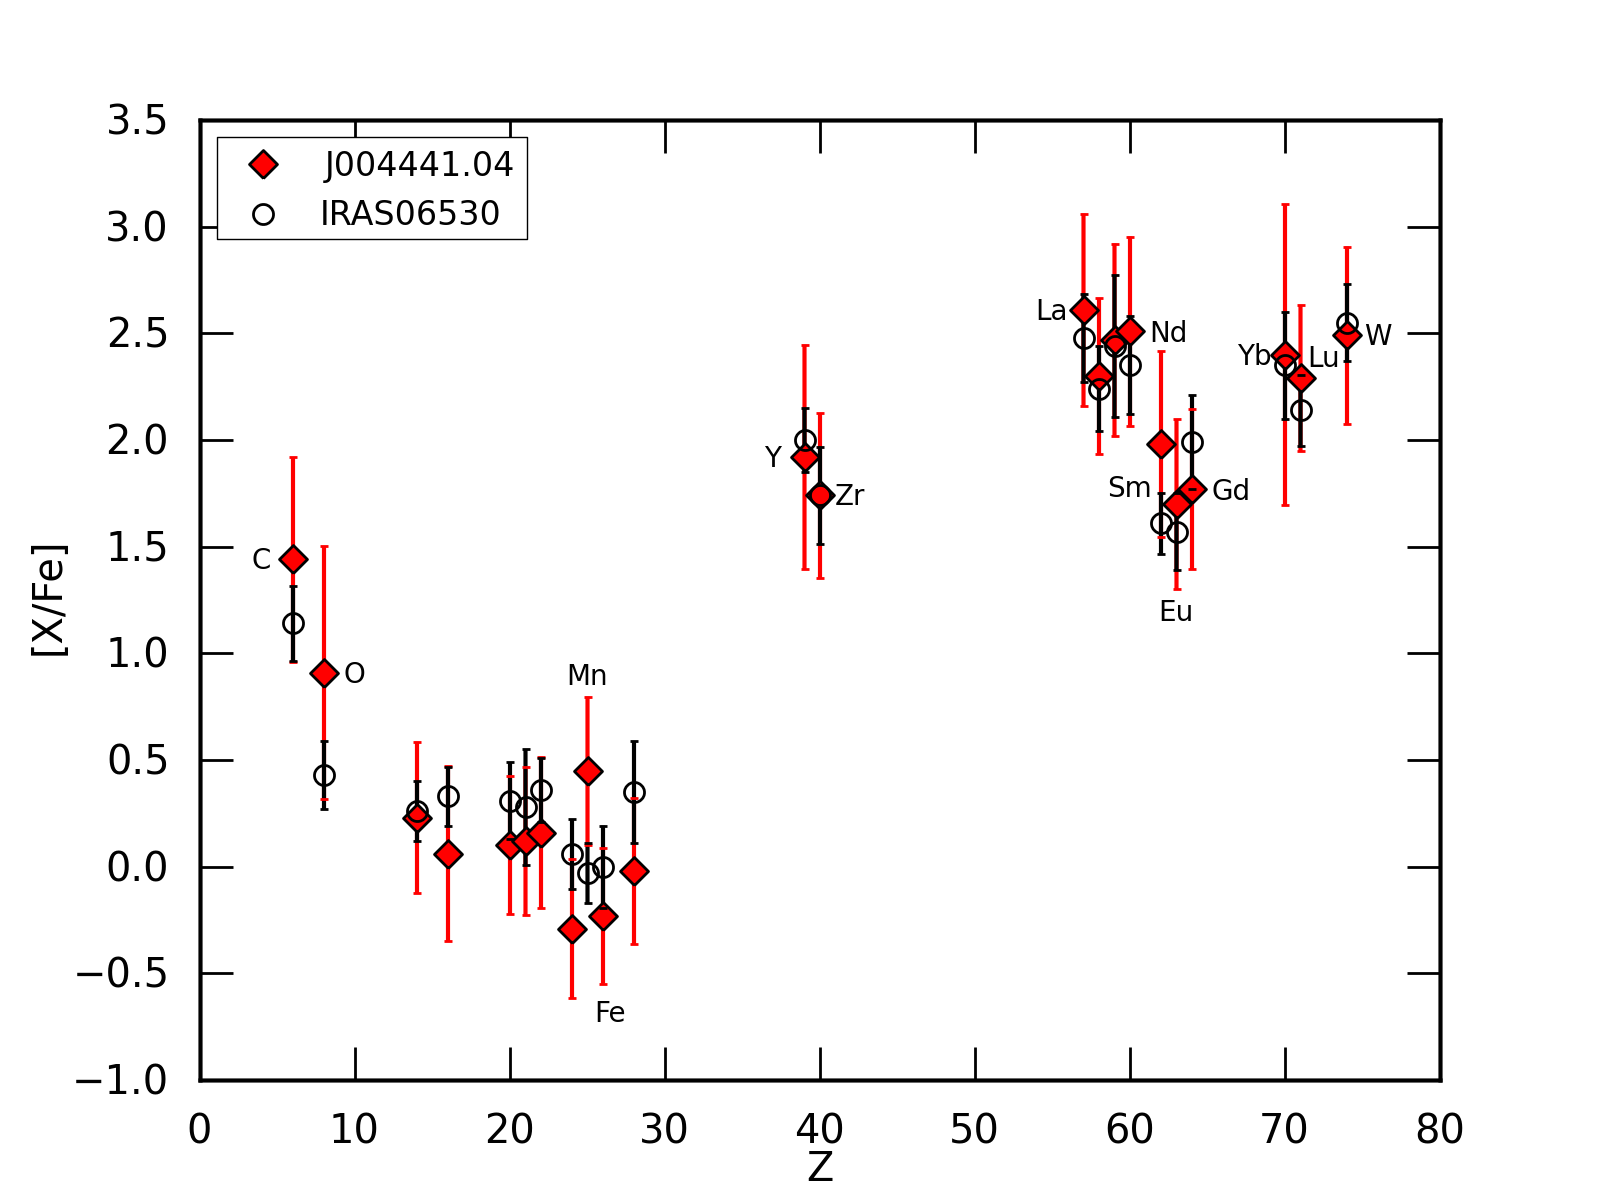
To get a good comparative view of the s-process nucleosynthesis of J004441.04 and IRAS06530, we scale the result of J004441.04 to the result of IRAS06530 making both values overlap. This difference between the results is then added to the ratios of J004441.04.
The results of this scaling are shown in Fig. 8 in which the red diamonds are the results of J004441.04, open circles represent the results of IRAS06530. The red errorbars of J004441.04 ratios represent the total uncertainty in while for IRAS06530, the black errorbars represent only the line-to-line scatter taken from Reyniers et al. (2004). Some elements are labelled for clarity. Despite a metallicity difference, Fig. 8 clearly shows that both objects have very similar s-process abundance patterns. With a C/O ratio of 2.8 and 1.9 respectively, also the C/O ratio of IRAS06530 and J004441.04 are very similar. The same abundance trends can be found for the lighter elements where only Mn displays a strong difference. Following the index definitions of Reyniers et al. (2004), we find an intrinsic index [hs/ls] = +0.5 and [s/Fe] = 2.4. In these indices, hs stands for high-mass s-process elements around the Ba peak and ls for elements around the Sr peak. We quantified the Ba abundance using the observed Nd abundance. This places J004441.04 in the upper right corner of the upper panel in Fig. 7 of Reyniers et al. (2004) confirming the correlation between the total enrichment of s-process elements and the [hs/ls] index. The results of J004441.04 corroborate the finding that there is no clear correlation between metallicity and the [hs/ls] index in the metallicity range sampled by post-AGB stars (Reyniers et al. 2004).
4 Spectral energy distribution
The spectral energy distribution (SED) of J004441.04 and its assumed distance provide the opportunity of determining its luminosity. The photometric data of Table 1 are used for the SED construction of J004441.04. For post-AGB objects in the SMC, we need to take into account three possible sources of reddening.
The first one is reddening by interstellar dust in the Milky Way Galaxy (MW) towards the SMC. Schlegel et al. (1998) derived the extinction towards the SMC by galactic dust to be small with an average of E(B-V) = 0.037 mag.
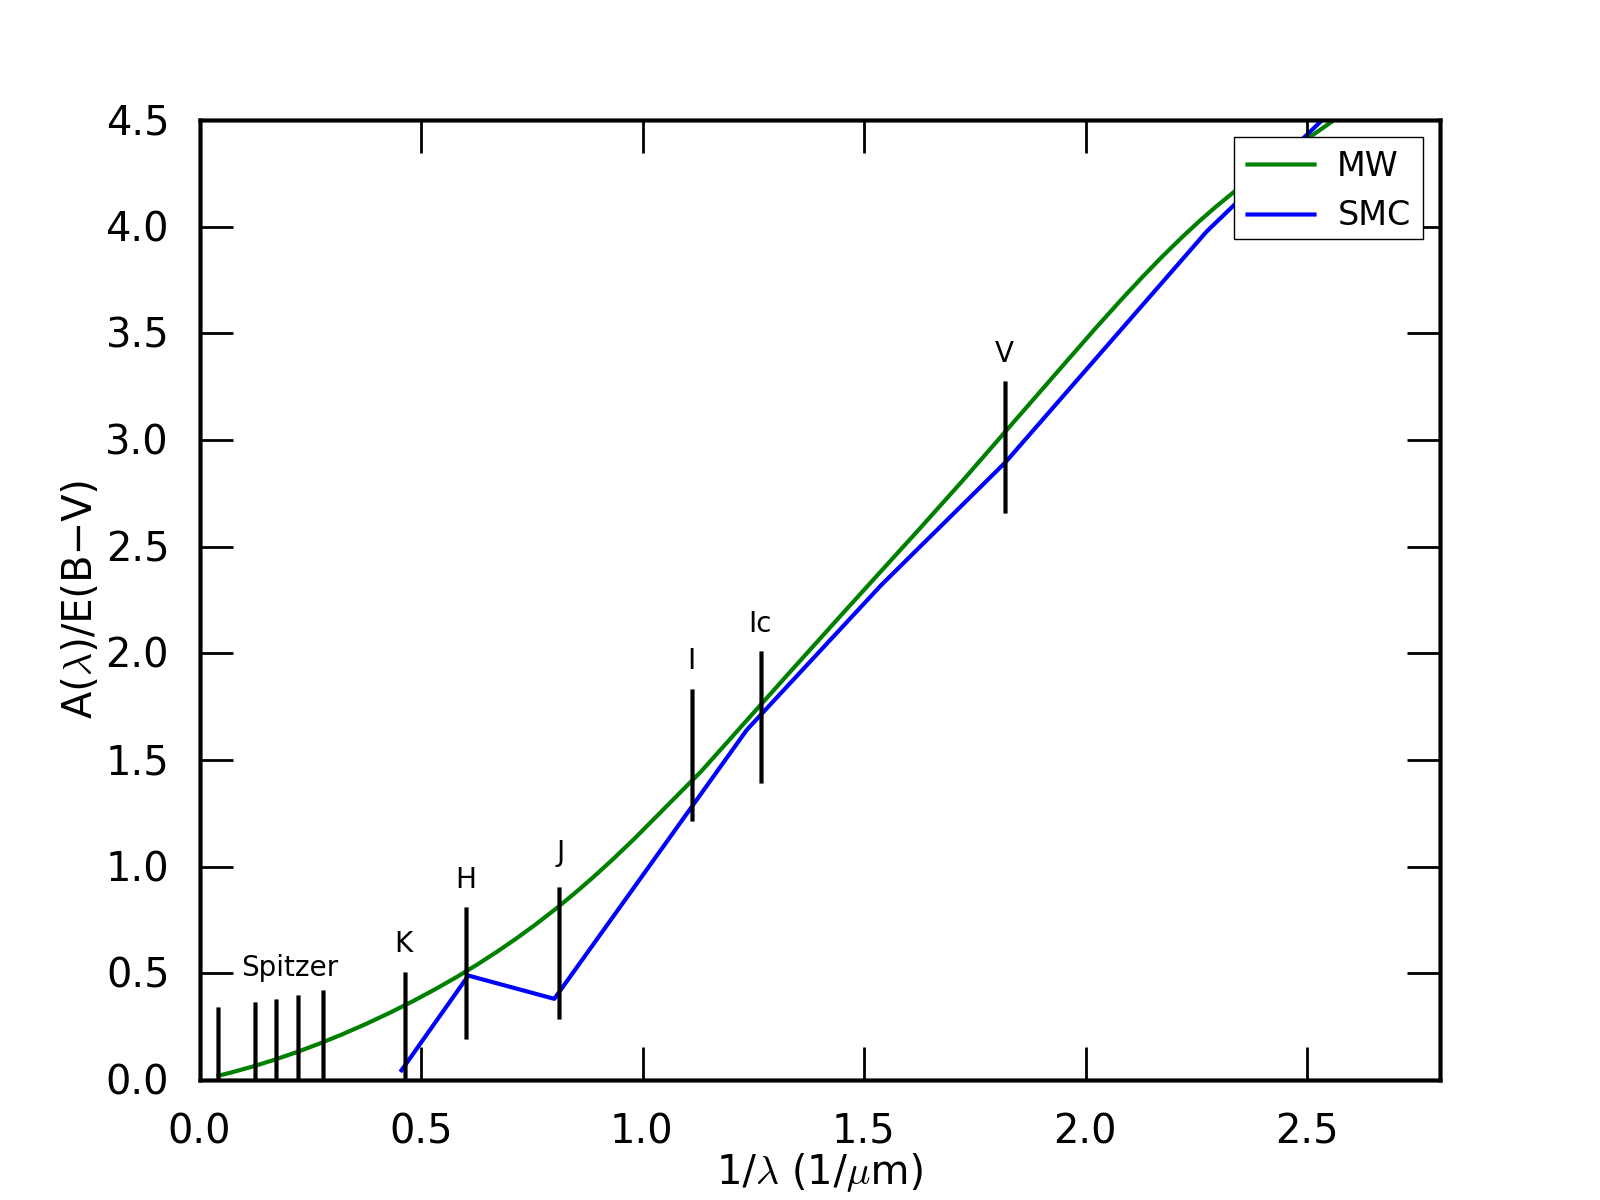
The second possible reddening source is reddening in the SMC itself. Fig. 9 shows the MW (green) and SMC (blue) extinction curves which are taken from Cardelli et al. (1989) and Gordon et al. (2003) respectively. The lines indicate the extinction of the different photometric bands of Table 1. The SMC curve only contains values at filter wavelengths explaining the strange behavior. Since both J and K bands almost overlap, only one of them is indicated in the figure. The extinction in the wavelength range used for the SED of J004441.04 is approximately the same for both the MW and the SMC. The largest difference between both reddening laws are shown in the J and K bands. The extinction is small for these IR bands, making that the different reddening laws hardly differ in the wavelength regime of interest. Because of the strong resemblance between the MW and SMC curve in the used wavelength range, we use the reddening law of the MW to determine the reddening in the SMC.
The third extinction cause is reddening by the circumstellar dust envelope of the post-AGB object itself. We applied a dereddening assuming that the wavelength dependency of the circumstellar extinction is similar to the ISM extinction law of the MW.
We determined the total reddening by applying a minimalisation on the fit between the scaled model atmosphere and the dereddened broadband fluxes. A Monte Carlo simulation is used to determine the error on E(B-V) for 1000 arrays with a normal distribution of the original flux. For J004441.04, this results in an E(B-V) of 0.64 0.02.
| E(B-V) | 0.64 0.02 |
|---|---|
| L () | 7600 200 |
| / | 0.34 0.01 |
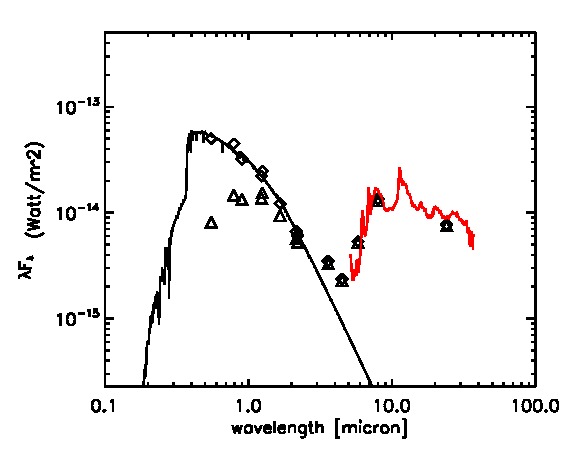
The SED of J004441.04 is shown in Fig. 10 together with the IR spectrum of J004441.04 which was used in Volk et al. (2011) to identify the object as a 21 m source. Squares indicate the dereddened fluxes, triangles indicate original (reddened) fluxes and the black line represents the scaled atmospheric Kurucz model (see 2).
J004441.04 has a clear double-peaked SED where the left peak represents the stellar photosphere and the right peak is the IR excess created by radiation of dust grains in the ejected AGB mass envelope (Fig. 10). By integrating the surface of the scaled Kurucz model, the luminosity of J004441.04 can be obtained assuming the distance to the SMC is approximately the distance to J004441.04. We use a distance of 61 kpc (Hilditch et al. 2005) to determine the luminosity which results in a photospheric luminosity of 7600 200 where the luminosity error is again determined via Monte Carlo simulations. The luminosity ratio of the IR excess and the photosphere can give some information about the strength of the circumstellar reddening. The IR luminosity is simply determined by integrating the surface of the IR excess. The resulting luminosity ratio / is 0.34 0.01 so about of the radiation emitted by the star is absorbed and re-emitted by dust in the circumstellar envelope contributing to reddening. We can assume the visible galactic extinction can be approximated to and via Fig. 9 we can assume the V band extinction of the MW and SMC are approximately the same. The deduced E(B-V) of 0.64 0.02 makes that roughly of the original photosphere flux reaches the observer and the other of the photosphere flux is absorbed or scattered outside the line-of-sight. Comparing this with the luminosity ratio / = 0.34 0.01 indicates that there is a significant contribution of the ISM extinction in the SMC and/or that there is deviation from spherical symmetry in the circumstellar shell.
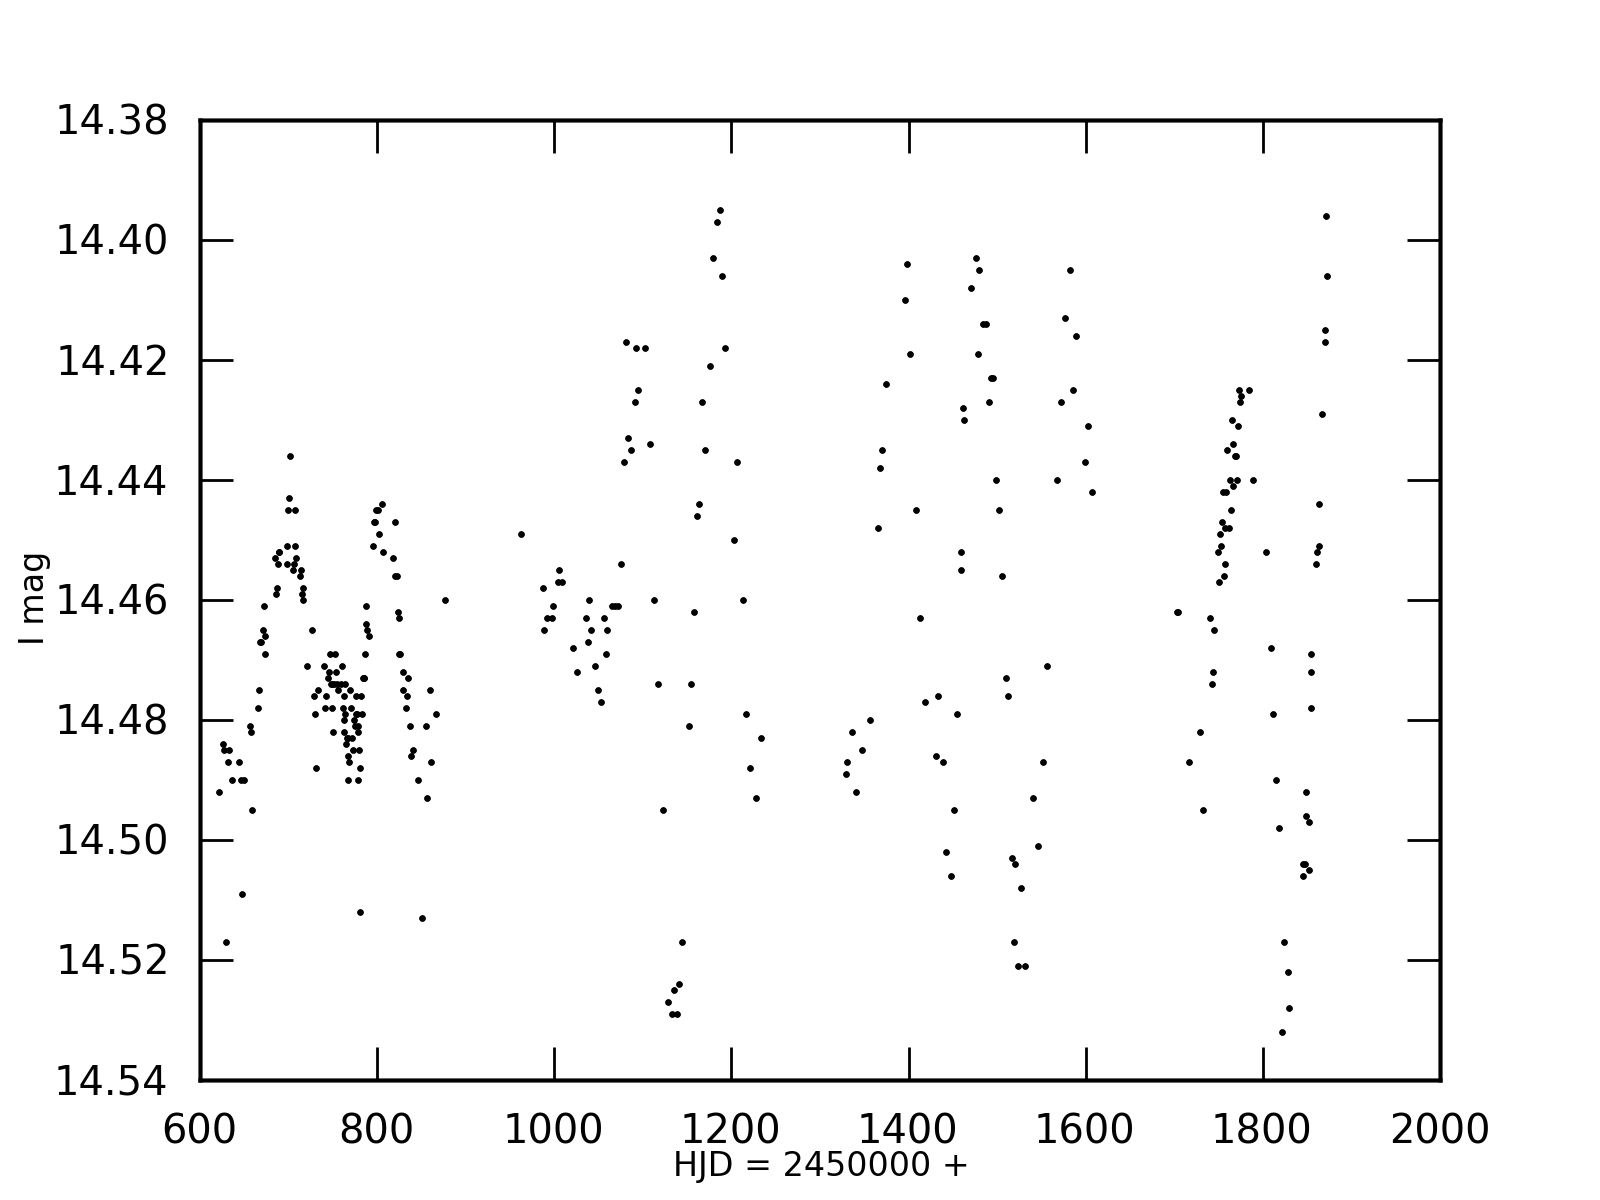
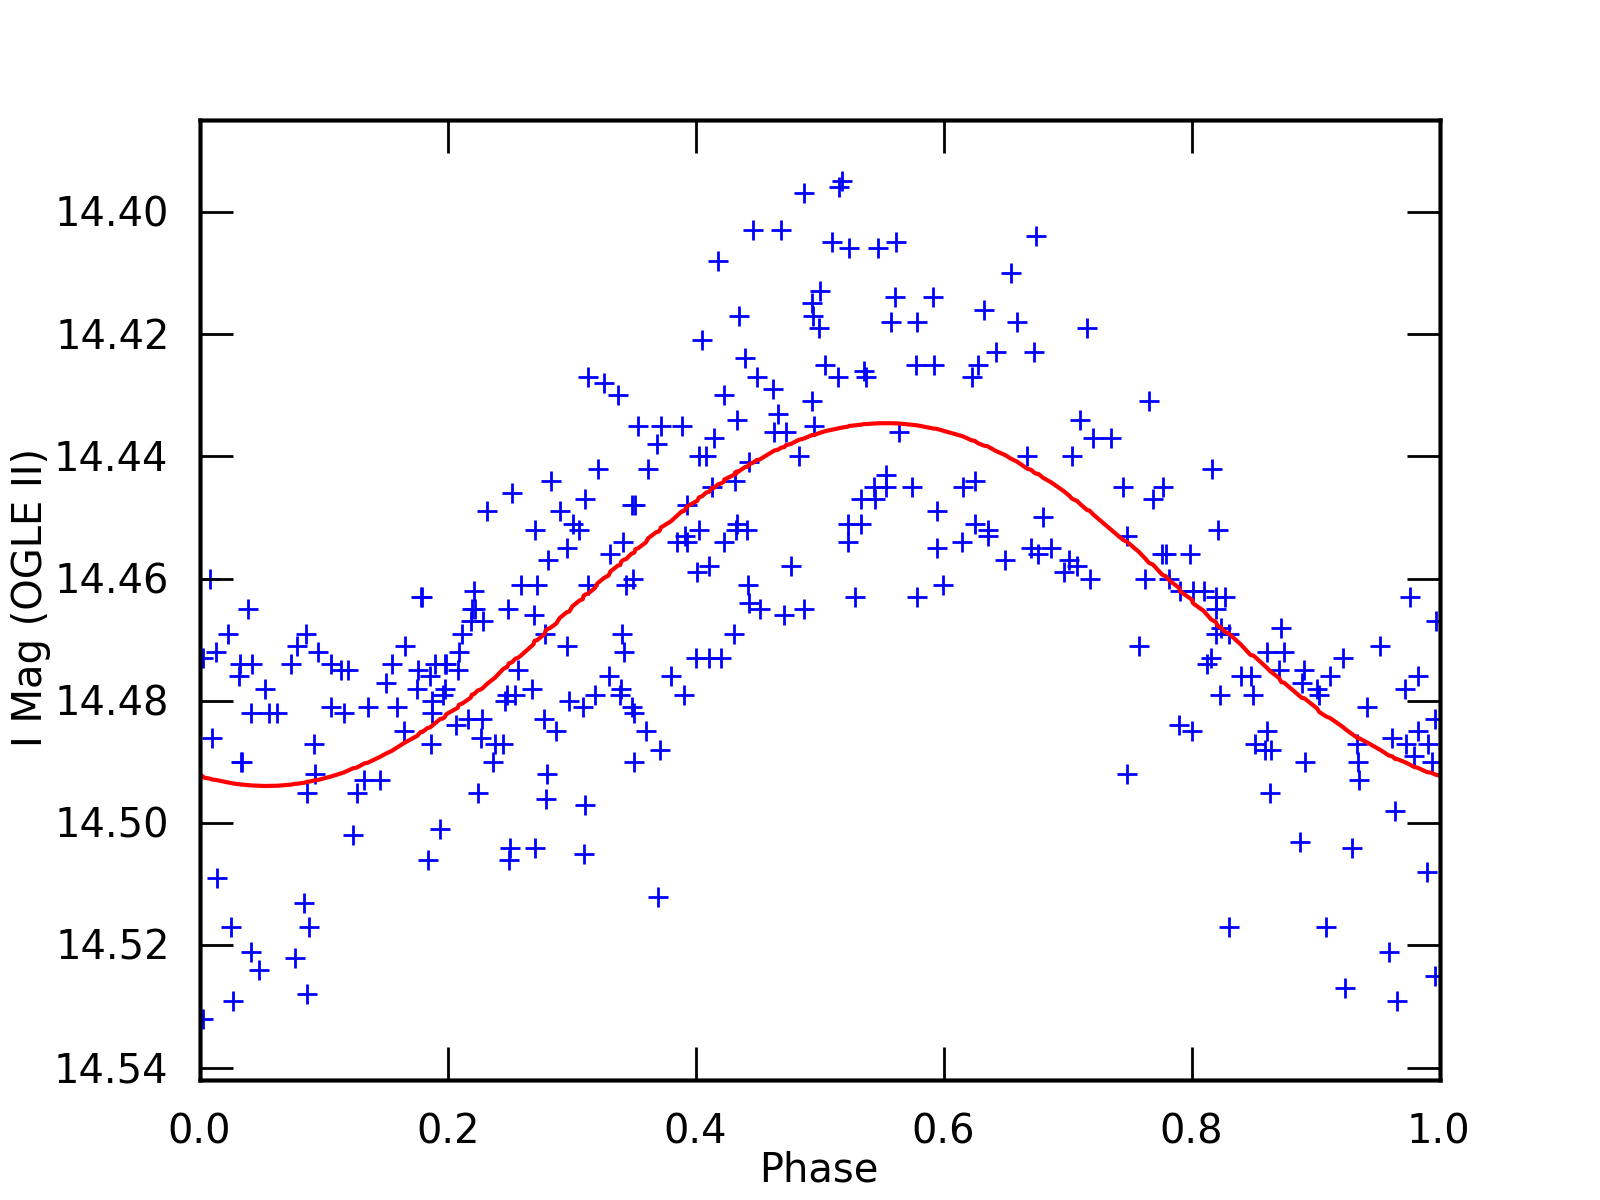
Post-AGB stars pass through the Cepheid II instability strip and J004441.04 is no exception. The variability in the I filter is displayed in Fig. 11. A frequency analysis of this light curve provides a dominating period of 97.6 0.3 days which is plotted in a phase diagram in Fig. 12. Blue crosses are the individual light curve points of Fig. 11 and it is clear from Fig. 12 that this is indeed the dominant period. Amplitude modulation is clearly apparent in Fig. 11. As the amplitude of the variability is rather small (maximum mag in I), the use of stable atmosphere models for the spectral analyses is still appropriate.
We attempted to use the observed period of 97.6 days to constrain the parameters of J004441.04 under the assumption that this is a pulsation. The linear pulsation code of Wood (1976) and its updates as described in Kamath et al. (2010) was used to examine the pulsation period of the fundamental mode in stellar models with luminosities of 7600, 10000, 15000 and 18000 Lsun and values between 4700 and 6300 K. The stellar mass was obtained from a linear fit between L and M for the two post-AGB tracks of Vassiliadis and Wood (1994) for an abundance of Z=0.001. The composition of the models was assumed to be X=0.75 and Z=0.001.
For our derived of 6250 K for J004441.04, the pulsation period of all these models is too small, typically near 50 days. This is about half the observed period. A much cooler effective temperature is required in order to obtain a model with the observed period of 97.6 days. At the luminosity L = 7600 L⊙ (our estimated value), a fundamental mode period of 97.6 days occurs at K while at the highest luminosity investigated (18000 Lsun) a fundamental mode period of 97.6 days occurs at K. In addition, models with near 6250 K are pulsationally stable in modes with periods greater than 20 days while those with near 4900 K are unstable. The pulsation periods are relatively insensitive to composition (X=0.10 was tried) and the adopted mass.
The value of 4900K required to get the correct pulsation period is, however, incompatible with the spectrum of J004441.04. There are two possible explanations for this discrepancy. Firstly, it is possible that the pulsation models are wrong. These stars are truely extreme: in the inner one third of the star radiation provides 90% of the pressure supporting the exterior envelope. The stars are difficult to analyse but all the relevant physics is included so there should be no obvious problem. The metal abundances in the envelope are non-standard so that the solar-scaled abundances used will lead to errors in the opacity. This is more likely to affect the stability of the models than the periods. It is not obvious that the pulsation models have significant incomplete physics.
If the pulsation models give the correct periods, then a second explanation for the discrepancy is required. Here we raise the possibility that the observed periodicity is not a pulsation but it could be due to other surface phenomena like rapid rotation of a spotted star or an orbiting companion. With our adopted and L values, and with a stellar mass of 0.65 , the breakup period is 94 days, very close to the observed period. So if rotation is an explanation for the variability, the star must be rotating at near-breakup velocity, which is again incompatible with the detected broadening of the spectral lines, unless we happen to look along the rotation axes. The angle between the line-of-sight and the rotation axes should, in that case, be lower than 10∘. Also, models indicate that a strong rotation and rotational shear in the intershell, may mix 14N into the 13C pocket hence impact on the efficiency of the s-process nucleosynthesis (Herwig et al. 2003; Siess et al. 2004). Considering the other possibility, an orbiting companion or dust cloud would have to be very close to the surface of J004441.04. The SED shows no indication of a hot dust excess (Fig. 10). All these possibilities do seem very unlikely. We are therefore unable to provide a satisfactory explanation for the observed periodicity in J004441.04.
5 Initial mass determination
Before comparing the results of J004441.04 with theoretical nucleosynthetic models, its initial mass (mass at the zero-age main-sequence) needs to be estimated. Both metallicity and initial mass are fundamental parameters for the calculation of models.
We use the evolutionary post-AGB tracks of Vassiliadis & Wood (1994) to obtain an accurate estimate of the initial mass. The choice of these tracks is based upon the metallicity: these authors calculated tracks for a metallicity of Z = 0.001 corresponding to the found metallicity of J004441.04. Unfortunately, the Vassiliadis & Wood (1994) tracks start at an effective temperature of K and hence do not include the 6250 K of J004441.04. However, the luminosity of post-AGB stars remains approximately constant during their transit through the HR diagram, allowing linear extrapolation between log and log L/ towards lower temperatures. The need for extrapolation to lower temperatures may indicate that J004441.04 is in the beginning stage of the post-AGB phase.
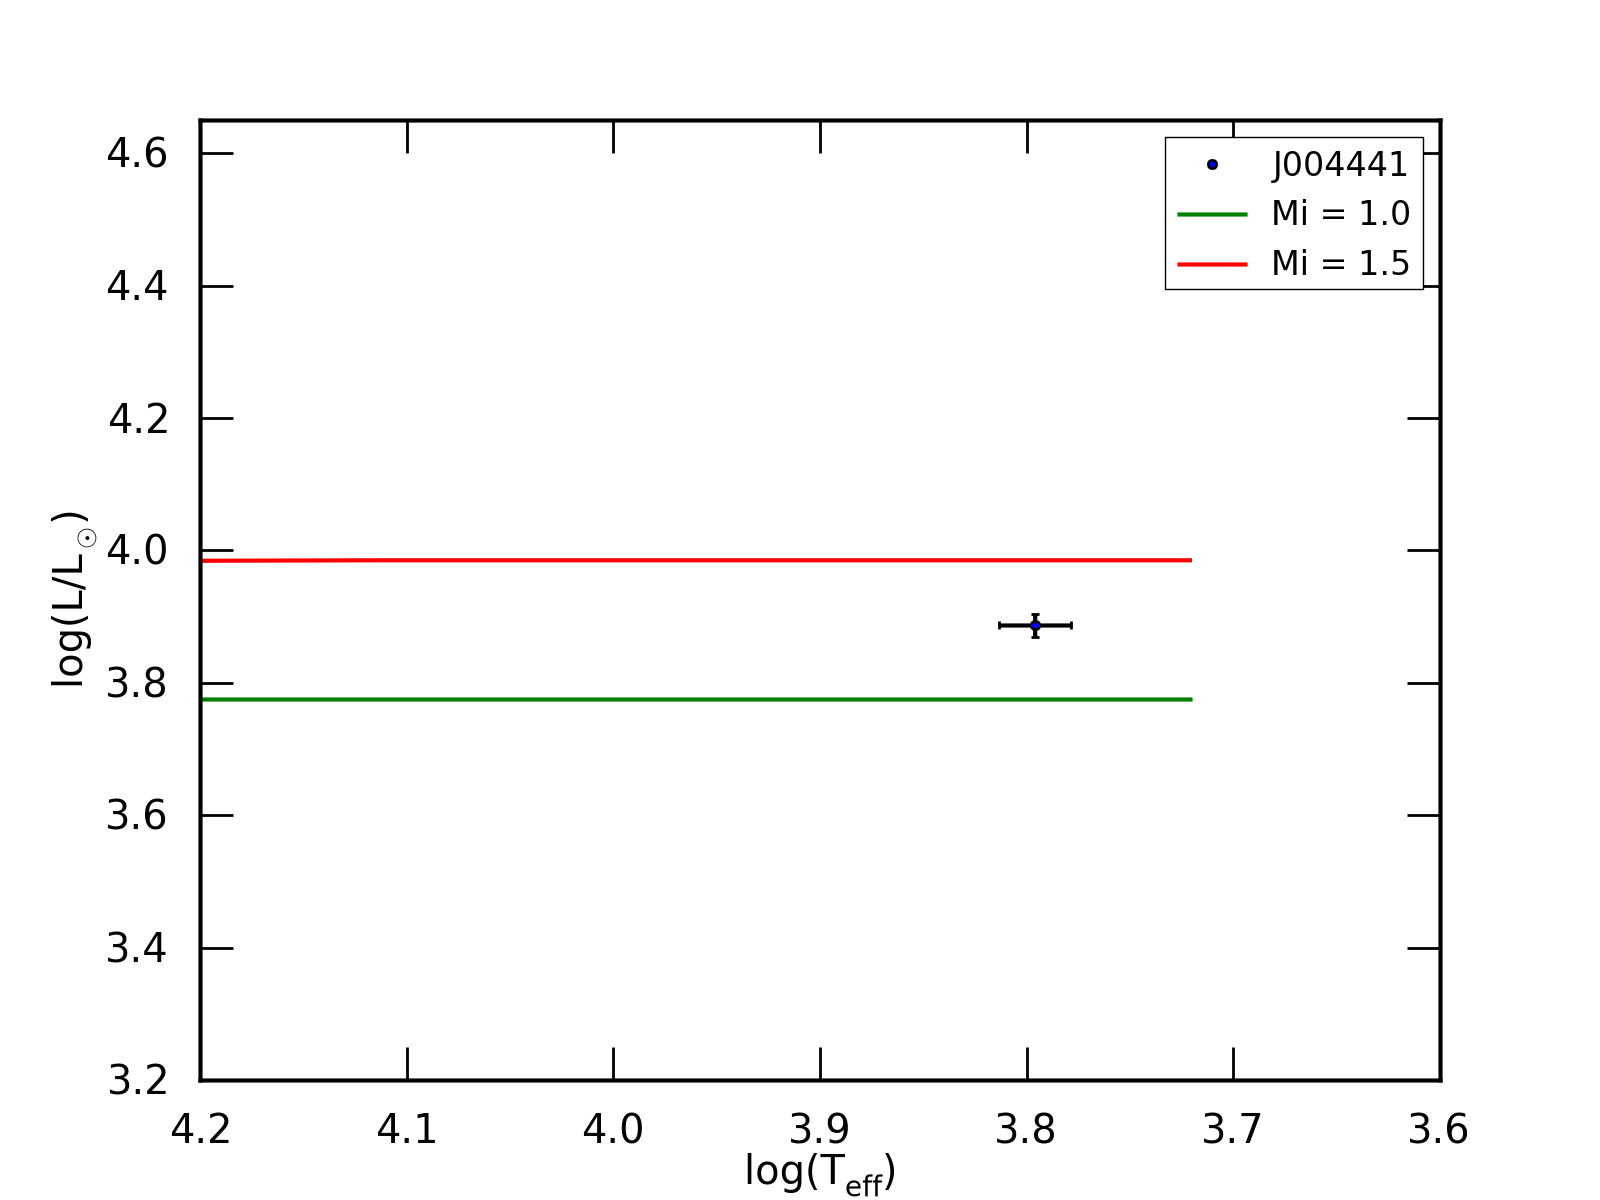
Fig. 13 shows the position of J004441.04 in the HR diagram together with the 1.5 (red line) and 1.0 (green line) evolutionary tracks of Vassiliadis & Wood (1994) for Z = 0.001. Based upon this figure, we estimate an initial mass of M 1.3 for J004441.04. The tracks for Z=0.001 predict a mass for the current post-AGB star of 0.65 M⊙. With the derived Teff and L, the radius is 75 R⊙, and log g = 0.5 also gives M=0.65 M⊙ which is consistent with the tracks.
6 AGB chemical models
We compare the observed abundance results with predictions from two independent stellar evolution codes, with which we calculated models of a 1.3M⊙ star of [Fe/H] = -1.4.
6.1 Mount-Stromlo Evolutionary predictions
One of the AGB evolutionary models was calculated using the same version of the stellar evolution code described in Karakas (2010, and references therein), which uses the Vassiliadis & Wood (1993) mass-loss rate on the AGB, and includes the addition of C and N-rich low-temperature opacities tables from Lederer & Aringer (2009). Convective overshoot is used to induce the third dredge-up (TDU) in the 1.3M⊙, model. The TDU is the inward movement of the convective envelope into regions processed by partial He-burning during a thermal instability (see Herwig 2005, for a recent review). Some form of overshoot is required because low-mass models computed previously with the same code shows little or no TDU for masses at solar metallicity. We calculate one stellar evolution sequence of a 1.3M⊙ model star with a scaled-solar initial abundance pattern with Z = 0.0006.
We include overshoot by extending the position of the base of the convective envelope by 1.0 pressure-scale height. We do not vary this free parameter for this study, noting that the final predicted carbon abundance of log (C) = 8.90 is already 40% higher than the observed carbon abundance of log (C) = 8.76. The final predicted luminosity of the stellar model at the tip of the AGB is 8400 L⊙, which is achieved after 14 thermal pulses. The observed luminosity of 7600 L⊙ is reached after 12 thermal pulses. It would be possible to match the observed luminosity at the tip of the AGB by either increasing the mass-loss rate or increasing the amount of overshoot.
The -process abundance predictions were calculated using the post-processing nucleosynthesis code and full network of 320 species described in Lugaro et al. (2011), with reaction rates taken from the JINA REACLIB library (Cyburt et al. 2010). For the initial composition we used the solar distribution of abundances from Asplund et al. (2009) scaled down to [Fe/H]=1.4. Solar abundances of C, N, O, Ne, Mg, Si, S, Ar, and Fe are the pre-solar nebula values from Table 5 of Asplund et al. (2009); F is the meteoritic value of log = 4.42 from Table 1 of the same paper (chosen because it has a lower uncertainty), and for many of the elements heavier than Fe we use the meteoritic values for the solar abundances (e.g., Sr, Eu, Pb). No -enhancement was used at this stage.
In order to obtain an enrichment of -process elements, we artificially introduce some protons into the top of the He-intershell. Note that this has become standard practice for the simple reason that there is not enough 13C in the H-burning ashes of AGB stars to make it an efficient neutron source. Recent studies investigating the formation of the 13C pocket by various mechanisms have found that the proton abundance in the intershell decreases monotonically (e.g., Cristallo et al. 2009). We apply the assumption that the proton abundance in the intershell decreases monotonically from the envelope value of 0.7 to a minimum value of 10-4 at a given point in mass located below the base of the envelope. We do this in the same manner as described in Alves-Brito et al. (2011) and Kamath et al. (2012).
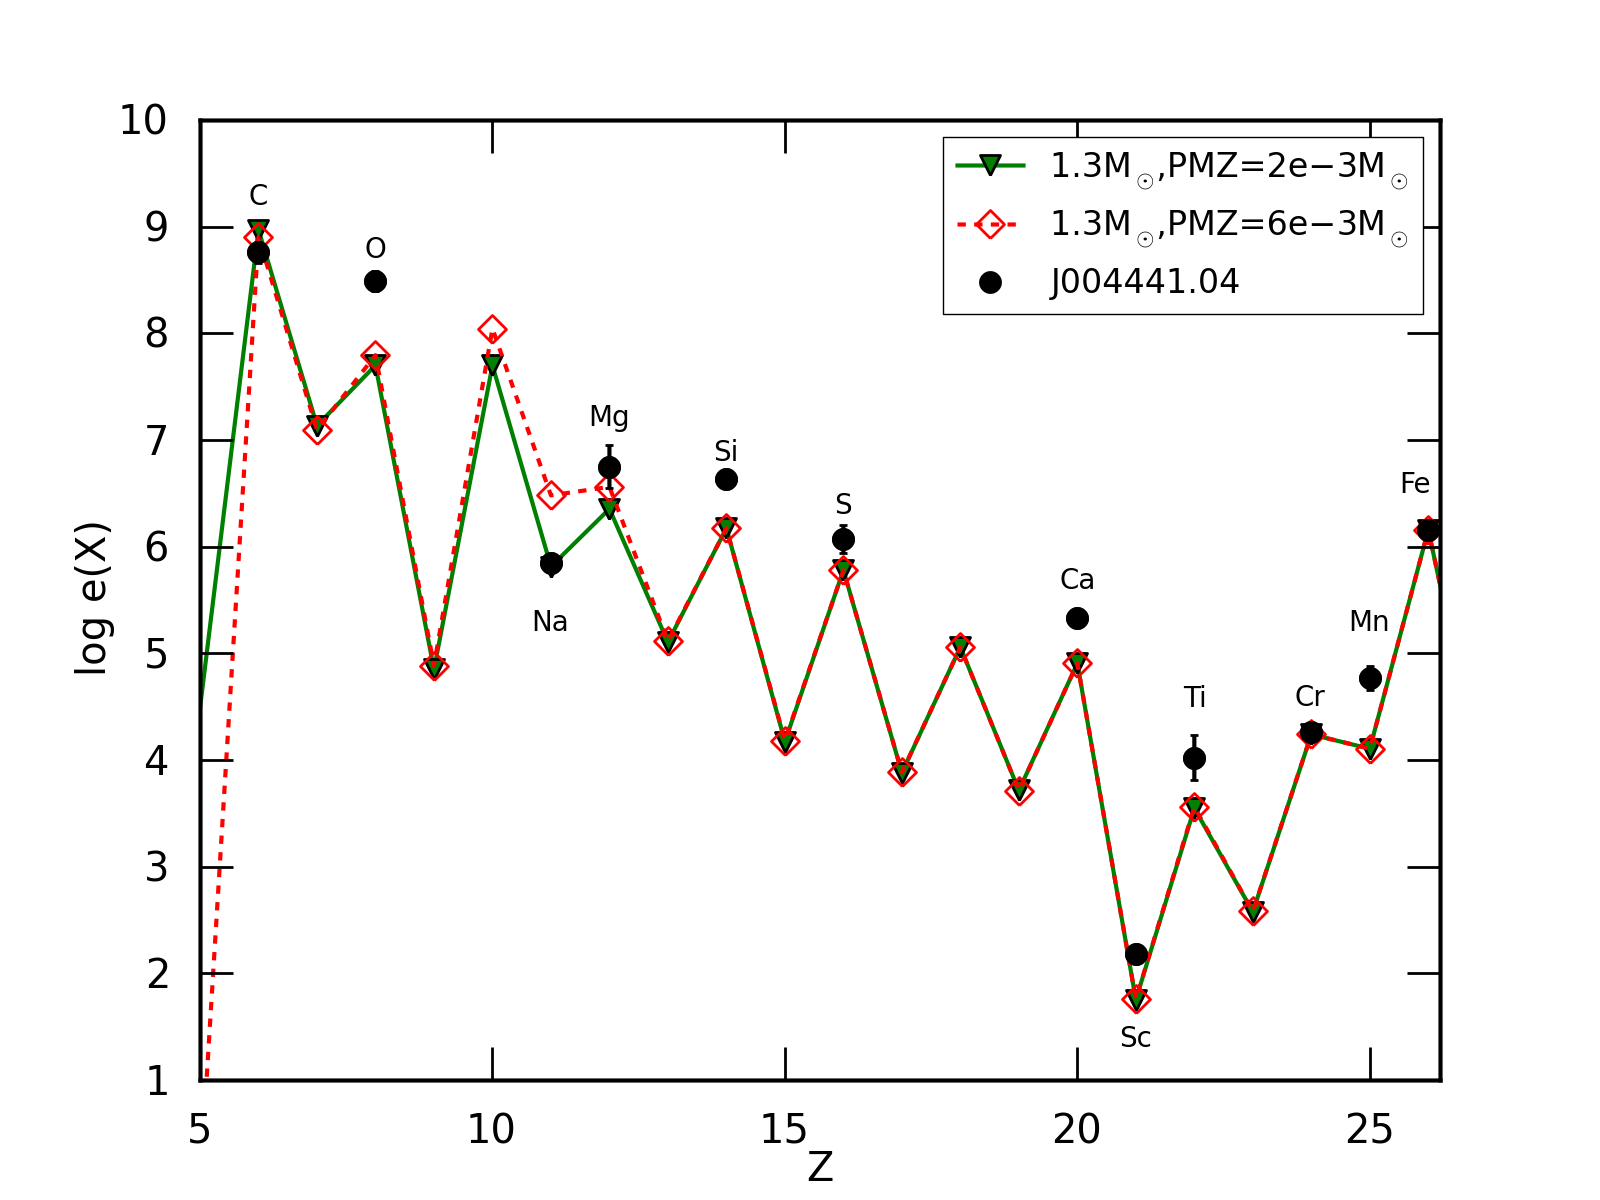
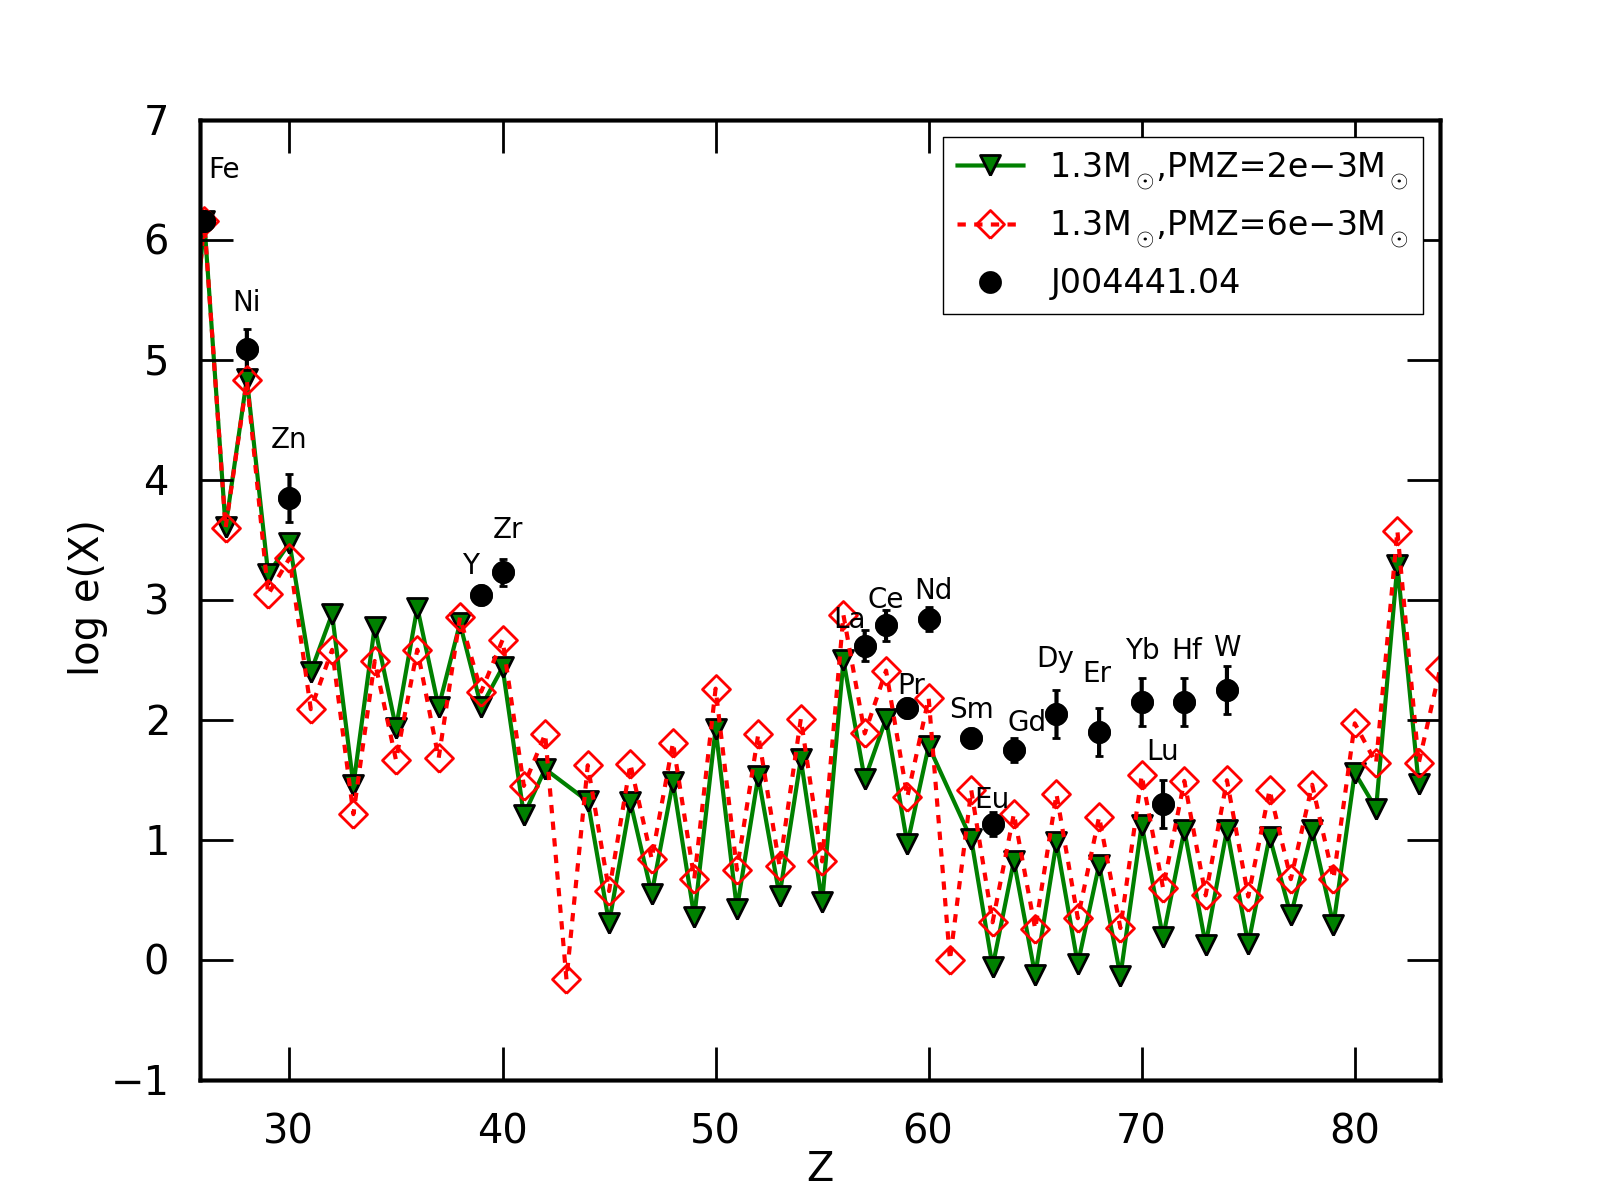
This partially mixed zone (or PMZ) is required in order to facilitate the formation of a 13C pocket which allows neutrons to be released by the13C(,n)O16 reaction (Straniero et al. 1995; Gallino et al. 1998; Goriely & Mowlavi 2000; Herwig 2005). The mass of the proton profile is a free parameter which we set as a constant mass. We adopt two choices for the extent of the partially mixed proton zone: 1) PMZ = 0.002M⊙ (green solid line in Figs. 14 and 15), and 2) PMZ = 0.006 (red dashed line in Figs. 14 and 15).
In Figs. 14 and 15 we show the abundances derived for J004441.04 in this work along with nucleosynthesis predictions from this model. The main point of this comparison is to show that a standard, initial scaled-solar abundance pattern used in the stellar model produce -process overabundances that are not compatible with the derived abundances for J004441.04. The main shortcomings are that:
-
•
While the predicted C overabundance is only 40% higher than the observed value, the predicted O overabundance is too low. This makes that the C/O prediction is 18, which is clearly in contrast to the detected value of 1.90.7. An initial alpha enhanced enrichment of [O/Fe] = +0.4, still makes the final O abundance too small and the high [O/Fe] = 1.14 indicates that the star has dredged-up a considerable amount of oxygen, above the level found in the stellar model of [O/Fe] = 0.35 dex.
-
•
The total overabundances of the s-process nuclei are clearly too low;
- •
Note also that the final predicted 12C/13C ratio is extremely high at . An observational constraint on the isotopic ratios is not possible with the wavelength coverage we have at present, but this should be certainly a priority in our next observational season.
It is plausible that at the low metallicity of [Fe/H] = , J004441.04 evolved from an initially -enhanced composition. This would explain the discrepancy between the predicted and observed Si, S and Ca abundances.
6.2 STAREVOL
To test the uncertainties associated with stellar modeling, an additional 1.3, [Fe/H]=-1.4 model was computed with the STAREVOL code (e.g. Siess 2007, and references therein). The initial composition is slightly different, scaled solar according to Cunha et al. (2006) which is based upon the Asplund et al. (2005) composition with neon enhanced by nearly a factor of 2. This change in the neon abundance was required to reproduce a correct seismic solar structure. As before, we do not consider - enhancement and, with our reference composition, the star has a metallicity Z=0.0044. We use the Reimers mass loss rate with up to the beginning of the AGB phase and then switch to the Vassiliadis & Wood (1993) prescription. The effect of CO opacities is modeled using the analytical fits described in Marigo (2002). Overshooting is also included at the base of the convective envelope but no overshoot from the flash-driven convection zone into the CO core is taken into account. We use the diffusive approach of Herwig et al. (1999) with . Similar to the Stromlo model, this AGB model experiences 15 thermal pulses and the TDU starts at pulse number 6. Considering the small overshoot parameter, the amount of dredged-up material is rather limited and, except for pulse number 9, (where is the ratio of the dredged-up mass to the intershell mass increase between 2 consecutive pulses). At the tip of the AGB, the stellar luminosity is 9400 . As previously mentioned, this value can be lowered if a higher mass loss rate is used.
The STAREVOL network includes 55 species and allows an accurate treatment of the nucleosynthesis up to 37Cl (for details, see Siess & Arnould (2008)). In this code, mixing and nuclear burning are solved simultaneously, once the structure has converged. For the s-process nucleosynthesis, we use the post-processing code as described in Goriely & Siess (2001) which includes about 547 nuclei up to Po with all relevant nuclear (n-, p-, -captures), weak (electron captures, - decays) and electromagnetic (photodisintegration) interactions. Nuclear reaction rates are taken from the updated Nuclear Astrophysics Library of the Brussels University (BRUSLIB, available at http://www.astro.ulb.ac.be/bruslib). Following Goriely & Mowlavi (2000), a PMZ of about half the mass extension of the pulse (i.e some ) is introduced below the convective envelope at the time of the TDU. In this PMZ, the proton profile decreases exponentially from the envelope mass fraction down to allowing for the formation of a substantial 13C pocket.
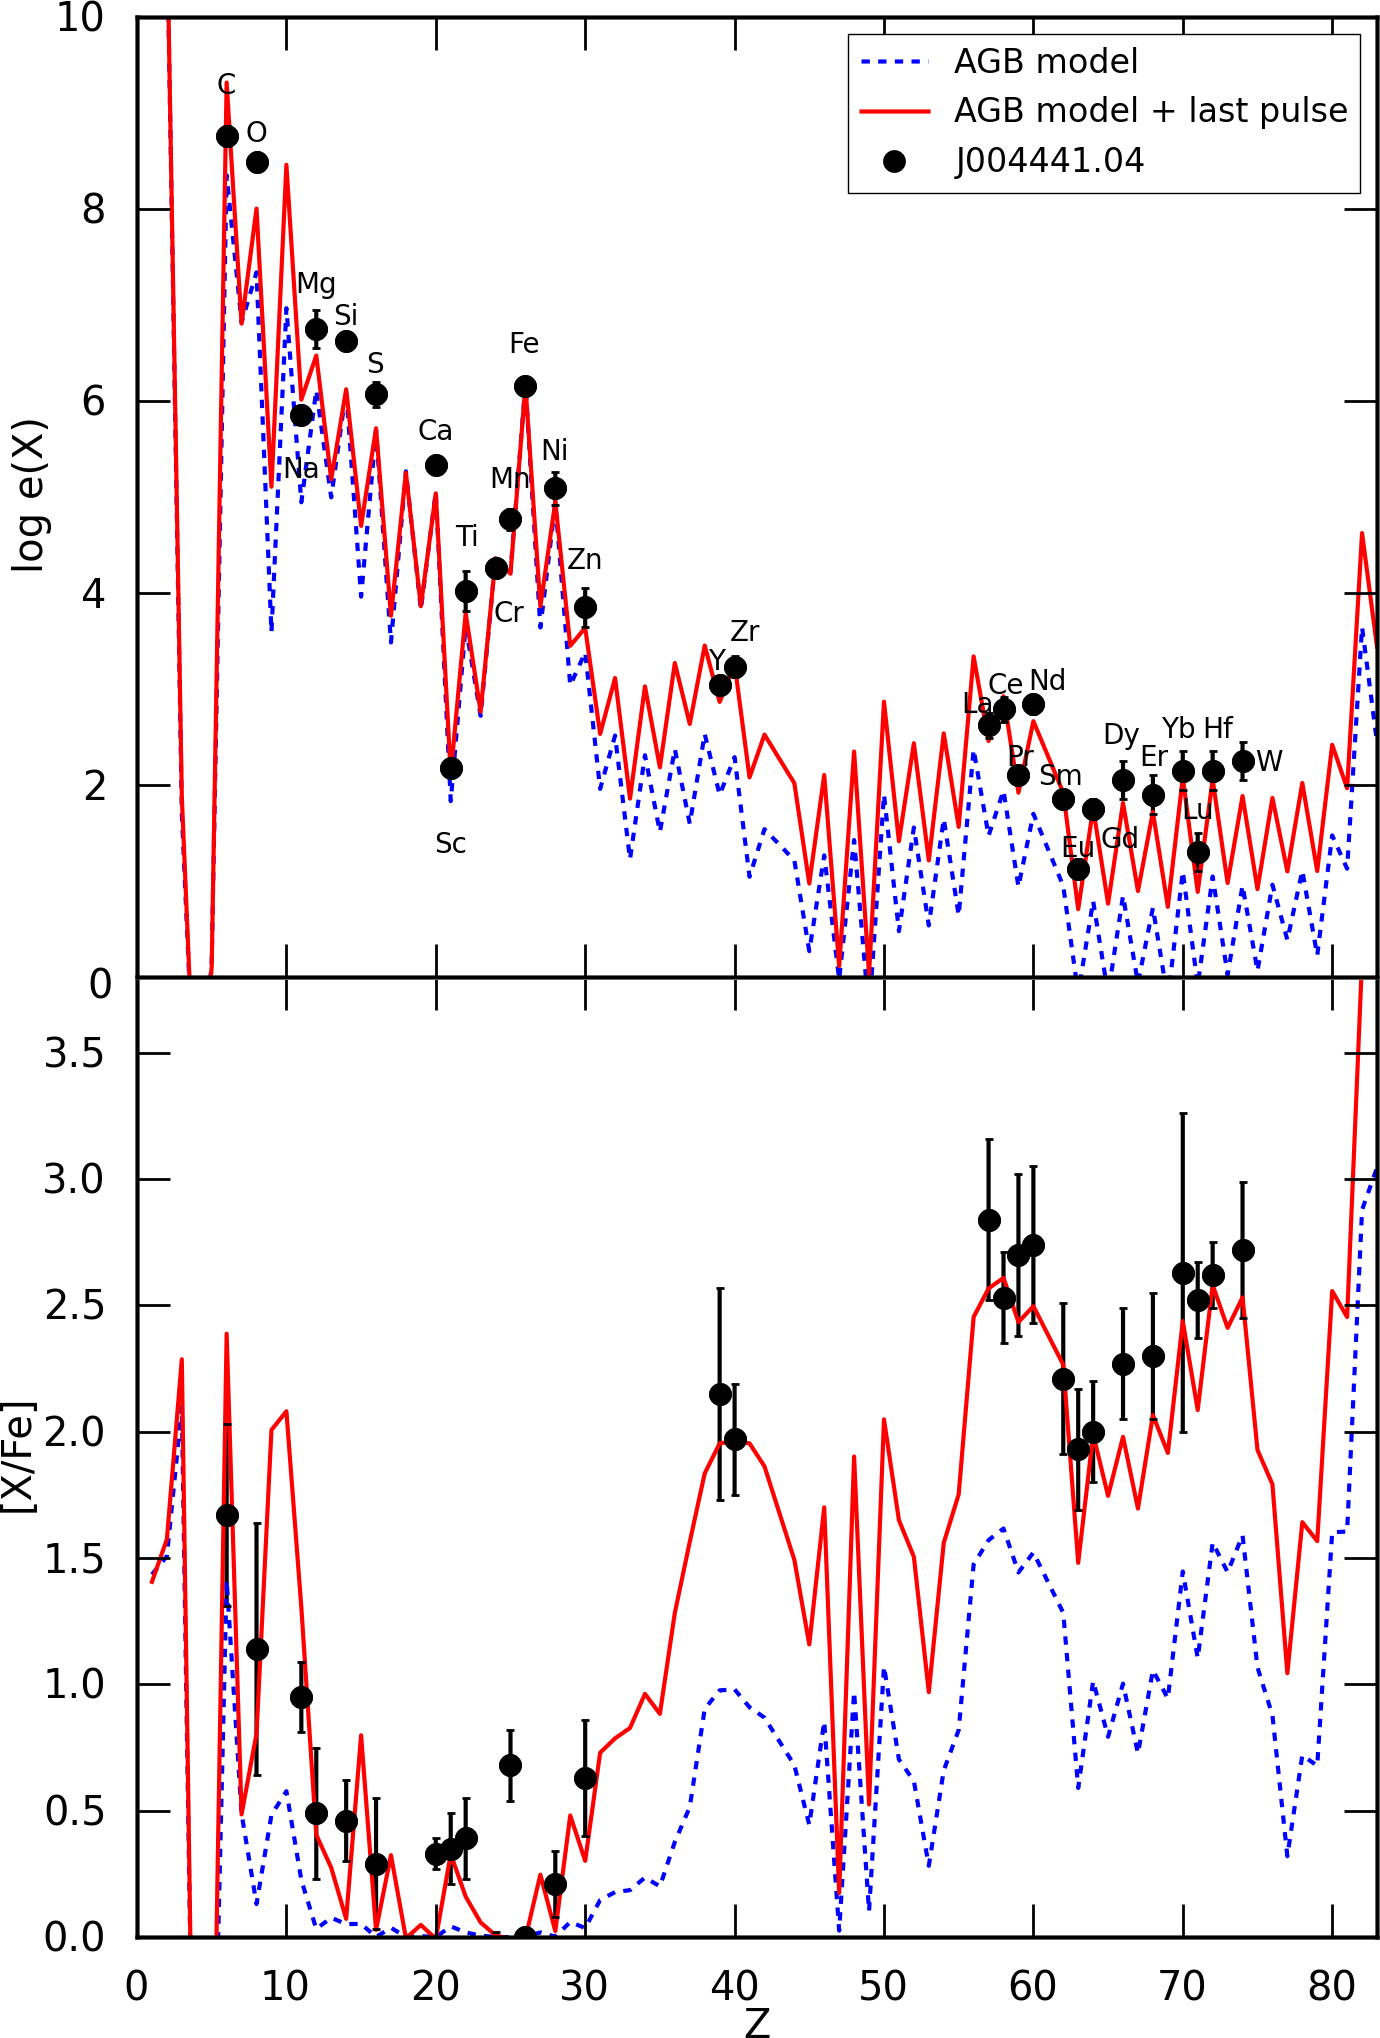
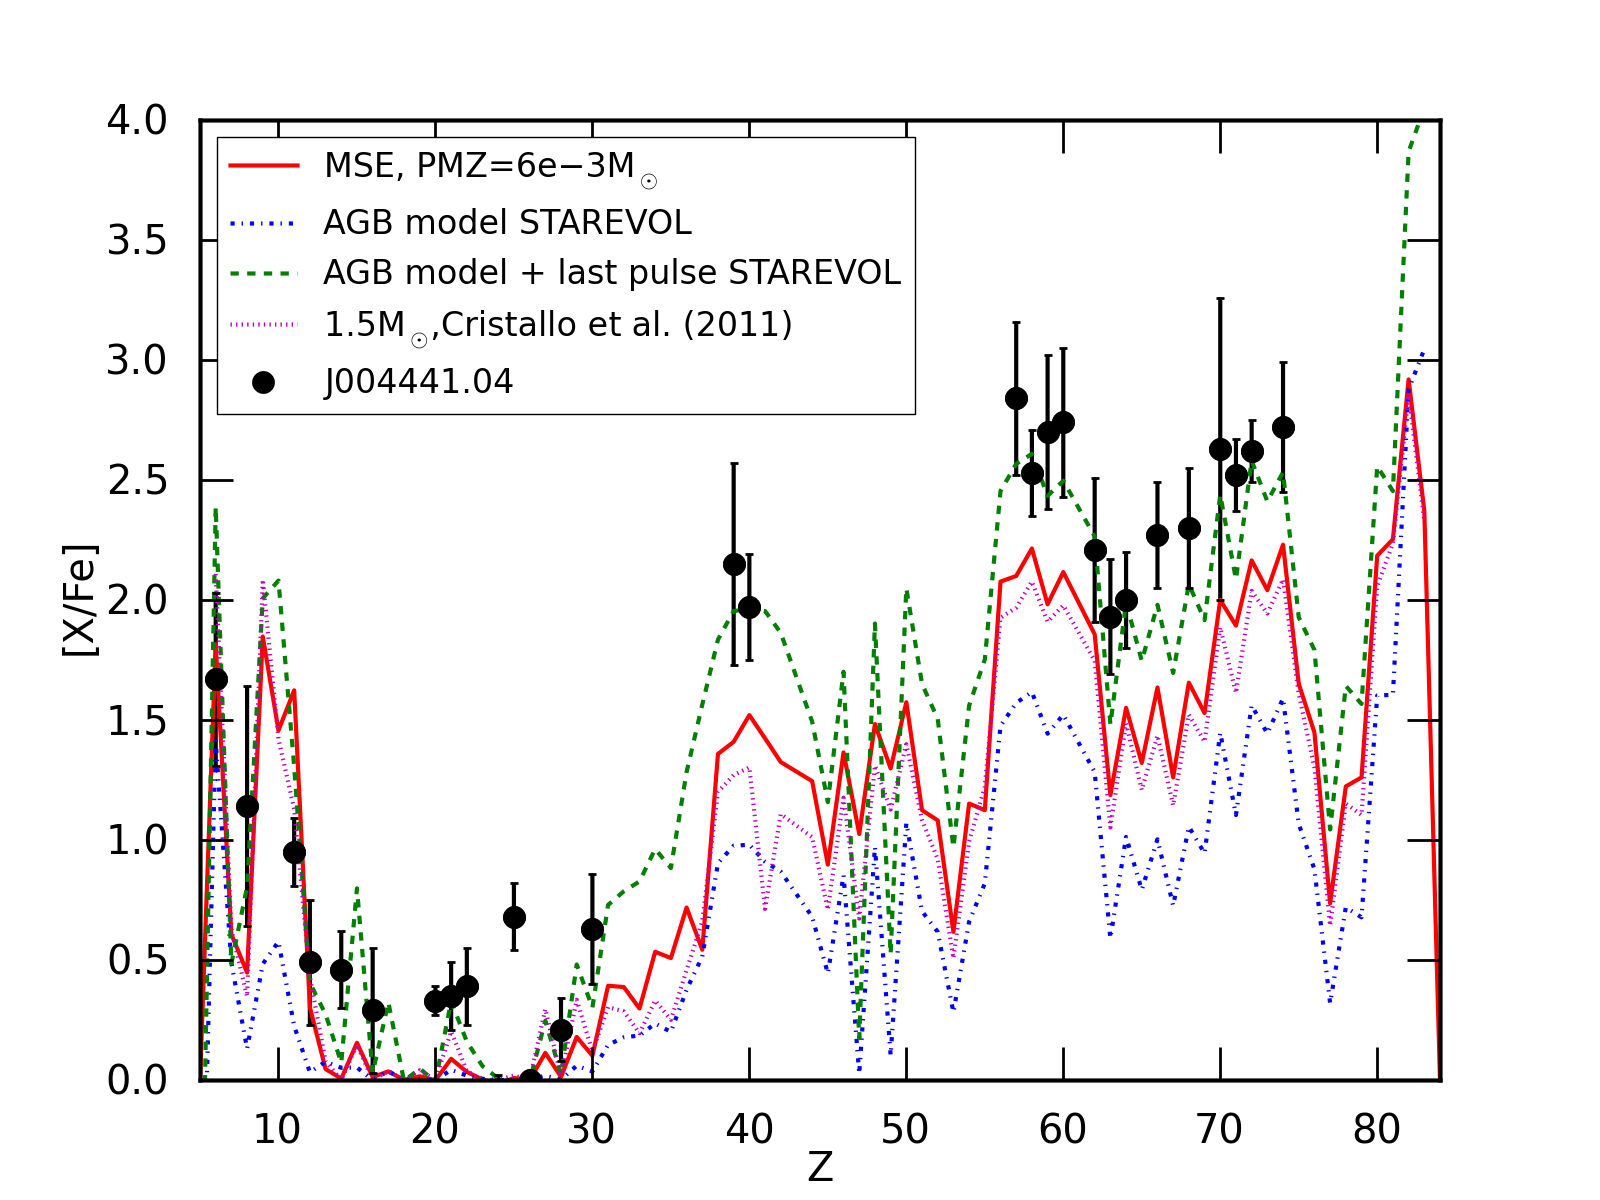
The results of the post-processing calculations are shown by the blue line in Fig.16. The model has the same basic shortcoming, namely an oxygen enrichment ([O/Fe] =0.13) too weak by a factor of 10 but a carbon enrichment ([C/Fe]=1.42) compatible with the observed value. As illustrated in Fig.16, the surface s-process enrichment is also too low with respect to the observations. The s-process abundance pattern itself is in good agreement except again for Pb (see Sect. 6.3).
At the end of the AGB evolutionary phase, we are left with a relatively small convective envelope of less than 0.05 . If we assume that our star model experiences a very last thermal pulse with a deep TDU, a substantial surface pollution follows and a good agreement with the observations can be achieved (red-solid line in Fig.18). This last-pulse modeling corresponds to a post-processing calculation identical to those characterizing the previous TDU episodes but for which the TDU is just assumed to extend to about deep into the C-rich region, i.e about half of the pulse mass is now diluted into the envelope. This improved fit to the observation is due to the small remaining envelope mass ( which limits the dilution of the dredged-up material. The observed distribution of s-process elements can be nicely reproduced except for Pb which, in both simulations, is overproduced (see Sect. 6.3), as classically done in all s-process simulations at low-metallicity (Goriely & Mowlavi 2000). Concerning the light elements, this last dredge-up brings significantly more C, O, F, Ne and Na to the surface. The C is now in disagreement with the observations but on the other hand, we can reproduce the oxygen enrichment, yielding a similar C/O as before. We also note that the underabundance of the -elements Si, S and Mn remains. It is interesting to see how the use of different abundances units, namely and [X/Fe] can be misleading. Finally, note that within the s-process model adopted here, the partial mixing of protons into the C-rich region also leads to a significant production of F, Ne and Na (see e.g Goriely & Mowlavi (2000)) which is also the case for the Mount-Stromlo models as shown in Fig. 18. The estimated abundance of Na by the models is seen in Fig. 18 to be in rather good agreement with observation. It would be extremely valuable to confirm observationally the predicted F overproduction of about 2 dex. Unfortunately, at these photospheric temperatures, F has no suitable lines in the sampled spectrum and its abundance can not be quantified.
6.3 Pb discrepancy
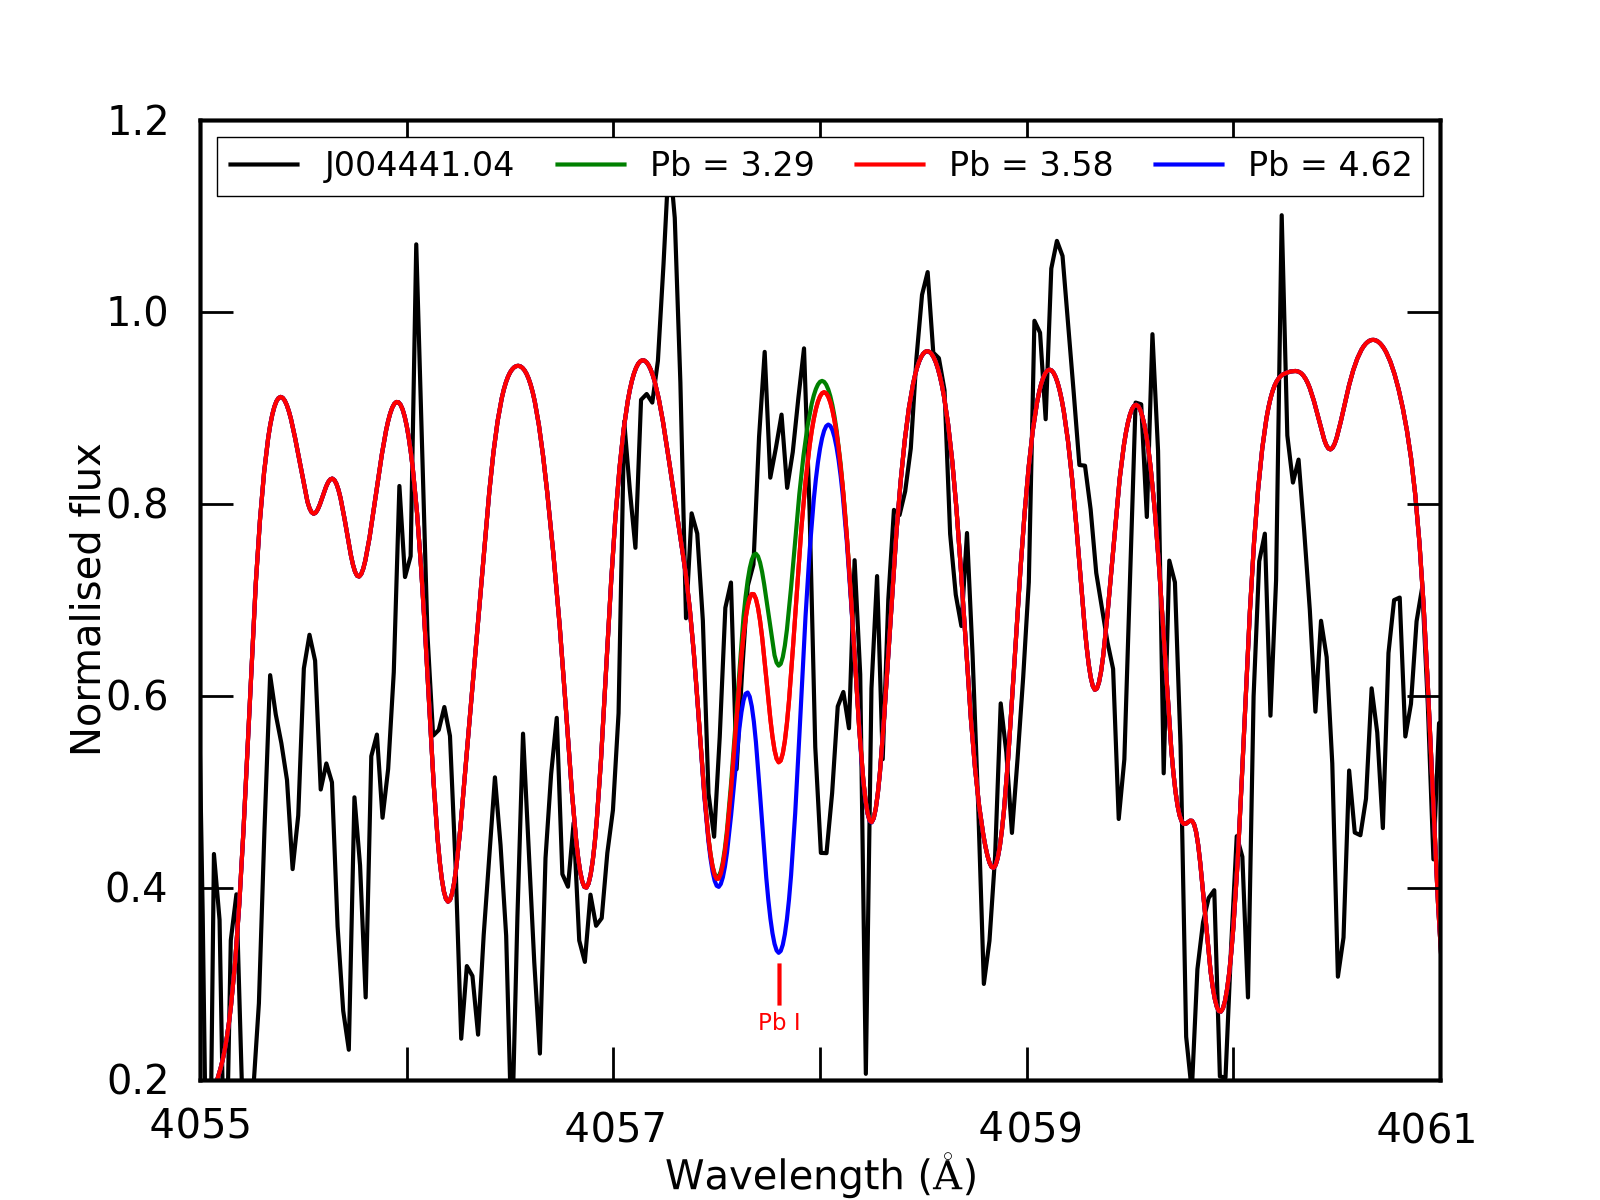
Figs. 15, 16 and 18 clearly show that current stellar evolution codes predict strong Pb overabundances for J004441.04. The strongest predicted Pb line in our sampled spectral range is 4057.807 Å. Unfortunately, this spectral region has a low S/N preventing an accurate Pb abundance determination. We focused on this spectral region and looked carefully on the three exposures. We obtained a weighted average of the three UVES spectra and then confronted this final spectrum with spectral synthesis models. We used the Pb abundances predicted by the chemical models in Fig. 17. The black spectrum is the normalised weighted mean spectrum of J004441.04, the green spectrum displays the predicted Pb abundance of the Mount-Stromlo model with PMZ = , the red and blue spectrum represent the STAREVOL predictions with the blue spectrum the model with a last thermal pulse. Although the stellar spectrum is of poor quality, it is clear from Fig. 17 that the predicted strong line is not present in the stellar spectrum. From Fig. 17 we estimate an upper Pb abundance of 3.00 for J004441.04. Unfortunately we do not have a spectrum of IRAS06530 in this spectral domain. In the late thermal pulse scenario (Fig. 18), the predicted Pb abundance becomes very large, which is incompatible with the detected spectrum. To reduce the production of Pb, the neutron in the PMZ production must be reduced. Partial pollution of the 13C pocket by 14N induced by rotational mixing (e.g. Herwig et al. 2003; Siess et al. 2004) may be needed to solve this problem but this will need a detailed investigation which is outside the scope of this paper.
7 Discussion and Conclusion
We presented a detailed analysis of J004441.04, the only known 21 m object of the SMC. This metal poor star ([Fe/H] = 1.34 0.32), turns out to be among the most s-process enriched stars known to date while displaying only a moderate C/O ratio of 1.9 0.7. The atmospheric parameters (Teff = 6250 250, log g = 0.5 0.5) combined with the luminosity of 7600 200 as well as the pulsation period of 97.6 0.3 days, show that we witness the post-AGB phase of a star of low initial mass. This initial mass is estimated to be 1.3 M⊙. Our findings on an extra-Galactic source corroborate the conclusion that 21 m stars are post-Carbon stars. Although of lower metallicity, the object displays very similar overabundances as the most s-process rich post-AGB star known in our Galaxy (IRAS06530-0213).
Our AGB model predictions are based on model calculations which include a forced overshoot of the convective boundary as well as an artificial inclusion of a proton profile into the intershell. We used two independent codes for these predictions. For comparsion, we also included in Fig. 18 the nearest model in the coarser grid of models by Cristallo et al. (2011) (1.5 M⊙, Z = 0.001) which yields similar discrepancy like our two models.
While the predicted C overabundance is compatible with the observations, the predicted O abundance is significantly lower resulting in a predicted C/O ratio of 20 which is clearly too high. More oxygen could be dredged-up in the models, if one includes additional overshooting below the thermal pulse, as shown by Herwig (2000).
While the models fit the s-process distribution well, as depicted in Fig. 18, the absolute abundances are not well matched. In our late thermal pulse scenario, we assume that a thermal pulse occurred with dredge-up and a limited dillution by the remaining reduced envelope mass. In this model, the very high overabundances are matched better. A noticeable exception is that the predicted Pb abundance is much larger than the detected upper limit (Fig. 17). A higher S/N spectrum in the region of Pb lines is needed to better quantify the Pb abundance which would yield an ever stronger test on the nucleosynthesis but our spectrum is incompatible with such high Pb abundance. With the data at hand, no isotopic ratio could be determined yet but the predicted 12C/13C of 1800 is extremely high. The nearest model in the coarser grid of models by Cristallo et al. (2011) yields similar discrepancy with even a higher predicted C/O ratio and 12C/13C values.
Our calculations demonstrate that there is only a weak dependency of the theoretical predictions on the adopted stellar evolution code !
It is interesting to compare the abundance pattern of J004441.04 with the patterns observed in peculiar metal poor stars like the CEMP- stars, that is, a carbon-enhanced metal-poor star with enrichments in both and -process elements (see discussions in Beers & Christlieb 2005; Jonsell et al. 2006; Sneden et al. 2008; Lugaro et al. 2011). According to the definition given in Jonsell et al. (2006), CEMP- stars have [Eu/Fe]1 and [Ba/Eu]0. The post-AGB star J004441.04 satisfies all of these criteria. It is carbon rich with [C/Fe] = 1.67 and [Ba/Eu] , using the [Ba/Fe] = 2.67 estimated earlier. The estimated Ba (or observed La, which is a good proxy for elements at the second -process peak) and Eu abundances put this star well into the region of the [Eu/Fe]–[Ba/Fe] plane occupied by the CEMP- stars (see Fig. 5 from Lugaro et al. 2011). Abundance wise, J004441.04 could be seen as a more metal rich analogue of the CEMP- stars. However, unlike many of the stars within the CEMP- class, the distribution of heavy elements in J004441.04 is similar to that of a pure s-process, except for the anomalously low Pb abundance. What is unusual about J004441.04 is how the star obtained such large enrichments of heavy elements, while keeping the C/O ratio low.
It is fair to say that many of the chemical, physical and pulsational properties of the interesting SMC post-AGB star J004441.04 are, as yet, unaccounted for by our model predictions. This study is the first of a series in which we aim at a systematic study of post-AGB stars in the Magellanic clouds. These objects with constrained distances will provide unprecedented and systematic tests of the AGB model predictions, complementary to the limited study of AGB stars (e.g. de Laverny et al. 2006; Abia et al. 2011) for which much lower overabundances are detected. The ultimate aim of this programme is to make progress in the understanding of the complex interplay between mixing, nucleosynthesis and mass-loss which characterise the final evolution of solar-like stars.
Acknowledgements.
HVW and KDS acknowledge financial support from the Research Council of K.U.Leuven under grant GOA/2008/04 and from the Scientific Fund of Flanders (FWO) under the grants G.0703.08 and G.0470.07. AIK is grateful for the support of the NCI National Facility at the ANU. AIK is an ARC Future Fellow and is supported under grant FT10100475. LS and SG are FNRS research associates. The authors thank Chris Sneden for his comments on the manuscript.References
- Abia et al. (2011) Abia, C., Cunha, K., Cristallo, S., et al. 2011, ApJ, 737, L8
- Abia et al. (2008) Abia, C., de Laverny, P., & Wahlin, R. 2008, A&A, 481, 161
- Abia et al. (2002) Abia, C., Domínguez, I., Gallino, R., et al. 2002, ApJ, 579, 817
- Alves-Brito et al. (2011) Alves-Brito, A., Karakas, A. I., Yong, D., Meléndez, J., & Vásquez, S. 2011, A&A, 536, A40
- Angelou et al. (2011) Angelou, G. C., Church, R. P., Stancliffe, R. J., Lattanzio, J. C., & Smith, G. H. 2011, ApJ, 728, 79
- Asplund et al. (2005) Asplund, M., Grevesse, N., & Sauval, A. J. 2005, in Astronomical Society of the Pacific Conference Series, Vol. 336, Cosmic Abundances as Records of Stellar Evolution and Nucleosynthesis, ed. T. G. Barnes III & F. N. Bash, 25
- Asplund et al. (2009) Asplund, M., Grevesse, N., Sauval, A. J., & Scott, P. 2009, ARA&A, 47, 481
- Beers & Christlieb (2005) Beers, T. C. & Christlieb, N. 2005, ARA&A, 43, 531
- Bolatto et al. (2007) Bolatto, A. D., Simon, J. D., Stanimirović, S., et al. 2007, ApJ, 655, 212
- Busso et al. (2010) Busso, M., Palmerini, S., Maiorca, E., et al. 2010, ApJ, 717, L47
- Cardelli et al. (1989) Cardelli, J. A., Clayton, G. C., & Mathis, J. S. 1989, ApJ, 345, 245
- Castelli & Kurucz (2004) Castelli, F. & Kurucz, R. L. 2004, ArXiv Astro-ph/0405087
- Church et al. (2009) Church, R. P., Cristallo, S., Lattanzio, J. C., et al. 2009, PASA, 26, 217
- Coelho et al. (2005) Coelho, P., Barbuy, B., Meléndez, J., Schiavon, R. P., & Castilho, B. V. 2005, A&A, 443, 735
- Cristallo et al. (2011) Cristallo, S., Piersanti, L., Straniero, O., et al. 2011, ArXiv e-prints
- Cristallo et al. (2009) Cristallo, S., Straniero, O., Gallino, R., et al. 2009, ApJ, 696, 797
- Cunha et al. (2006) Cunha, K., Hubeny, I., & Lanz, T. 2006, ApJ, 647, L143
- Cutri et al. (2003) Cutri, R. M., Skrutskie, M. F., van Dyk, S., et al. 2003, VizieR Online Data Catalog, 2246, 0
- Cyburt et al. (2010) Cyburt, R. H., Amthor, A. M., Ferguson, R., et al. 2010, ApJS, 189, 240
- de Laverny et al. (2006) de Laverny, P., Abia, C., Domínguez, I., et al. 2006, A&A, 446, 1107
- Dekker et al. (2000) Dekker, H., D’Odorico, S., Kaufer, A., Delabre, B., & Kotzlowski, H. 2000, in Society of Photo-Optical Instrumentation Engineers (SPIE) Conference Series, Vol. 4008, Society of Photo-Optical Instrumentation Engineers (SPIE) Conference Series, ed. M. Iye & A. F. Moorwood, 534–545
- Fouqué et al. (2000) Fouqué, P., Chevallier, L., Cohen, M., et al. 2000, A&AS, 141, 313
- Gallino et al. (1998) Gallino, R., Arlandini, C., Busso, M., et al. 1998, ApJ, 497, 388
- Giridhar et al. (1997) Giridhar, S., Ferro, A., & Parrao, L. 1997, PASP, 109, 1077
- Gordon et al. (2003) Gordon, K. D., Clayton, G. C., Misselt, K. A., Landolt, A. U., & Wolff, M. J. 2003, ApJ, 594, 279
- Goriely & Mowlavi (2000) Goriely, S. & Mowlavi, N. 2000, A&A, 362, 599
- Goriely & Siess (2001) Goriely, S. & Siess, L. 2001, A&A, 378, L25
- Habing & Olofsson (2003) Habing, H. J. & Olofsson, H., eds. 2003, Asymptotic giant branch stars
- Herwig (2000) Herwig, F. 2000, A&A, 360, 952
- Herwig (2005) Herwig, F. 2005, ARA&A, 43, 435
- Herwig et al. (1999) Herwig, F., Blöcker, T., Langer, N., & Driebe, T. 1999, A&A, 349, L5
- Herwig et al. (2003) Herwig, F., Langer, N., & Lugaro, M. 2003, ApJ, 593, 1056
- Hilditch et al. (2005) Hilditch, R. W., Howarth, I. D., & Harries, T. J. 2005, MNRAS, 357, 304
- Hrivnak et al. (2008) Hrivnak, B. J., Volk, K., Geballe, T. R., & Kwok, S. 2008, in IAU Symposium, Vol. 251, IAU Symposium, ed. S. Kwok & S. Sandford, 213–214
- Hrivnak et al. (2009) Hrivnak, B. J., Volk, K., & Kwok, S. 2009, ApJ, 694, 1147
- Jonsell et al. (2006) Jonsell, K., Barklem, P. S., Gustafsson, B., et al. 2006, A&A, 451, 651
- Kamath et al. (2012) Kamath, D., Karakas, A. I., & Wood, P. R. 2012, ApJ, 746, 20
- Kamath et al. (2011) Kamath, D., Wood, P., Van Winckel, H., & van Aarle, E. 2011, in 9th Pacific Rim Conference on Stellar Astrophysics, ed. , ASP conference series, in press
- Kamath et al. (2010) Kamath, D., Wood, P. R., Soszyński, I., & Lebzelter, T. 2010, MNRAS, 408, 522
- Karakas (2010) Karakas, A. I. 2010, MNRAS, 403, 1413
- Karakas et al. (2010) Karakas, A. I., Campbell, S. W., & Stancliffe, R. J. 2010, ApJ, 713, 374
- Kiselman (2002) Kiselman, D. 2002, Highlights of Astronomy, 12, 429
- Kobayashi et al. (2011) Kobayashi, C., Karakas, A. I., & Umeda, H. 2011, MNRAS, 414, 3231
- Kupka et al. (1999) Kupka, F., Piskunov, N., Ryabchikova, T. A., Stempels, H. C., & Weiss, W. W. 1999, A&AS, 138, 119
- Kwok et al. (1989) Kwok, S., Volk, K. M., & Hrivnak, B. J. 1989, ApJ, 345, L51
- Lambert et al. (1983) Lambert, D. L., Luck, R. E., & Bond, H. E. 1983, PASP, 95, 413
- Lederer & Aringer (2009) Lederer, M. T. & Aringer, B. 2009, A&A, 494, 403
- Lobel (2006) Lobel, A. 2006, in IAU Joint Discussion, Vol. 4, IAU Joint Discussion
- Luck et al. (1998) Luck, R. E., Moffett, T. J., Barnes, III, T. G., & Gieren, W. P. 1998, AJ, 115, 605
- Lugaro et al. (2011) Lugaro, M., Karakas, A. I., Stancliffe, R. J., & Rijs, C. 2011, ArXiv e-prints
- Marigo (2002) Marigo, P. 2002, A&A, 387, 507
- Posch et al. (2004) Posch, T., Mutschke, H., & Andersen, A. 2004, ApJ, 616, 1167
- Reddy et al. (2002) Reddy, B. E., Lambert, D. L., Gonzalez, G., & Yong, D. 2002, ApJ, 564, 482
- Reyniers & Van Winckel (2003) Reyniers, M. & Van Winckel, H. 2003, A&A, 408, L33
- Reyniers et al. (2004) Reyniers, M., Van Winckel, H., Gallino, R., & Straniero, O. 2004, A&A, 417, 269
- Richter et al. (1987) Richter, O.-G., Tammann, G. A., & Huchtmeier, W. K. 1987, A&A, 171, 33
- Romano et al. (2010) Romano, D., Karakas, A. I., Tosi, M., & Matteucci, F. 2010, A&A, 522, A32
- Schlegel et al. (1998) Schlegel, D. J., Finkbeiner, D. P., & Davis, M. 1998, ApJ, 500, 525
- Siess (2007) Siess, L. 2007, A&A, 476, 893
- Siess & Arnould (2008) Siess, L. & Arnould, M. 2008, A&A, 489, 395
- Siess et al. (2003) Siess, L., Goriely, S., & Langer, N. 2003, PASA, 20, 371
- Siess et al. (2004) Siess, L., Goriely, S., & Langer, N. 2004, A&A, 415, 1089
- Sneden et al. (2008) Sneden, C., Cowan, J. J., & Gallino, R. 2008, ARA&A, 46, 241
- Sneden (1973) Sneden, C. A. 1973, PhD thesis, The Univerisity of Texas at Austin.
- Stancliffe et al. (2007) Stancliffe, R. J., Glebbeek, E., Izzard, R. G., & Pols, O. R. 2007, A&A, 464, L57
- Straniero et al. (1995) Straniero, O., Gallino, R., Busso, M., et al. 1995, ApJ, 440, L85
- Szymanski (2005) Szymanski, M. K. 2005, Acta Astron., 55, 43
- Udalski et al. (1997) Udalski, A., Kubiak, M., & Szymanski, M. 1997, Acta Astron., 47, 319
- van Aarle et al. (2011) van Aarle, E., van Winckel, H., Lloyd Evans, T., et al. 2011, A&A, 530, A90
- Van Winckel (2003) Van Winckel, H. 2003, ARA&A, 41, 391
- Van Winckel & Reyniers (2000) Van Winckel, H. & Reyniers, M. 2000, A&A, 354, 135
- Vassiliadis & Wood (1993) Vassiliadis, E. & Wood, P. R. 1993, ApJ, 413, 641
- Vassiliadis & Wood (1994) Vassiliadis, E. & Wood, P. R. 1994, ApJS, 92, 125
- Volk et al. (2011) Volk, K., Hrivnak, B. J., Matsuura, M., et al. 2011, ApJ, 735, 127
- Wood (1976) Wood, P. R. 1976, MNRAS, 174, 531
- Zaritsky et al. (2002) Zaritsky, D., Harris, J., Thompson, I. B., Grebel, E. K., & Massey, P. 2002, AJ, 123, 855
| ion | Z | wavelength (Å) | EP(eV) | log gf | EW (mÅ) |
|---|---|---|---|---|---|
| C I | 6 | 6655.517 | 8.54 | -1.94 | 56.0 |
| 6012.225 | 8.64 | -2.00 | 48.8 | ||
| 6014.834 | 8.64 | -1.59 | 71.0 | ||
| 6016.444 | 8.64 | -1.83 | 74.6 | ||
| 5551.578 | 8.64 | -1.90 | 53.2 | ||
| 6002.987 | 8.65 | -2.17 | 39.3 | ||
| O I | 8 | 6155.971 | 10.74 | -0.67 | 18.7 |
| 6454.444 | 10.74 | -1.08 | 9.7 | ||
| 6453.640 | 10.74 | -1.30 | 7.3 | ||
| Na I | 11 | 6154.230 | 2.10 | -1.56 | 11.4 |
| 5688.210 | 2.10 | -0.42 | 74.7 | ||
| Mg I | 12 | 5711.100 | 4.34 | -1.75 | 38.0 (SS) |
| Si I | 14 | 6237.330 | 5.61 | -0.53 | 35.6 |
| 5948.550 | 5.08 | -1.22 | 22.5 | ||
| S I | 16 | 6757.160 | 7.87 | -0.20 | 20.7 |
| 6748.790 | 7.87 | -0.35 | 10.5 | ||
| Ca I | 20 | 6102.727 | 1.88 | -0.80 | 59.7 |
| 6449.820 | 2.52 | -0.62 | 33.3 | ||
| 5590.130 | 2.52 | -0.74 | 26.6 | ||
| 6439.075 | 2.53 | 0.39 | 116.4 | ||
| Sc II | 21 | 6604.600 | 1.36 | -1.23 | 98.6 |
| 5552.240 | 1.45 | -2.08 | 15.3 | ||
| 5667.153 | 1.50 | -1.21 | 68.3 | ||
| Ti II | 22 | 4798.521 | 1.08 | -2.67 | 84.5 |
| 6606.980 | 2.06 | -2.85 | 29.0 | ||
| 5010.212 | 3.10 | -1.30 | 76.7 | ||
| Cr II | 24 | 5510.730 | 3.83 | -2.48 | 18.2 |
| 5310.700 | 4.07 | -2.28 | 15.8 | ||
| 5502.090 | 4.17 | -1.99 | 22.3 | ||
| Mn I | 25 | 6021.800 | 3.07 | 0.03 | 39.6 |
| 6016.650 | 3.07 | -0.22 | 33.1 | ||
| Fe I | 26 | 5198.711 | 2.22 | -2.14 | 33.3 |
| 5049.820 | 2.28 | -1.35 | 80.7 | ||
| 6421.351 | 2.28 | -2.01 | 33.4 | ||
| 6252.555 | 2.40 | -1.72 | 41.7 | ||
| 6191.558 | 2.43 | -1.42 | 60.1 | ||
| 6136.596 | 2.45 | -1.40 | 65.5 | ||
| 6230.723 | 2.56 | -1.28 | 59.2 | ||
| 6137.692 | 2.59 | -1.40 | 47.5 | ||
| 5281.790 | 3.04 | -0.83 | 76.9 | ||
| 5324.179 | 3.24 | -0.10 | 108.5 | ||
| 5615.644 | 3.33 | 0.05 | 118.6 | ||
| 6400.001 | 3.60 | -0.29 | 66.2 | ||
| 6411.649 | 3.65 | -0.66 | 37.7 | ||
| 5445.042 | 4.39 | 0.04 | 40.0 | ||
| 6024.058 | 4.55 | -0.06 | 29.5 | ||
| 6419.950 | 4.73 | -0.09 | 15.3 | ||
| 5572.842 | 3.40 | -0.28 | 91.9 | ||
| Fe II | 26 | 5991.368 | 3.15 | -3.56 | 54.7 |
| 6084.099 | 3.20 | -3.80 | 48.5 | ||
| 6147.741 | 3.89 | -2.73 | 66.1 | ||
| 6383.721 | 5.55 | -2.14 | 17.6 | ||
| Ni I | 28 | 6767.780 | 1.83 | -2.17 | 11.6 |
| 5035.370 | 3.63 | 0.29 | 35.1 | ||
| 6772.320 | 3.66 | -0.98 | 5.2 | ||
| 5694.990 | 4.09 | -0.61 | 5.1 | ||
| Zn I | 30 | 4810.540 | 4.08 | -0.17 | 72.5 (SS) |
| Y II | 39 | 5289.815 | 1.03 | -1.85 | 144.7 |
| 5728.890 | 1.84 | -1.12 | 149.4 | ||
| Zr II | 40 | 5124.982 | 1.53 | -1.50 | 117.2 |
| 5477.822 | 1.83 | -1.40 | 86.2 | ||
| La II | 57 | 5482.268 | 0.00 | -2.06 | 158.9 |
| 5712.391 | 0.17 | -1.96 | 147.7 | ||
| 5936.210 | 0.17 | -2.07 | 118.5 | ||
| 5880.633 | 0.24 | -1.92 | 158.3 | ||
| 6146.523 | 0.24 | -2.47 | 83.2 | ||
| 5062.918 | 0.77 | -1.72 | 91.9 | ||
| 6126.075 | 1.25 | -1.19 | 120.6 | ||
| 5566.925 | 2.38 | -1.00 | 51.1 | ||
| 6399.030 | 2.65 | -0.52 | 70.2 | ||
| Ce II | 58 | 5031.986 | 1.41 | -0.90 | 62.5 |
| 5613.694 | 1.42 | -1.00 | 67.6 | ||
| 5459.193 | 1.62 | -0.58 | 94.4 | ||
| 5959.688 | 1.63 | -0.84 | 47.6 | ||
| 6143.376 | 1.70 | -0.80 | 70.0 | ||
| 6098.326 | 1.77 | -0.61 | 61.3 | ||
| 5359.508 | 1.78 | -0.78 | 60.1 | ||
| 5685.836 | 1.90 | -0.43 | 54.4 | ||
| Pr II | 59 | 5135.140 | 0.95 | -0.13 | 118.6 |
| 5605.642 | 0.96 | -0.65 | 71.3 | ||
| Nd II | 60 | 5221.572 | 0.38 | -1.34 | 120.7 |
| 5934.738 | 0.75 | -1.39 | 109.7 | ||
| 6365.540 | 0.93 | -1.37 | 77.2 | ||
| 6031.270 | 1.28 | -0.83 | 103.8 | ||
| 6803.980 | 1.44 | -0.79 | 108.2 | ||
| 6737.763 | 1.60 | -0.78 | 93.4 | ||
| 6650.517 | 1.95 | -0.32 | 105.2 | ||
| Sm II | 62 | 4791.580 | 0.10 | -1.24 | 111.2 |
| 6731.813 | 1.17 | -0.52 | 88.0 | ||
| Eu II | 63 | 6437.640 | 1.32 | -0.27 | 87.2 (SS) |
| Gd II | 64 | 5733.852 | 1.37 | -0.89 | 26.3 (SS) |
| Dy II | 66 | 5169.688 | 0.10 | -1.95 | 68.3 (SS) |
| Er II | 68 | 5229.319 | 2.60 | -0.39 | 16.5 (SS) |
| Yb II | 70 | 5352.954 | 3.75 | -0.34 | 53.6 (SS) |
| Lu II | 71 | 6463.107 | 1.46 | -1.05 | 126.0 (SS) |
| Hf II | 72 | 4790.708 | 2.20 | -1.11 | 38.5 (SS) |
| W II | 74 | 5104.432 | 2.36 | -0.91 | 46.3 (SS) |