A deep X-ray observation of supernova remnant G304.60.1 (Kes 17) with Suzaku
Abstract
In this paper, we present the analysis of a deep (99.6 ks) observation of G304.60.1 with the X-ray Imaging Spectrometer on board Suzaku satellite. The X-ray spectral data are well-fitted with a plasma model consisting of a thermal component in collisional ionization equilibrium and a non-thermal component. The thermal emission is well fitted with VMEKAL model with an electron temperature of keV, a high absorbing column density of and near/lower solar abundances which indicate that the X-ray emitting plasma of G304.60.1 is dominated by swept-up ambient medium. The non-thermal component is well fitted with a power-law model with photon index of . We found a relatively high electron density cm-3, age yr, and X-ray emitting mass M☉ at an adopted distance of d=10 kpc. Using the morphological and spectral X-ray data, we confirm that the remnant is a new member of mixed-morphology supernova remnants.
keywords:
ISM: supernova remnantsISM: individual objects:G304.60.1 (Kes 17)X-rays:ISM1 Introduction
Recent supernova remnant (SNR) observations in X-ray band led to discovery of a considerable number of a new morphological class called mixed-morphology (MM) SNRs that have a centrally bright in the X-ray band characterized by a thermal spectrum with little or no limb brightening and a shell morphology in radio (Rho & Petre, 1998). Their characteristics have been explained with two basic scenarios; evaporating clouds (Cowie & Mckee, 1977; , 1991) and thermal conduction models (Cox et al., 1999; Shelton et al., 1999; Shelton, Kuntz & Petre, 2004). In addition to these basic ones there are new scenarios that try to explain the mechanism taking place, but MM SNRs are still not understood completely. Deep X-ray observations will help understanding the mechanism taking place in these MM SNRs.
G304.6+0.1 (Kes 17), a new MM member (Combi et al., 2010), was first detected at 408 MHz and 5 GHz with a Parkes and a Molonglo radio telescopes by Shaver & Goss (1970). Caswell et al. (1975) gave a lower limit of 9.7 kpc to the distance of the remnant by measuring 21 cm absorption profiles with the Parkes hydrogen line interferometer. From the radio observations, Milne et al. (1985) suggested that its structure has been resulted from the shock front collision with its dense environment, (1996) have shown that it had a irregular shell morphology with a small size. Frail et al. (1996) have detected 1720 MHz OH maser emission toward G304.6+0.1 by using a Parkes Telescope. Reach et al. (2006), using mid-infrared data from the Spitzer Space Telescope at 3.6, 4.5, 5.8 and 8 m showed that the remnant has a shell structure in infrared and detected a pair of thin filament at about , . The authors claimed that most of the infrared emission coming from the shell could be resulted from shocked molecular material. Hewitt et al. (2009) have obtained sensitive low-resolution spectroscopy from 5 to 35 m for this remnant with Spitzer IRS and showed evidence of shocked molecular gas. The first detailed multi-wavelength (radio, mid-infrared, and X-ray) study of the G304.60.1 has been conducted by Combi et al. (2010). By using XMM-Newton data (26.8 ks) they have found that the X-ray emission was dominated by thermal radiation (PSHOCK) plus a small fraction of non-thermal radiation (power-law) in north, center and south regions. They have found a high column density in the range of () , keV and plasma was in non-equilibrium ionization state with s. In addition, they calculated electron density to be 0.99, 0.89 and 2.26 cm-3 for north, center and south regions, respectively. Their multi-wavelength study has suggested that this remnant was a middle-aged SNR, and belonged to the MM SNRs class. Lee et al. (2011) showed that the IR emission was concentrated on the western and southern shells by using data obtained with and satellites, the western shell was bright in the mid and far-IR continuum and the near-IR H2 line emission, whereas the southern shell was visible only in the mid-IR continuum emission. The authors suggested that far-IR continuum and near-IR H2 line emission emanating from the western shell was resulted from the interaction with nearby molecular cloud. Wu et al. (2011) reported the discovery of GeV emission at the position of this remnant by using the data from the Large Area Telescope on board the Fermi Gamma-ray Space Telescope. They observed the remnant in the 120 GeV range with a significance of 12, and suggested that Kes 17 was a candidate acceleration site for cosmic-rays, and reported the detection of a number of -ray sources in its vicinity.
Suzaku (Mitsuda et al., 2007), the newest Japanese X-ray astronomy satellite that has a good energy resolution, high efficiency, and low background level for diffuse sources, has observed G304.60.1 with 99.6 ks exposure time. Our aim is to study the remnant whose morphology implies a similarity to the recently proposed group of MM SNRs by using the high quality spectral data.
The rest of this paper is structured as follows. Observation and data reduction are described in Section 2, image and spectral analysis are reported in Section 3. We discuss results of the spectral analysis and finally, investigate the X-ray characteristics of G304.60.1 from radial spectral variations and compared the results with the two basic scenarios explaining MM SNRs in Section 4.
2 Observation and Data Reduction
Suzaku observed G304.60.1 with the X-ray imaging spectrometer (XIS: Koyama et al. (2007)) on 2010 September 03, for 99.6 ks (Obs ID:505074010). Suzaku has three working XIS CCDs, two of the cameras (XIS0 and XIS3) have front-illuminated (FI) CCDs, and the remaining one (XIS1) has a back-illuminated (BI) CCD. Each CCD camera has a single CCD chip with an array of pixels, and covers an area of 17.817.8 arcmin2. The XIS was operated with normal clocking mode, in and editing modes.
We used the headas 6.5 sofware package for data reduction. The XIS data have been screened with xselect using the standard criterion (Koyama et al., 2007). Spectral analysis and model fitting have been performed with xspec v11.3 (Arnaud, 1996). The redistribution matrix files (RMFs) of the XIS has been produced by xisrmfgen and auxillary responce files (ARFs) by xissimarfgen (Ishisaki et al., 2007).
3 Analysis
3.1 Image analysis
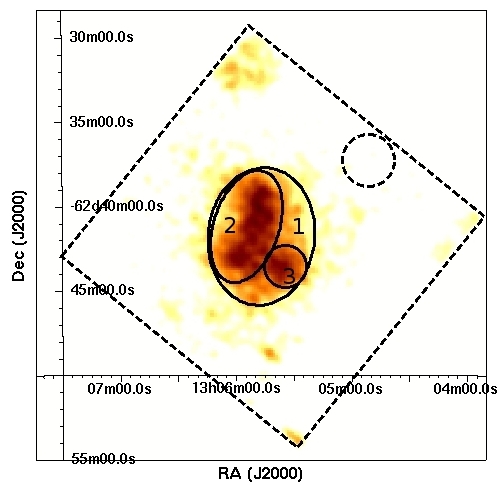
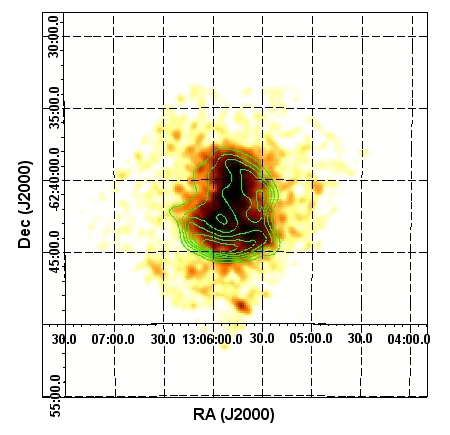
Fig. 1 shows XIS0 image of G304.60.1 in 0.310 keV full energy band. The outer most ellipse represents the over all region (we call region 1) that X-ray emission originates. Inside the region 1, the emission looks much concentrated in two parts, inner ellipse (we call region 2) and inner circle (we call region 3). The dashed circle and dashed square show background region and the XIS field of view (FOV), respectively. Fig. 2 shows the XIS0 image in 0.310 keV band overlaid with contours of the 843 MHz radio image from (1996).
3.2 Spectral analysis
We extracted the spectrum for each XIS detector for the outer elliptical region, inner elliptical region and inner circular region. The background has been extracted from circular region, taking care not to include the 55Fe calibration sources in the corners of the CCD. In Table 1, we gave details of ellipses, circles and background (centre coordinates, sizes and angles). The spectra are grouped with a minimum of 50 counts bin-1 for region 1, 30 counts bin-1 for region 2 and 25 counts bin-1 for region 3, and the statistics is used.
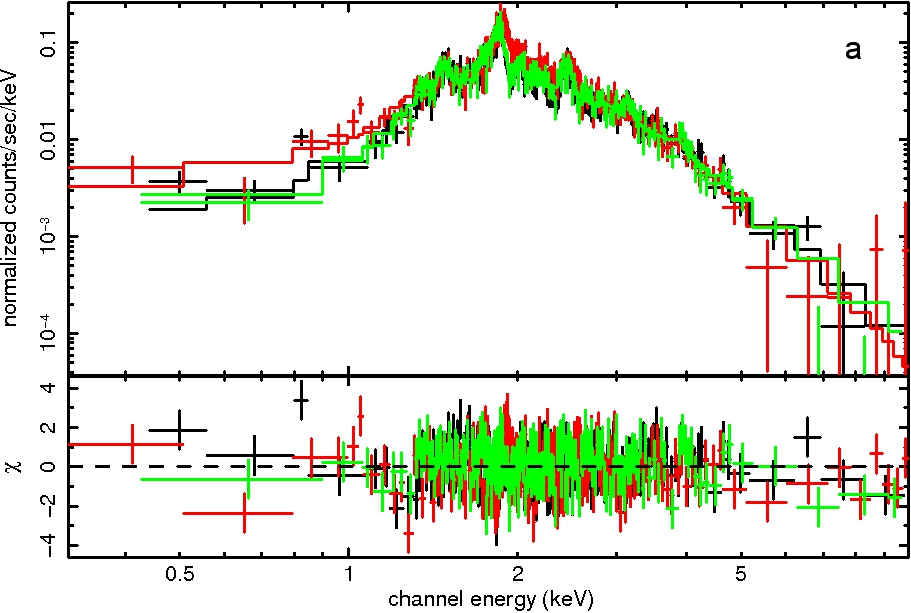
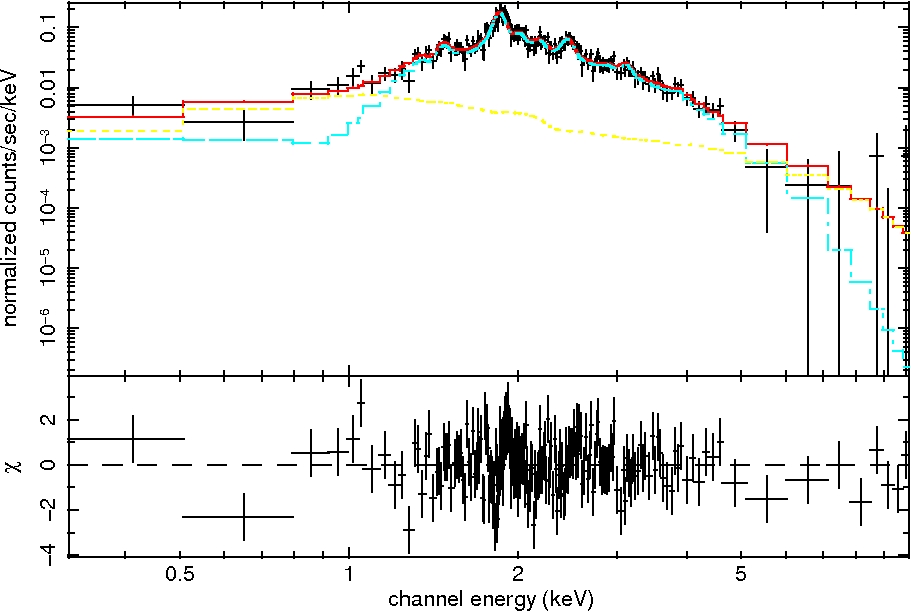
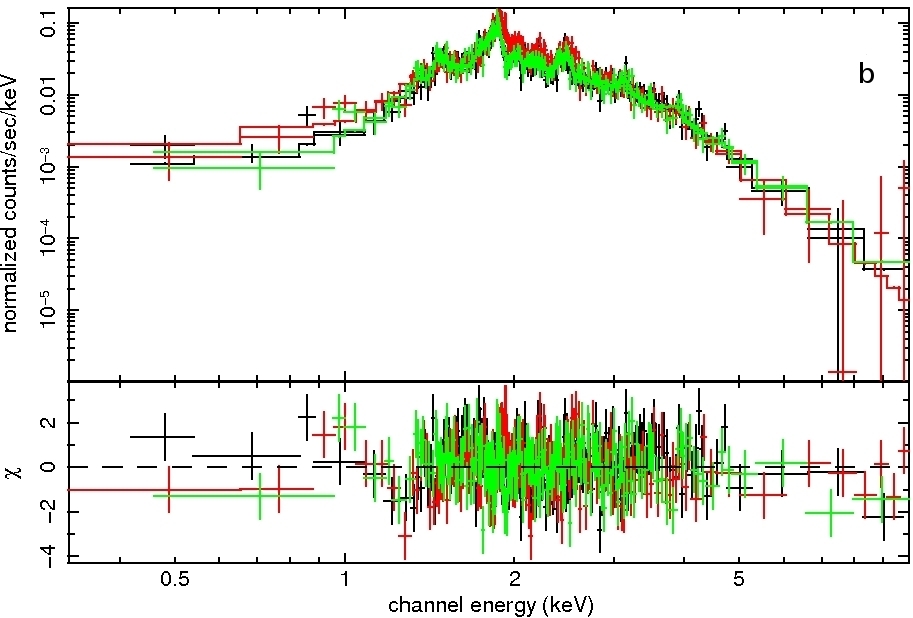
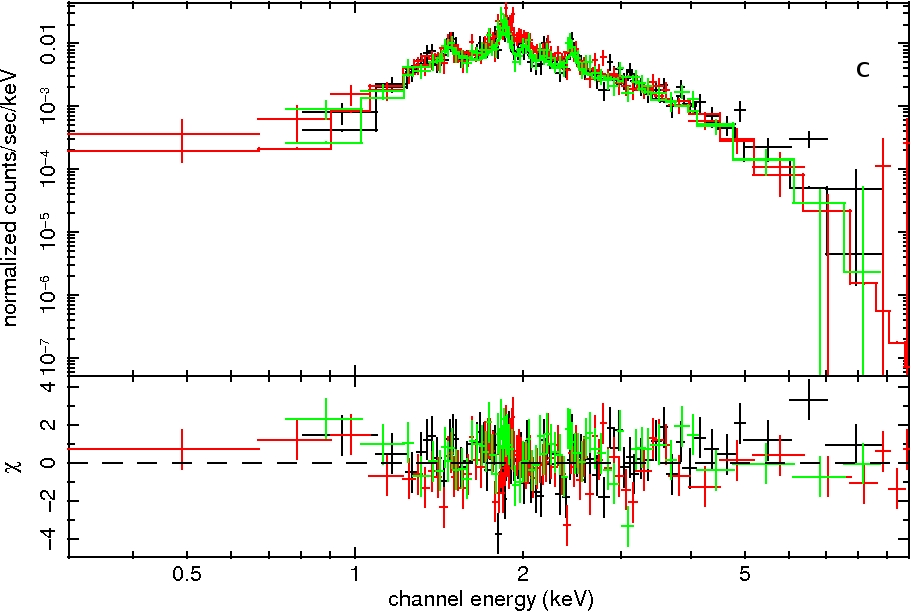
For spectral fitting of region 1, we first applied single temperature non-equilibrium ionization (NEI) model (VNEI in xspec; Borkowski, Lyerly & Reynolds (2001)) modified by Galactic absorption via the WABS multiplicative model (Morrison & McCammon, 1983). The parameters of the absorbing column density (), electron temperature () and ionization parameter () were set free while all elemental abundances were fixed at their solar values (Anders & Grevesse, 1989). The model gave a large ionization parameter of s, which means that the plasma of the remnant has reached ionization equilibrium with a reduced of 1.43 (948/664 d.o.f.). Therefore, we tried an absorbed collisional ionization equilibrium (CIE) plasma model (VMEKAL in xspec; Mewe, Gronenschild & van den Oord (1985); Mewe, Lemen & van den Oord (1986); Liedahl, Osterheld & Goldstein (1995)). In this case, the reduced value (926/665=1.39) improved a little bit but it was clear that the model fitting needed a second component. Therefore, we added a second thermal component to VMEKAL, a CIE model (VMEKAL) and a NEI model (VNEI), respectively. From the model fitting of VMEKAL+VMEKAL we did not see two different temperatures, but when we thawed Mg, Si, S we obtained two different temperatures of 0.6 and 1.1 keV with a reasonably good reduced of 1.15 (761.7/660 d.o.f.). However, we obtained unphysically low abundance of S and very high errors of abundances of Mg, Si and S. From the model fitting of VMEKAL+VNEI, we obtained two different temperatures of 0.6 and 1.4 keV. When we thawed Mg, Si, S, the value improved significantly (750.8/659=1.14). For both model fittings we used F-test to test whether the extra thermal component was a statistically significant addition. However, the F-test gave a probability of and that is the improvement is due to chance for VMEKAL+VMEKAL and VMEKAL+VNEI models, respectively. Then, we added a power-law component to VMEKAL model. In this case, we obtained a reasonably good physical parameter values and their errors with an acceptable value (799/663=1.2). Then, we let Mg, Si and S vary which yielded a rather good reduced value of 1.06 (700/660 d.o.f.). We also applied F-test to our model fitting which gives a probability of that the improvement is not due to chance. All these steps were repeated for region 2 and region 3. For region 2, VMEKAL model required a power-law component. However, region 3 did not require a second component. The XIS0, XIS1 and XIS3 spectra of three regions were fitted simultaneously in 0.310 keV energy band and are given in Fig. 3 (a, b and c). The right panels of this figure show the individual components of the applied model, VMEKAL and power-law, for XIS1 only. Best-fitting parameters of applied models for three regions are listed in Table 2. All the errors are at 90 per cent confidence level.
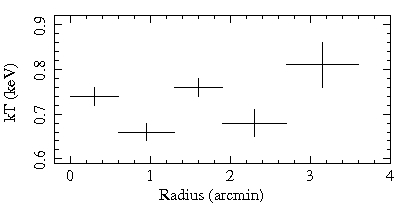
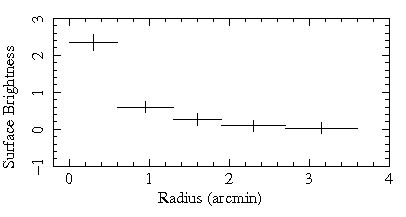
We also studied spectral variation across the remnant and gave the results in Fig. 4. To study the radial variation of and surface brightness we chose five elliptical annuli with , , , and arcmin2 regions centered at , from XIS0 FOV. The spectra extracted from the elliptical annuli were grouped with a minimum of 20 counts bin-1. We applied our best-fitting model (an absorbed VMEKAL and power-law) starting from the central region within arcmin2, we let absorbing column density, electron temperature, normalization and abundances of Mg, Si and S vary. For all outer annuli, we applied same model fixing to the value obtained from central region.
4 Discussion and Conclusions
In this work, we have studied X-ray morphology and spectral properties of G304.60.1 using XIS data obtained with deep observation of Suzaku. As seen from Fig. 2, G304.60.1 has a centrally filled X-ray morphology dominated by thermal X-ray emission, the radio contours of remnant are concentrated at its shell. Morphologically, this remnant resembles MM SNRs. With the help of high quality spectral data we studied spectral characteristics of G304.60.1 and compared our findings with the theoretical models proposed for MM SNRs below.
The X-ray emission from the remnant is well described by a model of a thermal plasma that has reached ionization equilibrium and a non-thermal component (power-law) required to describe the plasma state has a photon index () of 1.4. Dominant emission from this remnant is thermal (90 per cent of the total X-ray flux) and is described by the CIE plasma model (in CIE plasma, should be larger than s (, 1984)) with an electron temperature of keV. We have performed detailed spectral fitting for three regions. As seen from Table 2, spectral parameters for three regions are almost similar. We obtained a high absorbing column density in the range of () which is consistent with the previous work of Combi et al. (2010), in the range of () , that supported the large distance d kpc adopted by Caswell et al. (1975) to the remnant. Our value is larger than that of Combi et al. (2010) therefore, throughout our calculations we used d=10 kpc. From the emission measure (, where is the electron density, is the hydrogen density, and is the volume of the X-ray emitting plasma) we estimate the electron density of the plasma taking into account for the mean charge state with normal composition. Considering the possibility that less than the entire volume is filled, we calculate the volume of the X-ray emitting region from , where is the SNR radius and is the filling factor. Then we carry the factor through our calculations to see the dependence of each derived quantity (for example the electron density, age) on . We obtain the volume to be assuming the spherical radius of 4 arcmin at the distance d=10 kpc and then the electron density to be cm-3. In calculating the age of the remnant we use the relation , where is the ionization age of the plasma. CIE model gives only a lower limit ( cm-3s) to this parameter and hence leads to a lower limit on the age of the remnant which is calculated to be yr for G304.60.1. The mass of the X-ray emitting gas is calculated to be M☉ from , where is mass of a hydrogen atom. As seen from Table 2, near/lower solar abundance values obtained for each region and large X-ray emitting mass indicate that the X-ray emission results from swept-up ambient medium as is generally the case in middle-aged SNRs. Relatively large ( cm-3) and small size (8 arcmin) suggest that the remnant expands in a region with a large ambient density.
For the non-thermal component that constituting 10 per cent of the total flux, our best-fitting photon index is in the range of 1.41.6, as seen in Table 2, which is consistent with that of classical young pulsars ranging in between 1.1 and 1.7 (Chakrabarty et al., 2001). But there is no compact or extended X-ray source reported at the location or in the vicinity of this remnant. Another possibility would be that the power-law emission is resulted from the synchrotron emission from shock-accelerated relativistic electrons, also as the Fermi detection of G304.60.1 (Wu et al., 2011) appears to be related to the remnant and not to a central compact object. However, our spectral fitting of each elliptical annulus gives different photon index value ( , 1.2, 1.3, 1.5), moreover the photon index obtained from the centre is unphysically large ( ) indicating that the power-law emission can not be related to the remnant itself. That our best-fitting model required no non-thermal component for region 3 may support this idea. Considering all these cases, it is still difficult to explain the origin of the non-thermal emission with Suzaku data. Combi et al. (2010) also obtained non-thermal emission from this remnant with a photon index value in the range of 1.83.1 with XMM-Newton observation, which is softer than our photon index value, indicating particle acceleration in shock-fronts.
In addition to morphological evidences, G304.60.1 is a middle-aged ( yr) SNR, the plasma of the remnant is in CIE condition and it is located in an inhomogeneous medium. The general characteristics of MM SNRs have been given in Rho & Petre (1998) as (i) Members of this class have a centrally peaked morphology in the X-ray band characterized by a thermal spectrum while a shell morphology in radio, (ii) Their ages are expected to be yr, which means that the plasma should be in CIE condition, (iii) They are interacting with molecular clouds and/or HI clouds, which means that they are located in a very dense medium. Considering these properties we may say that G304.60.1 is likely to be a member of MM SNRs as suggested by Combi et al. (2010). The two basic scenarios explaining this class are; one is that the interior X-ray emission arises from the gas evaporated from shocked clouds (Cowie & Mckee, 1977; , 1991). The second one is that as an SNR evolves, the temperature and density of the hot interior plasma gradually become uniform through thermal conduction and the temperature in the outer shells becomes lower and absorbed by the interstellar medium, the only detectable X-ray emission emanates from the interior of the SNR (Cox et al., 1999; Shelton et al., 1999; Shelton, Kuntz & Petre, 2004). To compare our results with these models, we have studied radial variations of the and the surface brightness as seen from Fig. 4. We have found that the temperature variation ( 0.660.81 keV) is almost uniform across the remnant as predicted by both models. On the contrary, surface brightness peaks at the center and declines towards shell regions from 2.34 erg to 0.03 erg in 0.310 keV, which is consistent with evaporating clouds model. G304.60.1 is interacting with an OH maser source at 1720 MHz (Frail et al., 1996). Recently Lee et al. (2011) suggested that the remnant was interacting with nearby molecular cloud. Furthermore, Wu et al. (2011) have detected GeV emission from the SNR and a number of -ray sources in its vicinity. The thermal conduction model requires a relatively high density ambient medium, while the evaporation model requires dense clouds. In this respect, G304.60.1 is consistent with both models.
We present here the results from the Suzaku archival data of G304.60.1. The deep XIS spectra consist of two components; thermal emission coming from the plasma is in CIE condition with keV, a high value and the non-thermal emission has a photon index of 1.4. This value is consistent with that of classical young pulsars, but there is no observed compact source reported. So, the origin of the non-thermal emission is still unclear. Thermal emission originates from the shocked ambient medium with an electron density of cm-3. The morphological and X-ray spectral characteristics imply that G304.60.1 is a member of MM class.
Acknowledgments
We thank to the referee for his/her detailed and constructive comments and suggestions on the manuscript. We also acknowledge support by the Akdeniz University Scientific Research Project Management. AS is supported by TÜBİTAK PostDoctoral Fellowship.
References
- Anders & Grevesse (1989) Anders E., Grevesse N., 1989, Geochimica Cosmochimica Acta, 53, 197
- Arnaud (1996) Arnaud K. A., 1996, in Jacoby G., Barnes J., eds, ASP Conf. Ser. Vol.101, Astronomical Data Analysis Software and Systems V. Astron.Soc. Pac., San Francisco, p. 17
- Borkowski, Lyerly & Reynolds (2001) Borkowski K. J., Lyerly W. J., Reynolds S. P., 2001, ApJ, 548, 820
- Caswell et al. (1975) Caswell J. L., Murray J. D., Roger R. S., Cole D. J., Cooke D. J., 1975, A&A, 45, 239
- Chakrabarty et al. (2001) Chakrabarty D., Pivovaroff M. J., Hernquist L.E., Heyl J. S., Narayan R., 2001, ApJ, 548, 800
- Combi et al. (2010) Combi et al. 2010, AA, 523, 76.
- Cowie & Mckee (1977) Cowie L. L., McKee C. F., 1977, ApJ, 211, 135
- Cox et al. (1999) Cox D. P., Shelton R. L., Maciejewski W., Smith R. K., Plewa T., Pawl A., Róẏyczka M., 1999, ApJ, 524, 179
- Frail et al. (1996) Frail D. A., Goss W. M., Reynoso E. M., Giacani E. B., Green A. J., Otrupcek R., 1996, AJ, 111, 1651
- Hewitt et al. (2009) Hewitt J. W., Rho J., Andersen M., Reach W. T., 2009, ApJ, 694, 1266
- Ishisaki et al. (2007) Ishisaki Y. et al., 2007, PASJ, 595, 113
- Koyama et al. (2007) Koyama K. et al., 2007, PASJ, 59, 23
- Lee et al. (2011) Lee H.G., Moon D.S., Koo B.C., Onaka T., Jeong W.S., Shinn J.H., Sakon I., 2011, ApJ, 740, 31
- Liedahl, Osterheld & Goldstein (1995) Liedahl D. A., Osterheld A. L., Goldstein W. H., 1995, ApJ, 438, L115
- (15) Masai K., 1984, Ap&SS, 98, 367
- Mewe, Gronenschild & van den Oord (1985) Mewe R., Gronenschild E. H. B. M., van den Oord G. H. J., 1985, A&AS, 62, 197
- Mewe, Lemen & van den Oord (1986) Mewe R., Lemen J. R., van den Oord G. H. J., 1986, A&AS, 65, 511
- Milne et al. (1985) Milne D. K. et al., 1985, Proceedings of the ASA, 6, 78
- Mitsuda et al. (2007) Mitsuda K. et al., 2007, PASJ, 59, 1
- Morrison & McCammon (1983) Morrison R., McCammon D., 1983, ApJ, 270, 119
- Reach et al. (2006) Reach W. T. et al., 2006, AJ, 131, 1479
- Rho & Petre (1998) Rho J., Petre R., 1998, ApJ, 503, L167
- Shaver & Goss (1970) Shaver P. A., Goss W. M., 1970, AJPAS, 17, 133
- Shelton et al. (1999) Shelton R. L., Cox D. P., Maciejewski W., Smith R. K., Plewa T., Pawl A., Róẏyczka M., 1999, ApJ, 524, 192
- Shelton, Kuntz & Petre (2004) Shelton R. L., Kuntz K. D., Petre R., 2004, ApJ, 611, 906
- (26) White R. L., Long K. S., 1991, ApJ, 373, 543
- (27) Whiteoak J.B.Z., Green A.J., 1996, A&AS, 118, 329
- Wu et al. (2011) Wu J. H. K., Wu E. M. H., Hui C. Y., Tam P. H. T., Huang R. H. H., Kong A. K. H., Cheng K. S., 2011, ApJL, 740, L12
| Regions | Centre Coordinates | Size | Angle |
|---|---|---|---|
| , | (arcmin) | (degrees) | |
| ( , ) | |||
| 1 | 13 05 44 , 62 41 54 | ||
| 2 | 13 05 55 , 62 41 11 | ||
| 3 | 13 05 35 , 62 43 33 | ||
| Background | 13 04 52 , 62 37 16 |
| Component | Parameters | Region 1 | Region 2 | Region 3 | |
|---|---|---|---|---|---|
| Wabs | ( | 3.9 | 4.2 | 3.2 | |
| VMEKAL | (keV) | 0.75 | 0.74 | 0.84 | |
| Abundance111Abundances are relative to the solar values (Anders & Grevesse, 1989). | Mg | 1.3 | 1.2 | 0.9 | |
| Si | 0.9 | 0.9 | 1.1 | ||
| S | 0.6 | 0.5 | 0.4 | ||
| norm (photons ) | 0.93 | 0.65 | 0.07 | ||
| 222Emission measure dV in the unit of , where and are number densities of electrons and protons, respectively and V is the X-ray emitting volume. | 11.1 | 7.7 | 0.8 | ||
| Flux333Absorption-corrected thermal flux in keV energy band in the unit of erg . | 4.6 | 3.2 | 0.6 | ||
| Power-law | Photon Index | 1.4 | 1.6 | ||
| norm (photons ) | 1.17 | 0.46 | |||
| Flux444Absorption-corrected total flux (VMEKAL plus power-law components) in keV energy band in the unit of erg . | 5.5 | 3.6 | |||
| /d.o.f. | 700/660=1.06 | 747/657=1.14 | 253.8/192=1.32 |