Highly ionized collimated outflow from HE 0238–1904
Abstract
We present a detailed analysis of a highly ionized, multiphased and collimated outflowing gas detected through O v, O vi, Ne viii and Mg x absorption associated with the QSO HE 0238–1904 (). Based on the similarities in the absorption line profiles and estimated covering fractions, we find that the O vi and Ne viii absorption trace the same phase of the absorbing gas. Simple photoionization models can reproduce the observed , and from a single phase whereas the low ionization species (e.g. N iii, N iv, O iv) originate from a different phase. The measured ratio is found to be remarkably similar (within a factor of 2) in several individual absorption components kinematically spread over km s-1. Under photoionization this requires a fine tuning between hydrogen density (nH) and the distance of the absorbing gas from the QSO. Alternatively this can also be explained by collisional ionization in hot gas with K. Long-term stability favors the absorbing gas being located outside the broad line region (BLR). We speculate that the collimated flow of such a hot gas could possibly be triggered by the radio jet interaction.
keywords:
quasar: absorption line – quasar: individual (HE 02381904)1 Introduction
Large scale outflows from AGNs play a vital role in regulating star formation in galaxies and the growth of the super-massive black holes at their centers (Silk & Rees, 1998; King, 2003; Bower et al., 2006). Hence detecting different forms of outflows is essential to understand the AGN feedback. In the QSO spectrum, outflows can manifest as associated narrow absorption lines (NALs) or broad absorption lines (BALs) in the ultraviolet (UV) and as high ionization absorption lines and edges (i.e. warm absorbers, WAs) in the soft X-ray wavelengths. BALQSOs comprise of 40% of the total QSO population (Dai et al., 2008) while WAs are detected in the X-ray spectrum of of Seyfert galaxies (Crenshaw et al., 2003) and QSOs (Piconcelli et al., 2005). BALs & NALs are predominantly detected through species with ionization potential (IP) eV (e.g. C iv, Si iv, N v etc.), WAs, on the contrary, are identified by species with IP keV (e.g. O vii, O viii etc.). To understand the ionization structure of the outflowing gas entirely it is very important to detect species with intermediate ionization potentials such as O vi (138 eV), Ne viii (239 eV), Mg x (367 eV) etc. In particular the resonant lines of O vi Ne viii and Mg x are well suited for probing the intermediate physical conditions of the outflowing gas. However the detections of such species in outflows have been very rare till date.
There are three confirmed and two tentative detections of associated Ne viii (most of them showing radio emission) in the form of narrow absorption lines [UM 675, Hamann et al. (1995); 3C 288.1, Hamann et al. (2000), J2233606, Petitjean & Srianand (1999); HE 0226-4110, Ganguly et al. (2006) and 3C48, Gupta et al. (2005)] and three QSOs in the form of BAL absorption [Q 02261024, Korista et al. (1992); SBS 1542+541, Telfer et al. (1998) and PG 0946+301, Arav et al. (1999)]. While multiphase photoionization models are generally used to explain these observations (see for example, Hamann, 1997), the role of collisional ionization is not adequately explored. Here we report the detection of a very strong associated Ne viii (and O vi) absorption in the high signal-to-noise () /COS and spectra of HE 02381904 which has spectral energy distribution (SED) typical of a non-BALQSO. The system is at an ejection velocity of 4500 km s-1 with a kinematic spread of 2500 km s-1. Along with the Ne viii and O vi, we also detect absorption from N iii, N iv, O iv, O v and Mg x. Throughout this paper we use cosmology with = 0.27, = 0.73 and = 71 km s-1Mpc-1.
2 Observations of HE 02381904
We use /COS and FUV and NUV spectroscopic observations of HE 02381904 that are publicly available in the MAST archive111http://archive.stsci.edu/. The observations were carried out during December 2000 (PI, Moos), July 2003 and October 2004 (PI, Howk). We have downloaded a total of 86 frames calibrated using CALFUSE (v3.2.1) pipeline. The combined spectrum has a resolution of and S/N ratio of 310 per pixel over the wavelength range 9201180 (Moos et al., 2000; Sahnow et al., 2000). The archived COS observations are from the COS GTO Program 11541 (PI, Green). These observations consist of G130M and G160M FUV grating integrations at medium resolution of and S/N 2030 per pixel in the wavelength range of 11341796 (Osterman et al., 2011; Green et al., 2012). These spectra and the low-dispersion () NUV spectra covering the wavelength range of 16503200 obtained with the G230L COS grating from the archive were extracted using the CalCOS v2.15.4 pipeline. Continuum normalization was done by fitting the regions free of absorption lines with a smooth lower order polynomial.
The optical spectrum of HE 02381904 was obtained with the 2-m telescope at IUCAA Girawali Observatory (IGO)222http://www.iucaa.ernet.in/itp/ on 7-8 December 2011. The long slit spectra (3x30 min exposures), covering the wavelength range , were obtained with the GR5 grism of the IUCAA Faint Object Spectrograph (IFOSC) using a slit width of 1.5 arcsec. The raw CCD frames were cleaned and the spectra were extracted using standard IRAF 333IRAF is distributed by National Optical Astronomy Observatories, which are operated by the Association of Universities for Research in Astronomy, Inc., under cooperative agreement with the National Science Foundation. procedures. We use the method explained in Vivek et al. (2009) for removing the fringing at . The wavelength and flux calibrations were performed using Helium-Neon lamps and standard star spectrum respectively. The final co-added spectrum (in the heliocentric frame) has a resolution of and a S/N per pixel.
2.1 Spectral Energy Distribution and QSO parameters
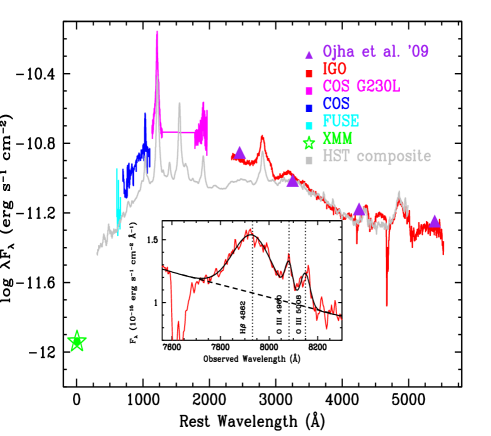
From simultaneous Gaussian fits to , emission lines we get the emission redshift, = . The rest-frame UV/optical Spectral Energy Distribution (SED) of HE 02381904 is shown in Fig. 1. The (green) star is the X-ray flux calculated from XMM-Newton slew survey data assuming (Sambruna et al., 1999) between 0.2 to 2 keV and Galactic . Consistency of photometric points (purple triangles) of Ojha et al. (2009) with our IGO spectrum (in red) implies lack of strong flux variability over 4.2 yrs in QSO rest frame. This is also supported by the similar UV flux measurements made by COS in December 2009 and STIS G140L in July 2002. In the absence of strong variability, multiple epoch data can be combined to get the QSO’s SED. Fig. 1 shows that the source is intrinsically bringhter in UV than the HST composite spectrum of radio-loud QSOs constructed by (Telfer et al., 2002).
We measure X-ray-to-optical spectral index, which is consistent with we get from the measured optical luminosity using equation 8 of Stalin et al. (2010). This indicates that HE 02381904 is more like a typical non-BAL QSO. The full width at half maxima (FWHM) of the line is km s-1. Using the prescription of Bentz et al. (2009) we measure the size of the BLR to be cm. This together with the FWHM of gives the black hole mass MBH = 2.4 M⊙ (Onken et al., 2004) and a Schwarzschild radius of cm. Following Hall et al. (2011), we find the diameter of the disc within which 90% of the 2700 continuum is emitted cm.
3 Analysis of the Ne viii absorber
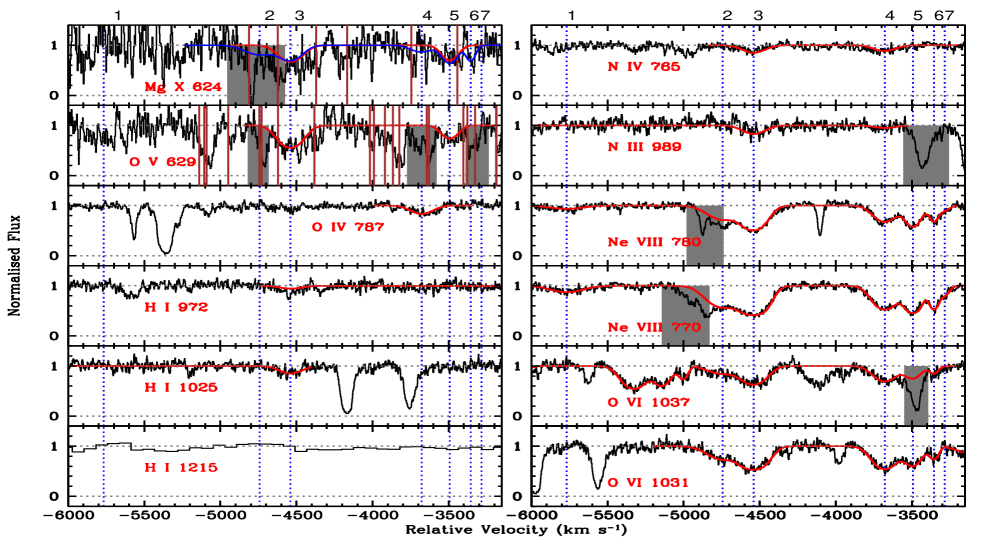
In Fig. 2 we show absorption profiles of different species as a function of outflow velocity with respect to the QSO ( = 0.629). The Ne viii absorption is detected in seven components spread over a km s-1 velocity interval. The separate components are labeled in the figure. Apart from the two weak Ne viii components (1 & 7), all other components show O vi absorption with profiles very similar to that of Ne viii. The high ionization Mg x and O v lines are clearly detected in the data but without blending only in components 3 & 5. Due to poor spectral S/N the presence of stronger Mg x can be confirmed only for component 3. Contamination from Galactic H2 lines has made the detection of Mg x and O v ambiguous in all other components. At the velocities of components 3 & 4, we also find weak absorption consistent with N iii and N iv. The stronger N iii line ( times) is a non-detection in the spectrum, and therefore we report the measurements for these components as upper limits. Very weak Ly and Ly absorption are seen in the COS data for component 3. But we do not find any Ly absorption in the low dispersion COS G230L spectrum in any of these Ne viii components.
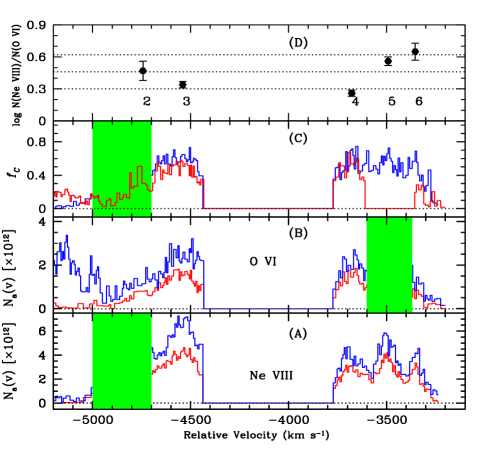
The apparent column density profiles of Ne viii and O vi doublets, shown in Fig. 3, clearly indicates that the absorber is only partially covering the background emitting source. The estimated covering fractions () using the method described in Srianand & Shankaranarayanan (1999) are also shown in Fig. 3. The covering fractions estimated for the Ne viii in components 27 is 0.6. The O vi absorption shows in components 2 & 3 and in components 46. The weak Ne viii absorption in component 1 is consistent with a complete coverage of the background source. It is interesting to note that Ne viii and O vi ions have very similar covering fractions for all the components. This together with similar profile shapes suggest that the two ions are possibly tracing the same phase of the absorbing gas. The covering fraction of for H i determined using Ly & Ly of component 3 is significantly smaller implying the kinematic coincidence of multiple gas phases with different projected area (see also Telfer et al., 1998). The results of Voigt profile fitting analysis after taking into account these effects of partial coverage is given in Table 1. In case of non-detections we calculate 3 upper limits on the column densities using the rms error in the unabsorbed continuum at the expected position and by using the value as measured for Ne viii (or O vi) with the appropriate .
The most intriguing fact about this system is that in the five components where we have measurements of and , we find a surprisingly constant value of 0.460.16 for the ratio (see panel-D of Fig. 3). To understand the physical conditions of the absorbing gas we ran several photoionization models with Cloudy v(07.02) (Ferland et al., 1998). In these models we assumed (a) the ionizing spectrum to be a combination of black body (with K) and power law with , and as observed for HE 02381904 (see Fig. 1), (b) the gas is an optically thin plane parallel slab and (c) the relative abundances of heavy elements are similar to the solar values (Asplund et al., 2009).
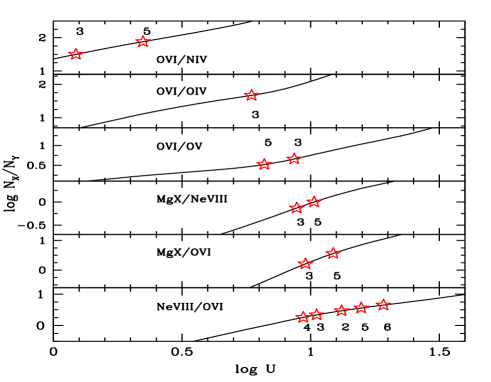
In Fig. 4 various model predicted column density ratios are plotted against ionization parameter. In the case of components 3 & 5, the observed , and , within their 10% uncertainty, are well reproduced for U 1.0 and 1.1 respectively. However, ratios involving low ions (i.e. O iv, N iv, O v) require lower values of U indicating the presence of multiple gas phases. By using , the covering fraction determined for Ne viii, we obtain an upper limit of log = 14.36 for the H i column density associated with the high ionization gas.This gives a lower limit on metallicity of log for component 3. For all the components, the observed range of ratio is consistent with 0.95 log U 1.30.
Because of poor of the data and the Galactic H2 contamination we could only check the consistency of Mg x profiles predicted by the models for other components. For each component we calculate the model predicted for log U required to produce the observed . The profiles are then generated assuming and as those measured for Ne viii. The predicted Mg x profile is consistent with the observed spectra within measurement uncertainties (see Fig. 2) suggesting similar value of log U for all these components spread over 1800 km s-1.
Nitrogen is reported to be over abundant compared to oxygen in associated absorbers favoring a rapid enrichment scenario in the central regions of QSOs (Hamann & Ferland, 1992; Korista et al., 1996; Petitjean & Srianand, 1999). The best fit photoionization model predicts log . Even in a low dispersion spectrum such a line should be detectable at level. The fact that we do not detect N v line could be because (a) N is not over abundant compared to O and/or (b) the covering fraction of N v may be much less as it falls on top of Ly+N v emission lines. High resolution data is needed to confirm the above mentioned possibilities.
| Species | (km s-1) | ID | (km s-1) | log (cm-2) | |
| Ne viii | 5767 9 | (1) | 143.8 12.7 | 14.22 0.03 | 1.0 |
| H i | ….. | 143.8 | 13.71 | 1.0 | |
| O vi | 4743 20 | (2) | 127.1 20.2 | 14.67 0.09 | 0.5 |
| Ne viii | ….. | 127.1 0.0 | 15.14 0.02 | 0.6 | |
| H i | ….. | 127.1 | 13.70 | 1.0 | |
| O vi | 4539 6 | (3) | 98.4 5.7 | 15.11 0.03 | 0.5 |
| Ne viii | ….. | 96.7 1.9 | 15.45 0.01 | 0.6 | |
| O iv | ….. | 98.4 | 13.44 | 1.0 | |
| O v | ….. | 98.4 | 14.45 | 0.5 | |
| N iii | ….. | 98.4 | 14.29 | 0.5 | |
| N iv | ….. | 98.4 | 13.61 0.04 | 0.5 | |
| Mg x | ….. | 98.4 | 15.32 | 0.6 | |
| H i | ….. | 98.4 | 14.36(15.75) | 0.6(0.1) | |
| Ne viii | 3678 4 | (4) | 94.9 3.5 | 15.10 0.02 | 0.6 |
| O vi | ….. | 96.8 3.9 | 14.84 0.02 | 0.6 | |
| O iv | ….. | 96.8 | 14.39 | 0.6 | |
| N iii | ….. | 94.9 | 13.79 0.13 | 0.6 | |
| N iv | ….. | 94.9 | 13.55 0.04 | 0.6 | |
| H i | ….. | 94.9 | 14.11 | 1.0 | |
| Ne viii | 3491 2 | (5) | 63.8 2.9 | 15.11 0.02 | 0.6 |
| O vi | ….. | 68.3 5.4 | 14.55 0.03 | 0.6 | |
| O v | ….. | 68.3 | 14.03 | 0.6 | |
| Mg x | ….. | 68.3 | 15.11 | 0.6 | |
| H i | ….. | 63.8 | 14.02 | 1.0 | |
| Ne viii | 3354 4 | (6) | 37.8 4.5 | 14.70 0.06 | 0.6 |
| O vi | ….. | 39.0 5.7 | 14.05 0.06 | 0.6 | |
| H i | ….. | 37.8 | 13.91 | 1.0 | |
| Ne viii | 3285 15 | (7) | 40.6 13.9 | 14.13 0.21 | 0.6 |
| H i | ….. | 40.6 | 13.94 | 1.0 |
4 Summary & Conclusions
We report the detection of highly ionized outflowing gas through associated absorption from O vi, Ne viii and Mg x in the UV spectra of HE 02381904 which is presumably a non-BALQSO. The high COS spectrum has allowed us to determine the covering fraction () and the multi-phase physical conditions in the absorber. The similarity in the absorption profiles and suggest that O vi and Ne viii absorption possibly trace the same phase of the absorbing gas. Near constancy of for Ne viii and O vi in the different components spread over 1800 km s-1 indicates that the flow could be collimated.
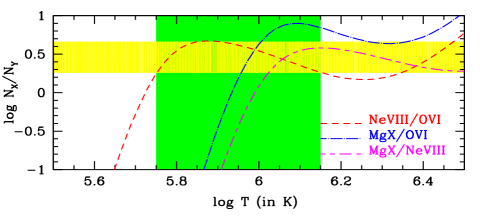
Under photoionization equilibrium conditions, the log = 0.460.16 ratio in the different components is consistent with 0.95 log U 1.30. This means that in spite of the absorbing gas being distributed over 1800 km s-1, the product nHr (where rc is the distance of the gas from the QSO) is nearly a constant. Getting such constraint naturally for different components could be an issue for the photoionization model. Models of mass conserving shells expanding with a velocity predict nHr to be a constant. However, this is not the case in the present system as we do not find any clear trend between the ejection velocity and the ionization parameter. Alternatively, collisional ionization in gas with temperatures in the range can recover the observed ratio as shown in the bottom panel of Fig 4. In this case we expect or to be very different between the different components, which cannot be ruled out with the existing data on Mg x. We note here that even in the case of photoionization the equilibrium gas temperature is K for log U 1.0.
From the observed flux at the Lyman limit (1.4 erg cm-2 s-1 Å-1) in the QSO rest frame we get a relation log (nHr) = 45.8 log U. This gives log (nHr) = 44.8 for log U = 1.0. If we assume that the absorbing gas is well within the BLR (r) we get n cm-3. The cloud thickness along the line of sight is, cm, if we use cm-2 and neutral fraction of as found for the photoionization model at log U = 1.0. The fact that the cloud is covering 60% of the background emitting source gives the transverse size of the cloud as r = 1.21017 cm-2. This is 5 orders of magnitudes larger than the thickness along the line of sight (i.e. ) resembling a sheet like geometry.
If we assume spherical geometry for the absorbing gas then the observed suggests that the radius of the cloud is cm. This gives n cm-3 and r pc for log U = 1.0. Therefore the absorbing region, if nearly spherical, will be co-spatial with the narrow emission line region (NLR) gas. The sound crossing time is days and years respectively, for the two scenarios discussed above. Purely from stability point of view, the absorbing gas is likely to be outside the BLR (see Faucher-Giguère et al., 2011).The NRAO VLA Sky Survey (NVSS) image shows possible radio emission associated with the QSO. We speculate that the outflow triggered by the radio jet could possibly explain the collimated hot outflowing gas outside the BLR as seen in the case of 3C48 (Gupta et al., 2005).
The gas phase metallicity is found to be, Z 0.2 Z⊙ without a clear evidence for an enhanced N abundance. However, high resolution spectra covering C iv and N v is needed to perform detailed abundance analysis. High densities (nH) inferred for the system suggests that HE 02381904 is an ideal target for absorption line variability studies. However, we do not find any signature of strong variation in Ne viii and O vi equivalent width from 2002 onwards from the /STIS and COS spectra. As this source is X-ray bright detection of warm absorbers will allow us to get further insight into this hot outflowing gas.
5 acknowledgment
We appreciate the efforts of the many people involved with the design and construction of COS & FUSE and its deployment on the HST. Thanks are also extended to the people responsible for determining the orbital performance of COS and developing the CalCOS data processing pipeline. We wish to acknowledge the IUCAA/IGO staff for their support during our observations. We thank Pushpa Khare for careful reading of the manuscript. SM thanks CSIR for providing support for this work.
References
- Arav et al. (1999) Arav, N., Korista, K. T., de Kool, M., Junkkarinen, V. T., & Begelman, M. C., 1999, ApJ, 516, 27
- Asplund et al. (2009) Asplund, M., Grevesse, N., Sauval, A. J., & Scott, P., 2009, ARA&A, 47, 481
- Bentz et al. (2009) Bentz, M. C., Peterson, B. M., Netzer, H., Pogge, R. W., & Vestergaard, M., 2009, ApJ, 697, 160
- Bower et al. (2006) Bower, R. G., Benson, A. J., Malbon, R., Helly, J. C., Frenk, C. S., Baugh, C. M., Cole, S., & Lacey, C. G., 2006, MNRAS, 370, 645
- Crenshaw et al. (2003) Crenshaw, D. M., Kraemer, S. B., & George, I. M., 2003, ARA&A, 41, 117
- Dai et al. (2008) Dai, X., Shankar, F., & Sivakoff, G. R., 2008, ApJ, 672, 108
- Faucher-Giguère et al. (2011) Faucher-Giguère, C.-A., Quataert, E., & Murray, N., 2011, MNRAS, 2058
- Ferland et al. (1998) Ferland, G. J., Korista, K. T., Verner, D. A., Ferguson, J. W., Kingdon, J. B., & Verner, E. M., 1998, PASP, 110, 761
- Ganguly et al. (2006) Ganguly, R., Sembach, K. R., Tripp, T. M., Savage, B. D., & Wakker, B. P., 2006, ApJ, 645, 868
- Gnat & Sternberg (2007) Gnat, O. & Sternberg, A., 2007, ApJS, 168, 213
- Green et al. (2012) Green, J. C., Froning, C. S., Osterman, S., et al., 2012, ApJ, 744, 60
- Gupta et al. (2005) Gupta, N., Srianand, R., & Saikia, D. J., 2005, MNRAS, 361, 451
- Hall et al. (2011) Hall, P. B., Anosov, K., White, R. L., Brandt, W. N., Gregg, M. D., Gibson, R. R., Becker, R. H., & Schneider, D. P., 2011, MNRAS, 411, 2653
- Hamann (1997) Hamann, F., 1997, ApJS, 109, 279
- Hamann et al. (1995) Hamann, F., Barlow, T. A., Beaver, E. A., Burbidge, E. M., Cohen, R. D., Junkkarinen, V., & Lyons, R., 1995, ApJ, 443, 606
- Hamann & Ferland (1992) Hamann, F. & Ferland, G., 1992, ApJ, 391, L53
- Hamann et al. (2000) Hamann, F. W., Netzer, H., & Shields, J. C., 2000, ApJ, 536, 101
- King (2003) King, A., 2003, ApJ, 596, L27
- Korista et al. (1996) Korista, K., Hamann, F., Ferguson, J., & Ferland, G., 1996, ApJ, 461, 641
- Korista et al. (1992) Korista, K. T., Weymann, R. J., Morris, S. L., et al., 1992, ApJ, 401, 529
- Moos et al. (2000) Moos, H. W., Cash, W. C., Cowie, L. L., et al., 2000, ApJ, 538, L1
- Ojha et al. (2009) Ojha, R., Zacharias, N., Hennessy, G. S., Gaume, R. A., & Johnston, K. J., 2009, AJ, 138, 845
- Onken et al. (2004) Onken, C. A., Ferrarese, L., Merritt, D., Peterson, B. M., Pogge, R. W., Vestergaard, M., & Wandel, A., 2004, ApJ, 615, 645
- Osterman et al. (2011) Osterman, S., Green, J., Froning, C., et al., 2011, Ap&SS, 335, 257
- Petitjean & Srianand (1999) Petitjean, P. & Srianand, R., 1999, A&A, 345, 73
- Piconcelli et al. (2005) Piconcelli, E., Guainazzi, M., Cappi, M., Jimenez-Bailon, E., & Schartel, N., 2005, A&A, 432, 835
- Sahnow et al. (2000) Sahnow, D. J., Moos, H. W., Ake, T. B., et al., 2000, ApJ, 538, L7
- Sambruna et al. (1999) Sambruna, R. M., Eracleous, M., & Mushotzky, R. F., 1999, ApJ, 526, 60
- Silk & Rees (1998) Silk, J. & Rees, M. J., 1998, A&A, 331, L1
- Srianand & Shankaranarayanan (1999) Srianand, R. & Shankaranarayanan, S., 1999, ApJ, 518, 672
- Stalin et al. (2010) Stalin, C. S., Petitjean, P., Srianand, R., Fox, A. J., Coppolani, F., & Schwope, A., 2010, MNRAS, 401, 294
- Telfer et al. (1998) Telfer, R. C., Kriss, G. A., Zheng, W., Davidsen, A. F., & Green, R. F., 1998, ApJ, 509, 132
- Telfer et al. (2002) Telfer, R. C., Zheng, W., Kriss, G. A., & Davidsen, A. F., 2002, ApJ, 565, 773
- Verner et al. (1994) Verner, D. A., Barthel, P. D., & Tytler, D., 1994, A&AS, 108, 287
- Vivek et al. (2009) Vivek, M., Srianand, R., Noterdaeme, P., Mohan, V., & Kuriakosde, V. C., 2009, MNRAS, 400, L6