Ultraluminous Star-Forming Galaxies and Extremely Luminous Warm Molecular Hydrogen Emission at
in the PKS 1138-26 Radio galaxy Protocluster
Abstract
A deep Spitzer Infrared Spectrograph (IRS) map of the PKS 1138-26 galaxy protocluster reveals ultraluminous PAH emission from obscured star formation in three protocluster galaxies, including H-emitter (HAE) 229, HAE 131, and the central Spiderweb Galaxy. Star formation rates of yr-1 are estimated from the 7.7m PAH feature. At such prodigious formation rates, the galaxy stellar masses will double in 0.6-1.1 Gyr. We are viewing the peak epoch of star formation for these protocluster galaxies. However, it appears that extinction of H is much greater (up to a factor of 40) in the two ULIRG HAEs compared to the Spiderweb. This may be attributed to different spatial distributions of star formation–nuclear star formation in the HAEs versus extended star formation in accreting satellite galaxies in the Spiderweb. We find extremely luminous mid-IR rotational line emission from warm molecular hydrogen in the Spiderweb Galaxy, with (H2 0-0 S(3))= erg s-1 (), times more luminous than any previously known H2 emission galaxy (MOHEG). Depending on temperature, this corresponds to a very large mass of of K molecular gas, which may be heated by the PKS 1138-26 radio jet, acting to quench nuclear star formation. There is times more warm H2 at these temperatures in the Spiderweb than what has been seen in low-redshift () radio galaxies, indicating that the Spiderweb may have a larger reservoir of molecular gas than more evolved radio galaxies. This is the highest redshift galaxy yet in which warm molecular hydrogen has been directly detected.
Subject headings:
Galaxies:high-redshift, Galaxies:formation, Galaxies:clusters:individual:PKS 1138-26, Galaxies:individual:Spiderweb1. Introduction
Galaxy clusters are the largest virialized structures in the universe. Massive, X-ray selected clusters are well established at redshift (Finoguenov et al., 2007), and their brightest galaxies have colors consistent with passively evolving ellipticals (e.g., McCarthy et al., 2007). The progenitors of such clusters must have formed at an earlier epoch, around the highest density peaks in the cosmos. Such protoclusters have been found around radio galaxies (Pentericci et al., 2000; Venemans et al., 2007; Hatch et al., 2011; Kuiper et al., 2011; Tanaka et al., 2011), which appear to be construction zones of cluster ellipticals and their supermassive black holes (Lacy, Bunker, & Ridgway, 2000).
The baryonic mass of galaxy clusters is dominated by primordial gas that is virialized and heated to K in the potential wells of dark matter halos (Andreon, 2010; Giodini et al., 2009). A reduction of the gas fraction relative to the cosmic baryon fraction can be explained by a combination of star formation, supernova feedback, and AGN feedback (Bode et al., 2009). There is evidence that protoclusters are X-ray deficient ( erg s-1) compared to clusters at lower redshift (Overzier et al., 2005), supporting the idea that they are in the process of formation and not yet virialized.
Chandra X-ray imaging of the Spiderweb radio galaxy (PKS 1138-26, ) shows extended X-ray emission aligned with the radio lobes (Carilli et al., 2002), which indicates that the X-ray emission may come from gas that is shock-heated by the radio jet rather than virialized in the cluster potential. Large polarization rotation measures are found for PKS 1138-26 and other high-redshift radio galaxy lobes, indicating the presence of large column densities of ionized, magnetized gas (Carilli et al., 1997; Athreya et al., 1998). This gas may have its origin in radio jet-driven outflows (Nesvadba et al., 2006).
Large quantities of shock-heated warm molecular gas are found by Spitzer in 30% of 3C radio galaxies at (Ogle et al., 2010, 2007; Guillard et al., 2012). The heretofore most luminous and distant H2 emission is seen in the Zw 3146 brightest cluster galaxy, with a single H2 line luminosity (H2 0-0 S(3)) erg s-1 (Egami et al., 2006). In radio galaxies, the H2 is most likely powered by kinetic energy from the relativistic jet that is dissipated in the host galaxy interstellar medium (ISM). The large ratio of H2 to PAH luminosity observed in these and other H2 emission galaxies (MOHEGs) can not be generated in stellar photodissociation regions (PDRs). X-ray heating by relatively low-luminosity AGNs is also insufficient to power the observed H2 rotational line luminosities (Ogle et al., 2010). Star formation appears to be suppressed in radio-loud MOHEGs (Nesvadba et al., 2010), falling a factor of below the Kennicutt-Schmidt relation between specific star-formation rate and gas surface density (Kennicutt, 1998).
A spectacular protocluster surrounds the Spiderweb radio galaxy (Kurk et al., 2000). As many as 121 candidate cluster members within a (2.2 Mpc) radius have been identified as possible Ly emitters (37 LAE), H emitters (40 HAE), or extremely red objects (44 EROs) via filter photometry (Kurk et al., 2000, 2004a). A large overdensity of sources with red IRAC [3.6]-[4.5] colors or bright 24 m emission are found within a radius of (Galametz et al., 2012; Mayo et al., 2012). At least 24 cluster members have been spectroscopically detected in Ly (15) or H emission (9) and have redshifts close to that of the Spiderweb (Pentericci et al., 2000; Kurk et al., 2004b; Venemans et al., 2007; Doherty et al., 2010). The cluster consists of two merging sub-clumps, with velocity dispersions of 520 and 280 km s-1 for the associated LAEs and a combined virial mass of (Pentericci et al., 2000). Several HAEs are bound to the Spiderweb Galaxy with a velocity dispersion of 360 km s-1, indicating a virial mass of (Kurk et al., 2004b).
Rest UV to optical continuum imaging of the cluster core with HST shows multiple satellite galaxies with peculiar morphologies within 150 kpc of the Spiderweb Galaxy (Pentericci et al., 1998; Miley et al., 2006; Hatch et al., 2009). An enormous Ly halo imaged by the VLT surrounds the galaxy out to a radius of kpc, indicating a large reservoir of atomic gas (Kurk et al., 2002; Hatch et al., 2008).
We made a deep Spitzer infrared spectroscopic map of the central region of the PKS 1138-26 protocluster, centered on the Spiderweb radio galaxy, in order to explore mid-IR indicators of star formation and shocked gas. Here we present mid-IR spectra of the Spiderweb and two other protocluster galaxies which are bright in the MIPS 24 m band. Spectra of the remaining sources will be presented in a future paper. Distance-dependent quantities in this paper are calculated using cosmological parameters km s-1, , and .
2. Observations
We used the Spitzer Infrared Spectrograph (Houck et al., 2004) to map a strip of the PKS 1138-26 protocluster (Fig. 1). The LL1 (20.5-38.5 m) low-resolution slit () was stepped perpendicular to the slit in steps and parallel to the slit in arcsecond steps to create a map centered on the Spiderweb radio galaxy. Exposures were 2120 s per pointing. The map was repeated 8 times over 5 days, giving a total exposure time of hr and a mean exposure time per pixel of 4.2 hrs. Rotation of the spacecraft and spectrograph slit (PA) over this time period improved the spatial sampling of the map. Parallel data were also recorded in the LL2 (14-21 m) slit, which will be reported elsewhere.
Spectra (Fig. 2) were reduced from SSC Pipeline 18.18 basic calibrated data (BCDs) using pipeline uncertainties and custom background subtraction. The background was estimated by stacking the BCD frames in a time series, masking sources, and fitting each pixel time series with a robust, low-order polynomial. The LL1 spectral cube was built using CUBISM (Smith et al., 2007a), using a spatial oversampling factor of 3, and cleaned using automatic and interactive bad-pixel identification and removal. A noise cube was constructed from the difference of the first and second exposure for each pointing, and its pixel-to-pixel standard deviation was found to agree closely with the pipeline-derived uncertainties as a function of wavelength. For most purposes, we confidently use the pipeline uncertainties in our data analysis. However, these uncertainties appear to significantly underestimate the noise at observed wavelengths m (rest frame 10.4 m). We attribute this to systematically deviant pixels that we were unable to identify and remove in this noisier wavelength range. Feature fluxes measured in this wavelength range, such as those of [S iv] and the 11.3 m PAH, should be interpreted with caution.
Sources were identified and their positions measured in the collapsed IRS cube, weighted by the MIPS 24 m band spectral response (Fig. 1). Spectral extractions were performed using a 3D optimal extraction algorithm that we adapted from SPICE 2D optimal extraction (Narron et al., 2007; Horne, 1986). We used a wavelength-smoothed and interpolated 3D PSF template derived from the Spiderweb itself for optimal extraction. The flux from this source is dominated by the spatially unresolved AGN. Spectra were optimally extracted (using S/N weighting) within an aperture that expands linearly with wavelength and has a diameter of 8 pixels (2.7 native LL1 pixels, or ) at 27m. Such a small aperture is utilized to minimize contamination from nearby sources. A wavelength-independent flux calibration factor equal to the pixel solid angle ( sr/pixel) was derived from the ratio of SPICE over CUBISM extractions of the Spiderweb, in BCDs where it was centered on the slit. We applied a correction for detector fringeing to the Spiderweb spectrum, reducing oscillations in the observed 21-25 m region down to the 1% level.
We used PAHFIT (Smith et al., 2007b) to obtain a least-squares fit to the continuum, emission lines, and PAH features. The continuum was fit with the sum of blackbody spectra covering a range of dust temperatures. No extinction was included in the fits since it did not improve them. The emission lines were fit with unresolved Gaussian line profiles. In the case of emission line blends, the fluxes were summed to give the total flux of the blend, rather than report individual line fluxes. The PAH features are fit by Drude profiles, with rest wavelengths and widths fixed to values appropriate for star-forming low-redshift galaxies, but with relative intensities allowed to vary. While it is not clear a priori that the mean PAH composition and feature shapes should be the same at high redshift, this provides a good fit for most features, except for the 8.6 m PAH which appears to be shifted to shorter wavelength (§3).
3. Results
We present the stacked IRS cube in Figure 1, weighted by the MIPS 24 m band spectral response. We detect 13 sources with peak flux mJy that yield high-quality spectra with peak S/N per 0.18 m bin in the observed 21-35 m band. In this paper, we concentrate on the 3 brightest 24 m sources matched to spectroscopically confirmed cluster members–Spiderweb, PKS 1138-26:[KPR2004] HAE 0229, and PKS 1138-26:[KPR2004] HAE 0131 (hereafter HAE 229 and HAE 131).
The IRS spectrum of the Spiderweb is dominated by hot dust emission from the central AGN (Fig. 2a,b). A silicate emission bump observed at 9.3-11m (rest) is fit by a 120 K blackbody multiplied by the silicate emissivity function. We detect PAH emission at 7.7 m, 8.6 m, and 11.2 m. The 11.33 m PAH feature falls in a noisy region of the spectrum, so it is formally not detected. However, the majority of the reported 11.23 m flux (Table 1) is likely contributed by the blue wing of the 11.33 m PAH feature.
We detect a number unresolved emission lines (Table 2) in the spectrum of the Spiderweb, including [Ne vi], [Ar iii], [S iv], and H2 0-0 S(3). The H2 0-0 S(4) line may be detected, but could be confused with substructure near the peak of the 7.7 m PAH feature. A blend of [Ar ii] and H2 0-0 S(5) is detected at 6.9 m. We confirm the H2 0-0 S(3) line detection with a continuum-subtracted map of the line at (Fig. 1, bottom). This line is only detected at the location of the Spiderweb Galaxy, with a peak significance of in the map and an integrated line detection of in the spectrum.
HAE 229 and HAE 131 both have PAH-rich spectra (Figs. 2c,d, and Table 1). We detect PAH blends at 7.7 m, 8.6 m, and 11.3 m (rest) in both galaxies. The [Ar ii] line is detected in HAE 229 and marginally detected in HAE 131. The [Ne vi] and H2 0-0 S(4) lines may be detected in HAE 131, however it is difficult to clearly distinguish these lines from possible substructure in the 7.7 m PAH feature. While the H2 0-0 S(3) line is formally detected in HAE 131 ( erg s-1 cm-2), the peak of the line is not at the expected wavelength and may be contaminated by a noise spike, so we treat this as an upper limit. This line is clearly not detected in the continuum-subtracted H2 S(3) map (Fig. 1). Hot dust continuum underlies the PAH spectrum in HAE 229 and weaker continuum emission is also visible at the short wavelength end of the HAE 131 spectrum.
Shifting the wavelength of the 8.6 m PAH feature from the standard wavelength of 8.61 m to 8.57 m (corresponding to a Doppler shift of -1400 km s-1) gave a better fit to the spectra of all three sources. We believe this indicates a shift in the intrinsic wavelength rather than a Doppler shift because the emission lines and 7.7 and 11.3 m PAH features have wavelengths consistent with the optical-NIR emission line redshifts. The 8.6/7.7 micron PAH ratios (0.21-0.38) seen in the three galaxies are somewhat greater than the range of PAH ratios (0.11-0.21) seen in low-redshift star-forming galaxies (Smith et al., 2007b). These differences in 8.6 m PAH wavelength and PAH ratios may indicate a difference in chemical composition or excitation of the PAH molecules compared to low-redshift galaxies.
4. Discussion
4.1. Spiderweb Galaxy
The Spiderweb Galaxy is surrounded by a large number of smaller satellite galaxies, seen in HST ACS images (Pentericci et al., 1998; Miley et al., 2006; Hatch et al., 2009). Eleven cluster members or candidates have been identified within our diameter spectral extraction aperture, according to NED (Fig. 1). These include the Spiderweb, X-ray source CXOGBA J114047.9-262906, 4 LAE candidates, 3 HAE candidates, and 2 EROs. Except for the Spiderweb, none have spectroscopic redshifts available. From the strong hot dust emission and low equivalent widths of the PAH features in the Spiderweb spectrum, it is clear that most of the observed 24 m emission comes from the AGN. The strong [Ne vi] and [S iv] emission lines are additional indicators of a dominant AGN contribution to the spectrum.
The Spiderweb has a 7.7m PAH luminosity of erg s-1 (, Table 3). In comparison, the brightest ULIRG in the Elbaz et al. (2011) sample has a PAH-dominated 8 m luminosity of , star-forming IR (SFIR) luminosity of , and a star formation rate of SFR yr-1. The corresponding conversions among 8 m luminosity, total star-forming IR luminosity, and star formation rate are and /SFR yr. Lacking rest-frame far-IR fluxes, we adopt these as representative conversion factors for the ULIRGs in our sample. This gives an approximate PAH-based star-forming FIR luminosity for the Spiderweb of and a star-formation rate of yr-1. Equally large PAH luminosities and PAH-based star-formation rates have been reported in the radio galaxy 6C J1908+7220 (Seymour et al., 2008, yr-1) the Cloverleaf Quasar (Lutz et al., 2007, yr-1), and other high-redshift mm-bright QSOs (Lutz et al., 2008).
We estimate a similar star formation rate of yr-1 from the extended H luminosity of the Spiderweb (Nesvadba et al., 2006). Here we use SFR(H, yr-1)(H) (Kennicutt et al., 1994) and assume no extinction. The extended H luminosity was measured after subtracting the point-like AGN contribution (Nesvadba et al., 2006), but the AGN might still contribute to the extended H emission via photoionization or radio-jet driven shocks.
A much lower star formation rate of yr-1 is estimated from the diffuse 32-kpc radius UV halo (Hatch et al., 2008). This rate increases to 142 yr-1 correcting for screen extinction (E(B-V) from rest UV color), and 325 yr-1 if all of the diffuse and compact UV sources are included in the estimate (Hatch et al., 2008). This is still far below the PAH-based star-formation rate, indicating that the assumption of a uniform dust screen is too simplistic. Instead, much of the star formation in the Spiderweb must be highly obscured ( mag) at rest-UV wavelengths.
The Spiderweb is the brightest and most massive galaxy in the PKS 1138-26 cluster, with a stellar mass of estimated from the SED of the central radio galaxy (Hatch et al., 2009; Seymour et al., 2007). Adding the masses of the satellite galaxies estimated by Hatch et al. (2009) increases the total stellar mass to within our (60 kpc) radius spectral extraction aperture. The stellar mass doubling time scale at the PAH-inferred star formation rate is therefore Gyr. It appears that the Spiderweb is in the process of building the bulk of its stellar mass at the observed epoch. The Spiderweb may gain additional stellar mass (a factor of 1.1-2.2) by accreting known satellite galaxies within a 150 kpc radius (Hatch et al., 2009).
We measure an H2 0-0 S(3) luminosity of erg s-1 (). We note that the H2 0-0 S(2), S(1) and S(0) lines may be similarly luminous, but are redshifted beyond the longest wavelength detectable with the IRS. Taken at face value, the H2 0-0 S(3) and S(5) line fluxes fit by PAHFIT would indicate a temperature of K and an H2 mass of , assuming a single-temperature gas in equilibrium. However, the H2 0-0 S(5) line is blended with [Ar ii]. We estimate a more conservative upper limit on the H2 temperature and lower limit on the H2 mass by assuming that the [Ar ii] H2 0-0 S(5) emission line fit gives an upper limit on the H2 0-0 S(5) line flux. This yields an H2 temperature (for gas contributing to the S(3) and S(5) lines) of 300 K K and a warm molecular hydrogen mass of (Fig. 3).
In the same temperature range, 3C radio galaxies at (Ogle et al., 2010) have warm H2 masses more than times smaller than the Spiderweb (Fig. 3). In the lowest temperature range probed by Spitzer, their H2 0-0 S(0)-S(2) lines indicate warm ( K) H2 masses . It is likely that the Spiderweb has a much larger total warm H2 mass at K than what we have detected with the 0-0 S(3) and S(5) lines at K. If the ratio of warm to total H2 mass is similar to that of low-redshift radio galaxies, then the extremely luminous H2 emission from the Spiderweb could be explained by an extremely large molecular gas mass of . This would give a reasonable H2 to stellar mass ratio of . A similarly large molecular gas mass of has been inferred from CO (1-0) emission from the lensed quasar SMM J041327.2+102743 (Riechers et al., 2011).
We measure a lower limit (from S(3) only) for the ratio of the summed first four H2 0-0 pure rotational lines to 7.7 m PAH of (H2 0-0 S(0)-S(3))/(PAH7.7), more than a factor of 2 greater than the empirical and theoretical ratio of for UV heating in a PDR. This makes the Spiderweb Galaxy the most luminous known radio MOHEG (Ogle et al., 2007, 2010; Guillard et al., 2012), a class of galaxies where the molecular gas is heated by dissipation of mechanical energy. By analogy to low-redshift radio MOHEGs, the presence of a large mass of warm molecular hydrogen indicates that a significant fraction of the molecular gas content of the Spiderweb has been shock-heated by the radio jet, in turn suppressing star formation (Ogle et al., 2010; Nesvadba et al., 2010). Nesvadba et al. (2006) estimate a radio jet mechanical power, based on the radio luminosity of PKS 1138-26, of erg s-1. Only of this would be enough to power the observed H2 0-0 S(3) line. On the other hand, the absorption-corrected (intrinsic cm-2) 2-10 keV X-ray luminosity of the AGN is only erg s-1 (Carilli et al., 2002), which is insufficient to power the H2 emission. The observed ratio (H2 0-0 S(0)-S(3))/(2-10 keV) is more than 5 times greater than the theoretical maximum ratio for AGN X-ray heating of (Ogle et al., 2010; Guillard et al., 2012).
From our Spitzer spectrum, the monochromatic mid-IR luminosity of the dust-obscured Spiderweb AGN is (11 m) erg s-1. Using an IR/UV flux conversion factor of and bolometric IR correction factor of for the AGN dusty torus, both derived from radio galaxies and quasars (Ogle et al., 2006), we estimate an AGN bolometric luminosity of (11 m) erg s-1, times the total IR luminosity from star formation. This is a factor of larger than the bolometric luminosity estimate of Nesvadba et al. (2010), which is based on the absorption-corrected AGN X-ray luminosity (Carilli et al., 2002). Given the uncertainties in the IR and X-ray bolometric corrections, we consider the two estimates to be in reasonable agreement. Using our mid-IR based estimate of the hidden quasar luminosity and an assumed mass-energy conversion efficiency of 0.1, we estimate a mass accretion rate of yr-1 for the supermassive black hole that powers the Spiderweb AGN. This is of the PAH-based instantaneous star formation rate integrated over the entire galaxy.
4.2. HAE 229 and HAE 131
HAE 229 () and HAE 131 () are two of the brightest H emission candidates in the survey of the PKS 1138-26 protocluster by Kurk et al. (2004a), and have confirmed H and [N ii] emission in their NIR (rest-frame optical) spectra (Kurk et al., 2004b). The projected distances from the center of the Spiderweb Galaxy are (280 kpc) and (420 kpc), respectively.
Note that the QSO CXO J114045.9-262916 (PKS 1138: [KPR2004] HAE 0215, ) falls within the spectral extraction aperture SW of HAE 229, (Fig. 1). The positional uncertainty for the QSO is , and we estimate an absolute positional uncertainty of for HAE 229 from our IRS spectral map. The two sources are spatially resolved at the wavelength of the 7.7 m PAH band. By comparing the PAH feature and continuum extracted at the peak pixel of each source, we estimate that of the 7.7m PAH flux and of the 8 m continuum in the HAE 229 spectrum can be contributed by the QSO.
We measure a PAH luminosity for HAE 229 of . The inferred star-forming IR luminosity is and the PAH-derived star formation rate is yr-1, similar to the Spiderweb Galaxy. HAE 229 is one of two red galaxies in the PKS 1138-26 cluster that were detected in H by Doherty et al. (2010) (galaxy 464). The H luminosity (Kurk et al., 2004b) indicates a star formation rate of yr-1, a factor of less than what we estimate from the 7.7 m PAH feature (Table 3). This indicates that the bulk of star formation activity is heavily obscured ( mag) at the wavelength of H. SED fitting yields a stellar mass of , and an age of 2.4 Gyr (Doherty et al., 2010). The time required to double the stellar mass is only 600 Myr, indicating that protocluster galaxy HAE 229 is undergoing a major event in its construction.
We measure a PAH luminosity for HAE 131 of , half as bright as HAE 229 and the Spiderweb. The corresponding estimated IR luminosity and star formation rate are and yr-1. The H luminosity (Kurk et al., 2004b) indicates a star formation rate of 34 yr-1, a factor of 14 less than what we estimate from the 7.7 m PAH feature (Table 3). As for HAE 229, most of the star formation in HAE 131 must be obscured ( mag) at the wavelength of H.
The ultraluminous PAH emission and large PAH/H flux ratios in both HAE 229 and HAE 131 clearly indicate that they are ULIRGs, undergoing a rapid burst of obscured star formation. Similar PAH luminosities and equivalent widths have been seen in other high-redshift, 24 m-selected ULIRGs (Sajina et al., 2007). Tanaka et al. (2011) find that HAEs in the PKS 1138-26 cluster have systematically smaller H/K-band stellar continuum ratios than HAEs in the 4C 23.56 cluster (), attributing this to smaller specific star formation rates. However, we find H extinction factors in two PKS 1138-26 HAEs of 14 and 40, compared to a range of 2-14 in the 4C 23.56 cluster, based on H/24 m fluxes. If this tendency towards larger extinction in PKS 1138-26 HAEs holds up, the difference in H/K-band stellar continuum ratios may be ascribed to differences in extinction, rather than in specific star formation rates.
The lack of high-ionization lines in the HAE 229 spectrum indicates a relatively weak AGN contribution, though there is an indication of hot dust emission at at 6-7 m rest. Detection of [Ne vi] in the HAE 131 spectrum together with the detection of hot dust indicates an AGN contribution, though it must be relatively weak, considering the large PAH equivalent widths. We do not detect H2 0-0 S(3) emission in HAE 229 nor HAE 131, with a 2 upper limit of erg s-1 cm-2 (), even though they have similar PAH luminosities and inferred star formation rates to the Spiderweb. This supports the idea that the radio jet or AGN excites the H2 emission in the Spiderweb, rather than star formation.
5. Conclusions
We have found PAH emission indicating star formation rates of yr-1 in three galaxies in the PKS 1138-26 radio galaxy protocluster, including the Spiderweb central radio galaxy, HAE 229, and HAE 131. The corresponding stellar mass doubling time scales in the Spiderweb and HAE 229 are 1.1 Gyr and Myr, respectively. This indicates that these protocluster galaxies are undergoing a period of rapid growth and that the PKS 1138-26 protocluster is a massive galaxy construction zone. Similarly high star formation rates have been observed in other high-redshift radio galaxies (e.g. Seymour et al., 2008), in contrast to low-redshift () radio galaxies where star formation rates are generally lower ( yr-1), in spite of the presence of up to of molecular gas in the central few kpc (Shi et al., 2007; Ogle et al., 2010; Seymour et al., 2011). Low-redshift radio jets appear to be more effective at suppressing star-formation in their host galaxies. However, the dynamical state and gas physical properties of low-redshift radio galaxies are also much more evolved, as indicated by the presence of virialized hot gas in their halos and surrounding galaxy clusters.
Star formation rates estimated from the 7.7 m PAH feature are a factor of 14-40 greater than estimates based on H, for HAE 229 and HAE 131. This indicates that star formation is heavily obscured (by mag) at H and shorter wavelengths. This is in contrast to the Spiderweb, where the PAH-based and H-based star formation rate estimates are comparable. This may suggest a different mode of more-extended, less obscured star formation in the Spiderweb. This in turn may be consistent with the observed extended UV continuum emission (Hatch et al., 2008) if the UV extinction is more complicated than a simple obscuring screen.
The extended mode of star-formation in the Spiderweb could possibly be a result of negative feedback quenching star-formation in the nucleus, coupled with accretion of many satellite galaxies enhancing star formation in the outer regions of the galaxy. High luminosity H2 0-0 S(3) emission from the Spiderweb indicates a large mass of warm ( K) molecular hydrogen, most likely heated by radio jet feedback from the AGN, which may have already quenched nuclear star formation and may eventually quench quasar activity. In other words, the high-star formation rates observed in high-redshift radio galaxies may be attributed to the accretion of gas and gas-rich satellite galaxies rather than nuclear star formation. At low redshift, the gas has been virialized and heated to K and the satellites have been incorporated into the central radio galaxy, such that there is no longer a steady gas supply for star formation. The remaining gas that is able to cool and make its way into the central kpc-scale disk is unable to form stars efficiently because it is either continuously or episodically heated by the radio jet.
Herschel FIR-sub-mm photometry will determine the total IR luminosities of the galaxies in the PKS 1138-26 protocluster, yielding more accurate star formation rates and dust mass estimates. Herschel PACS spectroscopy may be sensitive enough to detect the H2 S(0) line and thereby measure the total mass of warm molecular gas in the Spiderweb. The extreme luminosity of H2 rotational line emission in the Spiderweb provides a strong incentive for launching a cooled, large aperture FIR space telescope to detect these lines and use them to measure the impact of kinetic energy dissipation on molecular gas and star formation in even higher-redshift galaxies (Appleton et al., 2009).
References
- Andreon (2010) Andreon, S. 2010, MNRAS, 407, 263
- Appleton et al. (2009) Appleton, P. et al. 2009, “The Dark Side of Reionization: Probing Cooling in the Early Universe.” 2010 Decadal Survey White Paper, arXiv:0903.1839
- Athreya et al. (1998) Athreya, R. M., Kapahi, V. K., McCarthy, P. J., & van Breugel, W. 1998, A&A, 329, 809
- Bode et al. (2009) Bode, P., Ostriker, J. P., & Vikhlinin, A. 2009, ApJ, 700, 989
- Cami et al. (2010) Cami, J., Barnard-Salas, J., Peeters, E., & Malek, S. E. 2010, Science, 329, 1180
- Carilli et al. (2002) Carilli, C. L., Harris, D. E., Pentericci, L., Roettgering, H. J. A., Miley, G. K., Kurk, J. D., & van Breugel, W. 2002, ApJ, 567, 781
- Carilli et al. (1997) Carilli, C. L., Roettgering, H. J. A., van Ojik, R., Miley, G. K., & van Breugel, W. J. M. 1997, ApJS, 109, 1
- Doherty et al. (2010) Doherty, M. et al. 2010, A&A, 509, 83
- Egami et al. (2006) Egami, E., Rieke, G. H., Fadda, D., & Hines, D. C. 2006, ApJ, 625, L21
- Elbaz et al. (2011) Elbaz, D. et al. 2011, A&A, 533, 119
- Finoguenov et al. (2007) Finoguenov, A. et al. 2007, ApJS, 172, 182
- Galametz et al. (2012) Galametz, A. et al. 2012, ApJ, in press, arXiv:1202.4489
- Giodini et al. (2009) Giodini, S. et al. 2009, ApJ, 703, 982
- Guillard et al. (2012) Guillard, P., Ogle, P., Emonts, B., Appleton, P., Morganti, R., Tadhunter, C., & Osterloo, T. 2001, ApJ, 747, 95
- Hatch et al. (2008) Hatch, N. A., Overzier, R. A., Roettgering, H. J. A., Kurk, J. D., & Miley, G. K. 2008, MNRAS, 383, 931
- Hatch et al. (2009) Hatch, N. A., Overzier, R. A., Kurk, J. D., Miley, G. K., Rottgering, H. J. A., & Zirm, A. W. 2009, MNRAS, 395, 114
- Hatch et al. (2011) Hatch, N. A. et al. 2011, MNRAS, 410, 1537
- Horne (1986) Horne, K. 1986, PASP, 98, 609
- Houck et al. (2004) Houck, J. R. et al. 2004, ApJS, 154, 18
- Kennicutt (1998) Kennicutt, R. J. 1998, ApJ, 498, 541
- Kennicutt et al. (1994) Kennicutt Jr. R. C., Tamblyn P., & Congdon C. E. 1994, ApJ, 435, 22
- Kuiper et al. (2011) Kuiper, E. et al. 2011, MNRAS, 417, 1088
- Kurk et al. (2002) Kurk, J. D., Rottgering, H. J. A., Miley, G. K., & Pentericci, L. 2002 in RevMexAA Conf. Ser. 13, Emission Lines from Jet Flows, ed. W. J. Henney, W. Steffen, A. C. Raga, & L. Binette (Mexico:RevMexAA), 191
- Kurk et al. (2004a) Kurk, J. D. et al. 2004a, A&A, 428, 793
- Kurk et al. (2004b) Kurk, J. D. et al. 2004b, A&A, 428, 817
- Kurk et al. (2000) Kurk, J. D. et al. 2000, A&A, 358, 1
- Lacy, Bunker, & Ridgway (2000) Lacy, M., Bunker, A. J., & Ridgway, S. E. 2000, AJ, 120, 68
- Lutz et al. (2008) Lutz, D. et al. 2008, ApJ, 684, 853
- Lutz et al. (2007) Lutz, D. et al. 2008, ApJ, 661, L25
- Mayo et al. (2012) Mayo, J. H., Vernet, J., De Breuck, C., Galametz, A., Seymour, N., & Stern, D. 2012, A&A, 539,
- McCarthy et al. (2007) McCarthy, P. J. et al. 2007, ApJ, 664, L17
- Miley et al. (2006) Miley, G. K. et al. 2006, ApJ, 650, 29
- Narron et al. (2007) Narron, R., Ogle, P., & Laher, R. R. 2007, in ASP Conf. Ser. 376, ADASS XVI, ed. R. Shaw, F. Hill, & D. Bell (San Francisco, CA: ASP), 437
- Nesvadba et al. (2010) Nesvadba, N. et al. 2010, A&A, 521, 65
- Nesvadba et al. (2006) Nesvadba, N. et al. 2006, ApJ, 650, 661
- Ogle et al. (2010) Ogle, P. et al. 2010, ApJ, 724, 1193
- Ogle et al. (2007) Ogle, P. et al. 2007, ApJ, 668, 699
- Ogle et al. (2006) Ogle, P., Whysong, D., & Antonucci, 2006, ApJ, 647, 161
- Overzier et al. (2005) Overzier, R. A., Harris, D. E., Carilli, C. L., Pentericci, L., Roettgering, H. J. A., & Miley, G. K. 2005, A&A, 433, 87
- Pentericci et al. (2000) Pentericci, L. et al. 2000, A&A, 361, L25
- Pentericci et al. (1998) Pentericci, L. et al. 1998, ApJ, 504, 139
- Riechers et al. (2011) Riechers, D. et al. 2011, ApJ, 739, 32
- Sajina et al. (2007) Sajina, A. et al. 2007, ApJ, 664, 713
- Seymour et al. (2011) Seymour, N. et al. 2011, MNRAS, 413, 1777
- Seymour et al. (2008) Seymour, N. et al. 2008, ApJ, 681, L1
- Seymour et al. (2007) Seymour, N. et al. 2007, ApJS, 171, 353
- Shi et al. (2007) Shi, Y. et al. 2007, ApJ, 669, 841
- Smith et al. (2007a) Smith, J. D. T. et al. 2007a, PASP, 119, 1133
- Smith et al. (2007b) Smith, J. D. T. et al. 2007b, ApJ, 656, 770
- Solomon & Van den Bout (2005) Solomon, P. M. & Van den Bout, P. A. 2005 ARA&A, 43, 677
- Tanaka et al. (2011) Tanaka, I. et al. 2011, PASJ, 63, S415
- Venemans et al. (2007) Venemans, B. P. et al. 2007, A&A, 461, 823
| Source | 7.42aaFlux and uncertainty or upper limit ( erg s-1 cm W m-2). | 7.60 | 7.85 | 8.33 | 8.57bbPAH feature at 8.6 m is better fit using a central wavelength of 8.57 m than the standard value of 8.61 m . | 11.23 | 11.33 |
|---|---|---|---|---|---|---|---|
| Spiderweb | 2.30 (0.28) | 2.62 (0.07) | 1.15 (0.04) | 1.08 (0.06) | 0.29 (0.14) | ||
| HAE 229 | 1.13 (0.57) | 0.94 (0.08) | 1.88 (0.07) | 0.28 (0.06) | 0.62 (0.04) | 1.82 (0.16) | |
| HAE 131 | 0.95 (0.10) | 1.16 (0.07) | 0.79 (0.06) | 2.24 (0.27) |
| Source | H2 0-0 S(5)+[Ar ii] | [Ne vi] | H2 0-0 S(4) | [Ar iii] | H2 0-0 S(3) | [S iv] |
|---|---|---|---|---|---|---|
| Spiderweb | 0.80 (0.08) | 1.56 (0.04) | 0.61 (0.04) | 0.37 (0.03) | 0.41(0.03) | 1.55 (0.04) |
| HAE 229 | 0.44 (0.07) | |||||
| HAE 131 | 0.17 (0.08) | 0.18 (0.04) | 0.20 (0.04) |
| Source | (PAH7.7)aaNotes. Flux and uncertainty or upper limit ( erg s-1 cm W m-2). | (H)bbH luminosity (). H fluxes for HAE 229 and HAE 131 are from Kurk et al. (2004b). Spiderweb extended narrow H flux has AGN contribution subtracted (Nesvadba et al., 2006). | ccEstimated Star-forming total IR luminosity ()(PAH7.7) (Elbaz et al. 2011). | SFR(PAH)ddPAH-based star formation rate SFR(PAH, yr-1)(PAH7.7)/ (see text). | SFR(H)eeSFR(H, yr-1)(H) (Kennicutt et al., 1994). |
|---|---|---|---|---|---|
| Spiderweb | 4.4 (0.3) | 38 (3) | 7.4 (0.5) | 1100 (60) | 1200 (100) |
| HAE 229 | 3.5 (0.5) | 0.64 (0.17) | 6.0 (0.9) | 880 (130) | 20 (5) |
| HAE 131 | 1.9 (0.2) | 1.1 (0.2) | 3.2 (0.3) | 470 (30) | 34 (6) |
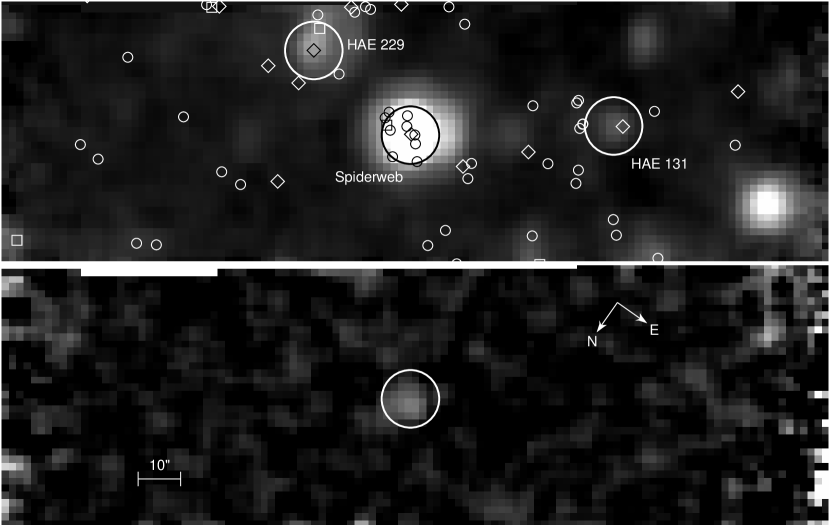
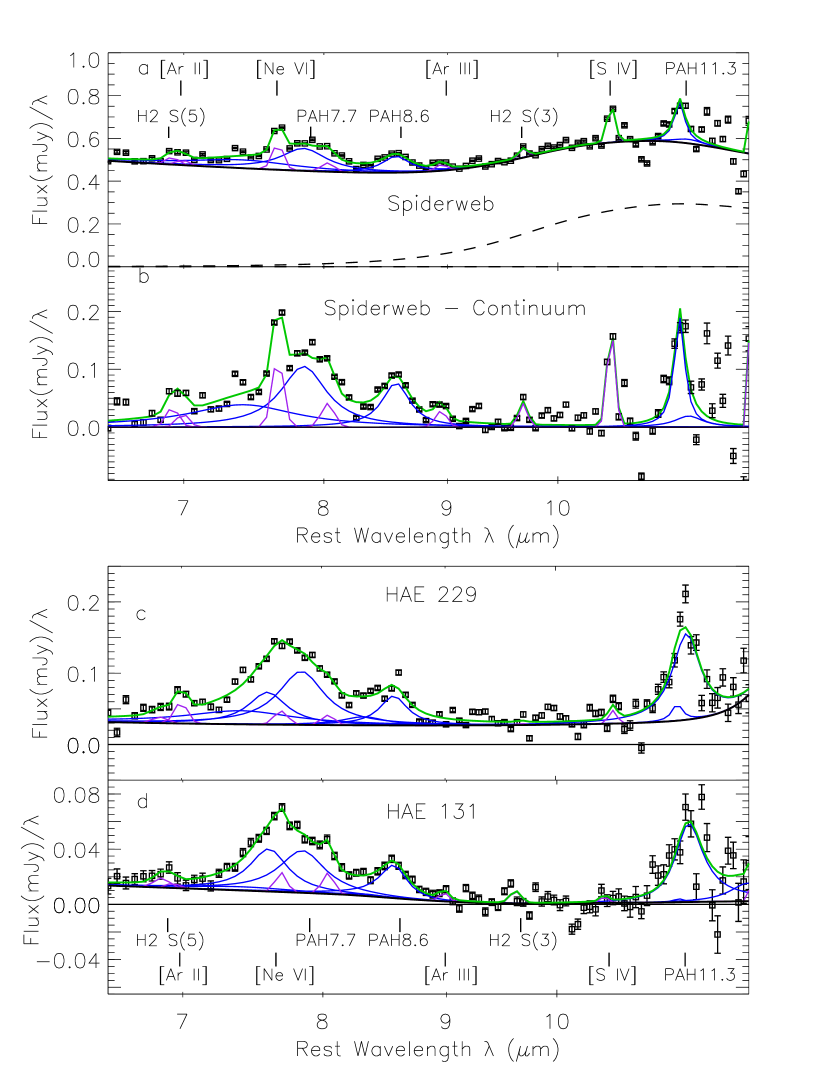
Figure 2 Caption
Spitzer IRS LL1 spectra. (a) Spiderweb radio galaxy (). PAHFIT spectral fit (green) and fit components: continuum (solid black), silicate emission (dashed), PAH features (blue), and emission lines (purple). (b) Spiderweb PAH and emission line spectrum after subtracting continuum fit. Emission lines [Ar ii]+H2 0-0 S(5), [Ne vi], [Ar iii], H2 0-0 S(3), and [S iv]; and 7.7, 8.6, and the blue wing of the 11.3 m PAH are detected. (c) HAE 229 () (d) HAE 131 (). PAH features are detected at 7.7, 8.6, and 11.3 m in both HAE 229 and HAE 131. The [Ar ii] emission line is also detected.
