Effects of interactions on Bose-Einstein condensation of an atomic gas
Abstract
The phase transition to a Bose-Einstein condensate is unusual in that it is not necessarily driven by inter-particle interactions but can occur in an ideal gas as a result of a purely statistical saturation of excited states. However, interactions are necessary for any system to reach thermal equilibrium and so are required for condensation to occur in finite time. In this Chapter we review the role of interactions in Bose-Einstein condensation, covering both theory and experiment. We focus on measurements performed on harmonically trapped ultracold atomic gases, but also discuss how these results relate to the uniform-system case, which is more theoretically studied and also more relevant for other experimental systems.
We first consider interaction strengths for which the system can be considered sufficiently close to equilibrium to measure thermodynamic behaviour. In particular we discuss the effects of interactions both on the mechanism of condensation (namely the saturation of the excited states) and on the critical temperature at which condensation occurs. We then discuss in more detail the conditions for the equilibrium thermodynamic measurements to be possible, and the non-equilibrium phenomena that occur when these conditions are controllably violated by tuning the strength of interactions in the gas.
1 Introduction
Virtually all thermodynamic phase transitions are driven by interactions between particles, which promote symmetry breaking into an ordered state. The phase transition comes about as a result of the competition between the energy, which favours the ordered state, and the entropy, which favours the disordered state. In contrast, Bose-Einstein condensation (BEC) is a purely statistical phase transition, which at least in principle should not rely on interactions. The transition is instead a direct consequence of the finite-temperature saturation of the number of particles in the excited states of the system Einstein:1925a ; huan87 ; Pethick:2002 ; Pitaevskii:2003 . While this statistical argument does not explicitly invoke interactions between the particles, it does assume that the gas is in thermal equilibrium, which is impossible to attain in a completely noninteracting system111In the recently observed Bose-Einstein condensation of a photon gas Klaers:2010 , there is no direct interaction between the light particles. However the interaction with the material environment, which ensures thermalisation, leads to a second-order interaction between the photons.. This makes it challenging to experimentally observe ideal-gas behaviour and disentangle the role of interactions on the thermodynamics and dynamics of condensation.
In this Chapter we review our recent experiments on this topic Tammuz:2011 ; Smith:2011 ; Smith:2011b , performed with an ultracold Bose gas of 39K atoms with tuneable interactions. We were able to identify the interaction regime in which the gas may be considered to be in thermal equilibrium and also to extrapolate our results to the noninteracting limit where direct equilibrium measurements are not possible. This allowed us to verify the statistical-saturation BEC mechanism in the noninteracting limit, and to accurately determine the deviations from ideal-gas behaviour due to interactions; these are seen both in the non-saturation of the excited states and in the shift of the critical point. Before presenting the experimental results we briefly review some background theory that will be useful for our discussion.
1.1 Noninteracting Bosons
We start by considering an ideal, noninteracting Bose gas. We first derive the key results for a uniform system, which we then apply to the trapped gas using the local density approximation (LDA). This “local” approach will be useful later when we consider the effects of interactions, and in particular for the comparison of a uniform Bose gas with one that is harmonically trapped.
The equilibrium momentum distribution of noninteracting bosons with mass at a temperature is given by the Bose distribution function
| (1) |
where is the momentum and the chemical potential. The total particle density can be found by integrating over all momentum states:
| (2) |
where is a polylogarithm function and is the thermal wavelength. We can re-express this result in terms of the phase space density as
| (3) |
Eq. (3) shows that there is a maximum value that can take. This critical value is reached when and is given by (where is the Riemann function). At a given temperature this corresponds to a maximum density. If this density is reached all the excited states saturate and any additional particles must accumulate in the ground state, forming a Bose-Einstein condensate222The singular ground-state contribution to the total density is implicitly excluded from the integral in Eq. (2). As approaches zero from below the ground state occupation can become arbitrarily large, as can be seen by inspecting Eq. (1).. At a given density the BEC transition temperature is given by
| (4) |
where the superscript 0 refers to the fact this is an ideal gas result.
For a gas in a potential we may apply LDA to Eq. (2). This amounts to having a local chemical potential
| (5) |
Specifically for a harmonic trap, , where (with ) are the trapping frequencies along three spatial dimensions.
The local density is then
| (6) |
and the local phase space density . The total number of particles in the excited states can be found by integrating over all space:
| (7) |
The critical point for a trapped gas is the point at which the maximal local reaches the critical value of . For a fixed it makes sense to define the critical point in terms of the critical total particle number . For a harmonic trap, with the geometric mean of the three trapping frequencies , the integral in Eq. (7) for gives
| (8) |
where . The equivalent expression for the transition temperature at a fixed particle number is given by333Finite-size corrections slightly reduce the ideal-gas critical temperature, by , where is the algebraic mean of the trapping frequencies Dalfovo:1999 .
| (9) |
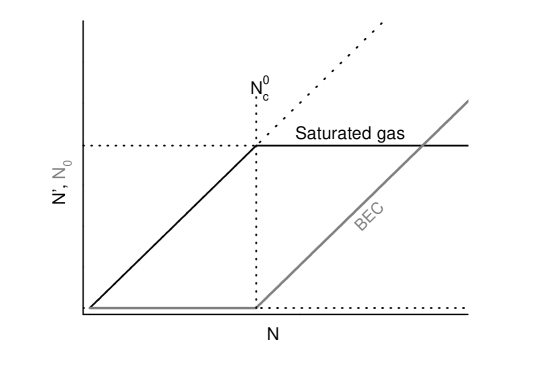
The ideal-gas picture of Bose-Einstein condensation driven by the purely statistical saturation of the excited states is simply summarised graphically in Fig. 1. Here we plot the number of atoms in the excited states, , and in the condensate, , as the total atom number is increased at constant temperature. For no condensate is present and . However for the thermal component is saturated at and the number of condensed atoms is simply given by . In sections 3 and 4 we will examine the effects of interactions both on the saturation of the excited states and on the value of the critical atom number.
1.2 Interacting Bosons
The dominant effects of interactions on Bose-Einstein condensation are quite different in a uniform system and in the experimentally pertinent case of a harmonically trapped atomic gas. This complex problem has a long history and for reviews we refer the reader to, for example, Dalfovo:1999 ; Pethick:2002 ; Pitaevskii:2003 ; Andersen:2004RMP . Here we just briefly introduce some key points.
The simplest theoretical framework to address the effects of interactions in a Bose gas is the Hartree-Fock approximation Dalfovo:1999 . In this mean-field (MF) model one treats the thermal atoms as a “noninteracting” gas of density that experiences a self-consistent MF interaction potential , where , is the s-wave scattering length, and the condensate density. We can then define an effective total potential
| (10) |
and apply the LDA by replacing with in Eq. (6). Meanwhile the condensed atoms feel an interaction potential , where the factor of two difference in the condensate self-interaction comes about due to the lack of the exchange interaction term for particles in the same state444This approach does not take into account the modification of the excitation spectrum due to the presence of the condensate, which is included in more elaborate MF theories such as those of Bogoliubov Bogoliubov:1947 and Popov Popov:1987 (see also Dalfovo:1999 ). However, it is often sufficient to give the correct leading order MF results..
In a uniform system, the MF potential gives just a spatially uniform energy offset and the most interesting effects arise due to beyond-MF quantum correlations.
On the other hand, in a harmonically trapped gas (with repulsive interactions) the inhomogeneous density results in a mean-field repulsion of atoms from the central high-density region. This geometrical effect often dominates and makes it harder to experimentally observe the more interesting beyond-MF physics.
1.3 Chapter outline
In section 2 we briefly outline our experimental procedure for performing precision measurements of the effects of interactions on Bose-Einstein condensation of an atomic gas.
In sections 3 and 4 we discuss the effects of interactions on the thermodynamics of a Bose gas with tuneable interactions. Here the range of interaction strengths we explore experimentally is such that the gas can always be assumed to be in thermal equilibrium. In section 3 we scrutinise the concept of saturation as the driving mechanism for Bose-Einstein condensation, and in section 4 we focus on the interaction shift of the critical point for condensation. We compare the experimental results to both MF and beyond-MF theories and discuss how they relate to the case of a uniform Bose gas.
In section 5 we discuss the conditions required for equilibrium measurements, and non-equilibrium effects that are observed when they are violated.
2 Precision measurements on a Bose gas with tuneable interactions
All the results presented here were obtained by performing conceptually simple experiments which are close in spirit to the ideal-gas theoretical plots of Fig. 1, but are performed for various strengths of repulsive interatomic interactions, characterised by the positive s-wave scattering length .
Our experiments start with a partially condensed gas of 39K atoms, produced in an optical dipole trap Campbell:2010 with varying between 60 and 80 Hz for data taken at different temperatures. The strength of interactions in the gas can be tuned by applying a uniform external magnetic field in the vicinity of a Feshbach scattering resonance centred at 402.5 G Zaccanti:2009 .
In each experimental series we fix by choosing the value of the Feshbach field, and keep the temperature constant by fixing the depth of the optical trap. The total number of trapped atoms is then varied by holding the gas in the trap for a variable time , up to tens of seconds. During this time , initially larger than the critical value , slowly decays and eventually drops below . Meanwhile elastic collisions between the atoms act to redistribute the particles between the condensed and thermal components of the gas.
In each experimental run within a given series, corresponding to a particular hold-time , the thermal atom number and the condensate atom number are extracted from fits to the absorption images of the gas after ms of free time-of-flight (TOF) expansion from the trap Ketterle:1999b ; Gerbier:2004c . The interactions are rapidly turned off at the beginning of TOF, by tuning the Feshbach field to the point. This minimises the condensate expansion and allows us to home in on the critical point by reliably measuring condensed fractions as low as .
For accurate measurements of the small interaction shift of the critical point it is particularly important to minimise various systematic errors, e.g. due to finite-size effects Dalfovo:1999 , uncertainties in the absolute calibration of and , and small anharmonic corrections to the trapping potential Campbell:2010 . We achieve this by performing “differential measurements”, always concurrently running two experimental series which are identical in every respect except for the choice of the scattering length Smith:2011 .
3 Non-saturation of the excited states
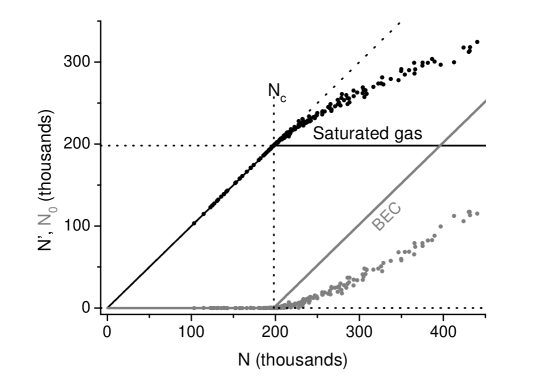
In this section, we focus on the concept of the saturation of the excited states as the underlying mechanism driving the BEC transition. In superfluid 4He, which is conceptually associated with BEC, strong interactions preclude direct observation of purely statistical effects postulated by Einstein for an ideal gas. On the other hand it is generally accepted that a close-to-textbook BEC is observed in the weakly interacting atomic gases. Therefore, one might expect that the saturation inequality is essentially satisfied in these systems, with just the value of the bound on the right-hand side slightly modified by interactions. However, as shown in Fig. 2, this is far from being the case under typical conditions of an ultracold gas experiment. Here, in an experimental series taken with (where is the Bohr radius) and nK, the measured critical atom number is ; if the total number of atoms is increased to , only half of the additional atoms accumulate in the condensate.
In order to explore the relationship between the experimentally observed non-saturation of the thermal component and the interatomic interactions, we first identify the relevant interaction energy. As a BEC is formed and then grows, the change in the average density of the condensed atoms is much larger than the change of the thermal density. Therefore one expects the non-saturation of the thermal component to result primarily from its interaction with the condensate (the term in Eq. (10)). The relevant energy scale is then provided by Dalfovo:1999
| (11) |
where is the spatial extension of the ground state of the harmonic oscillator. The energy is the MF result for the chemical potential of a gas with atoms at zero temperature in the Thomas-Fermi limit Dalfovo:1999 .
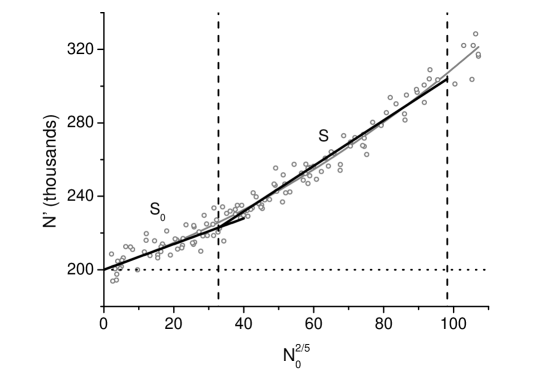
Guided by this scaling, for the data shown in Fig. 2 we plot as a function of in Fig. 3. The growth of with is not perfectly linear, so we quantify the non-saturation effect with two linear slopes: (1) the initial slope for , and (2) the course grained slope for Tammuz:2011 . The data shown in Fig. 3 can also be described by a second-order polynomial fit, as described later.
The initial slope may be compared with the HF model. In order to obtain the non-saturation effect to first order within the HF approach, we only consider the repulsive interaction of the thermal atoms with the condensate and not with other thermal atoms. From Eq. (10) this leads to an effective potential555Note that .
| (12) |
Note that within this theory since when . By integrating Eq. (7) with the effective potential of Eq. (12) one can predict a linear variation of with the small parameter :
| (13) |
with . This first order non-saturation result is identical to that obtained in more elaborate MF approximations, which only modify higher order terms.
The origin of the non-saturation effect can be qualitatively understood by noting that interactions with the condensate modify the effective potential seen by the thermal atoms from a parabola into the “Mexican hat” shape of Eq. (12); this effectively allows the thermal component to occupy a larger volume, which grows with increasing .
From Eqs. (11) and (13) we define the HF non-saturation slope
| (14) |
where is the dimensionless parameter
| (15) |
The measured is found to agree with for a range of and values Tammuz:2011 .
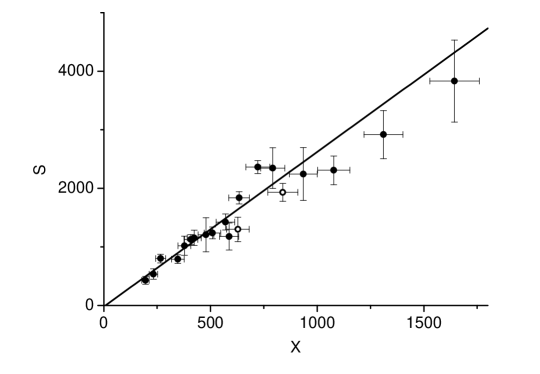
We now consider the non-saturation at higher values, where the data is not well described by Eq. (14). Fig. 4 summarises the non-saturation slopes for a wide range of interaction strengths and temperatures. Within experimental error all data points fall onto a straight line with gradient and intercept when plotted against the dimensionless interaction parameter .
The first and most important thing to notice is that both non-saturation slopes, and , tend to zero for . These experiments thus confirm the concept of a saturated Bose gas, and Bose-Einstein condensation as a purely statistical phase transition in the non-interacting limit.
A question that is still open is the deviation of from the first order HF result , i.e. versus predicted from HF theory. This discrepancy can partially be explained by higher order terms in the mean-field theory, either directly from using Eq. (12) in Eq. (7), or using more elaborate MF theories such as the Popov approximation Pethick:2002 . However the effect is far stronger in the experimental results than any of these MF theories predict. To see this we consider the next order term in Eq. (13), writing with . Experimentally, by identifying with the gradient of this quadratic function evaluated at , we get . For comparison the Popov approximation gives . At present the reason for this discrepancy and the possible role of beyond-MF effects are unclear, and require further investigation.
In summary, we can quantify the non-saturation of the thermal component in a harmonically trapped gas by writing the number of thermal atoms in a partially condensed cloud as
| (16) |
where
| (17) |
and
| (18) |
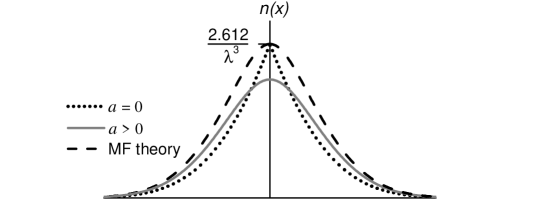
We have seen that in a harmonic trap the dominant non-saturation effect is “geometric”, arising from an interplay of the mean-field repulsion and the inhomogeneity of the condensate density. It is then interesting to consider the case of a uniform system, where this geometric effect is absent. Within MF theory, as the total density of a uniform Bose gas is increased past the critical value the thermal density actually decreases. This is due to the fact that the atoms in the condensate have less interaction energy, as discussed in section 1.2. In addition, close to the transition, beyond-MF effects are expected to play an important role. This would make measurements in a uniform system (or of the local density in a trapped system) particularly interesting.
4 Interaction shift of the transition temperature
Having considered the effect of interactions on the saturation of the thermal component we now consider the location of the critical point itself.
It is generally accepted that in a uniform system there is no interaction shift of the critical temperature at the level of mean-field theory. However, the beyond-MF correlations between particles which develop near the critical point are expected to shift Lee:1957TcShift ; Lee:1958TcShift2 ; Bijlsma:1996 ; Baym:1999 ; Holzmann:1999 ; Reppy:2000 ; Arnold:2001 ; Kashurnikov:2001 ; Holzmann:2001 ; Baym:2001 ; Kleinert:2003 ; Andersen:2004RMP ; Holzmann:2004 . For several decades there was no consensus on the functional form, or even on the sign of this shift (for an overview see e.g. Arnold:2001 ; Baym:2001 ; Andersen:2004RMP ; Holzmann:2004 ). It is now generally believed that the shift is positive and to leading order given by Arnold:2001 ; Kashurnikov:2001 :
| (19) |
where and is the thermal wavelength at temperature . Equivalently, the shift at constant is . The positive implies that condensation occurs at a phase space density below the ideal-gas critical value of 2.612.
The problem of the shift in a harmonically trapped gas is even more complex. In this case, at least for weak interactions, the shift is dominated by an opposing effect that reduces the critical temperature Giorgini:1996 . This negative shift is due to the broadening of the density distribution by repulsive interactions (see Fig. 5). To leading order it can be calculated analytically using MF theory Giorgini:1996 , by self-consistently solving Eq. (6) with :
| (20) |
For the experimentally relevant range of interaction strengths, , we numerically obtain the second-order MF shift, Smith:2011b .
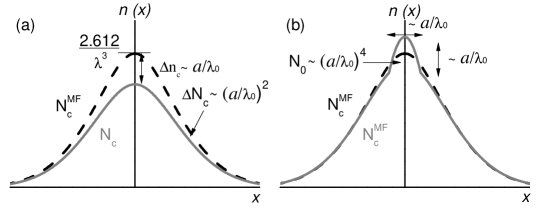
The two opposing effects of repulsive interactions on the critical point of a trapped gas are visually summarised in Fig. 5, where we sketch the density distribution at the condensation point for an ideal and an interacting gas at the same temperature666The shift of the critical point can be equivalently expressed as or , with .. In the spirit of LDA, the critical density should be reduced by interactions. However, interactions also broaden the density distribution. For weak interactions the latter effect is dominant, making the overall interaction shift positive, or equivalently negative.
The dominance of the negative MF shift of over the positive beyond-MF one goes beyond the difference in the numerical factors in Eqs. (19) and (20). In a harmonic trap, at the condensation point only the central region of the cloud is close to criticality777The size of the central critical region is , where is the thermal radius of the cloud Arnold:2001b .; this reduces the net effect of critical correlations so that they affect only at a higher order in . The MF result of Eq. (20) should therefore be exact at first order in . The higher-order beyond-MF shift is still expected to be positive, but the theoretical consensus on its value has not been reached Houbiers:1997 ; Holzmann:1999b ; Arnold:2001b ; Davis:2006 ; Zobay:2009 .
4.1 Measurements on a harmonically trapped Bose gas
Since the early days of atomic BECs there have been several measurements of the interaction shift in a harmonically trapped gas Ensher:1996 ; Gerbier:2004 ; Meppelink:2010 . These experiments, performed at ranging from Meppelink:2010 to 0.024 Gerbier:2004 , nicely confirmed the theoretical prediction for the linear MF shift of Eq. (20), but could not discern the beyond-MF effects of critical correlations.
The recent measurements Smith:2011 presented here provided the first clear observation of the beyond-MF shift in a trapped atomic gas. Several improvements contributed to making this possible. First, we explored slightly higher interaction strengths, up to . Second, by performing precision measurements outlined in section 2, and directly accessing the small differential shift due to the variation in , we significantly reduced the experimental error bars. Third, understanding the non-saturation effects discussed in section 3 was also essential for accurately determining the critical point from the measurements performed close to it (see Fig. 6).
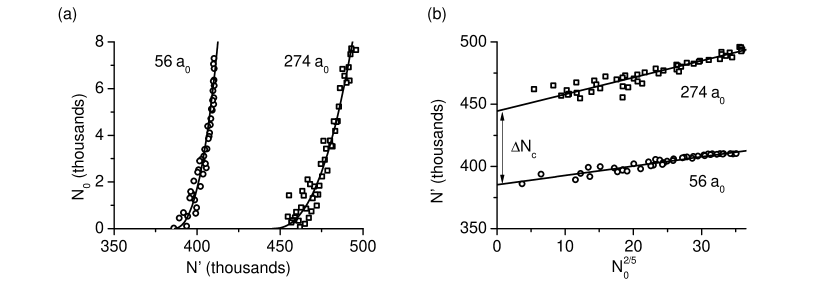
Fig. 6 illustrates a differential measurement with and . The rise of in Fig. 6(a) is not simply vertical because the thermal component is not saturated at (see section 3). It is therefore essential to carefully extrapolate to the limit in order to accurately determine . For small the extrapolation is done using , with the non-saturation slope given by Eq. (17).
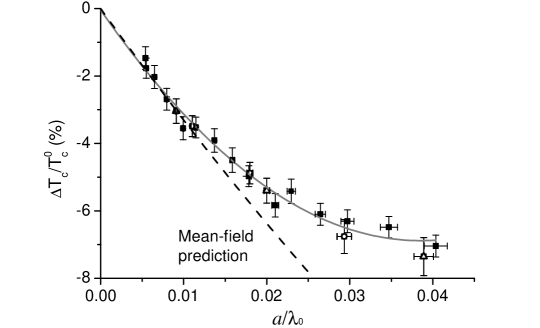
In Fig. 7 we summarise our measurements of Smith:2011 . The data taken with different atom numbers, , fall onto the same curve, confirming that the results depend only on the interaction parameter . The MF prediction agrees very well with the data for , but for larger there is a clear deviation from this prediction. All the data are fitted well by a second-order polynomial
| (21) |
with and . The value of is in agreement with the MF prediction of . The value strongly excludes the MF result of and its sign is consistent with the expected effect of beyond-MF critical correlations. Fixing (which is expected to be exact even including beyond-MF effects) gives an improved estimate of .
4.2 Connection with a uniform Bose gas
In order to make a connection between the experiments on trapped atomic clouds and the theory of a uniform Bose gas we also need to consider the effect of interactions on the critical chemical potential .
In a uniform gas the interactions differently affect (or equivalently ) and at both MF and beyond-MF level. The simple MF shift (where ) has no effect on condensation. To lowest beyond-MF order we have888Note that is not just a constant but contains logarithmic corrections in Arnold:2001 . We neglect these in our discussion since they are not discernible at the current level of experimental precision.:
| (22) |
We see that there is a qualitative difference between Eqs. (19) and (22). Specifically, we have , but . This difference highlights the fact that the problem of the shift is non-perturbative; near criticality the equation of state does not have a regular expansion999The non-interacting equation of state (Eq. (3)) cannot be expanded about in , but rather in ; up to first order this expansion gives . This scaling goes some way in explaining the qualitative difference between Eqs. (19) and (22) although it cannot be used quantitatively. in , otherwise one would get .
For a harmonic trap, within LDA the uniform-system results for and apply in the centre of the trap, and elsewhere local is given by Eq. (5). The result for the shift however does not carry over easily to the non-uniform case. As illustrated in Fig. 8(a), in the centre of the trap we expect , but the measured beyond-MF (see Eq. (21)).
In fact, the experimentally observed shift (Eq. (21)) qualitatively mirrors Eq. (22), with the MF term linear in and the beyond-MF one quadratic in (to leading orders). This similarity can be understood as follows: The interaction shift of affects the density everywhere in the trap; outside the small critical region the equation of state is regular in and the local density shift is simply proportional to the local shift; the contribution to the total shift from the non-critical region greatly outweighs the contribution from within the critical region and therefore one qualitatively expects . More quantitatively, this connection is given by101010Note that this relationship is closely related to Eq. (13). Arnold:2001
| (23) |
The key conclusion of this discussion is therefore that the beyond-MF shift observed in a trapped gas is directly related to the beyond-MF shift (in either trapped or uniform system). It does not however directly reveal the expected linear shift and the theoretically most intriguing non-perturbative connection between and shifts. In fact one could say that the historically puzzling (theoretical) connection between and is just replaced by the puzzling connection between (expected) and (measured) .
This problem can be partly overcome by studying the condensed fraction in a trapped atomic cloud at the MF-predicted critical point Smith:2011b . By definition vanishes within MF theory, and so directly measures the effect of critical correlations which shift above . At a fixed we consider the condensed fraction of a gas, , at the point where , as illustrated in Fig. 8(b). The analogous quantity for a uniform gas was first theoretically studied by Holzmann and Baym Holzmann:2003 , who showed that111111This scaling holds for any distance from the critical point given by . By applying it to the MF critical point we neglect the logarithmic corrections to , which are so far not experimentally observable. . The condensate density vanishes at the point where the local , so from Eqs. (5) and (22) we get that the spatial extension of the condensate is also , and hence .
The quartic scaling of with is thus directly related to the expected linear scaling of with ; the two scalings are simply connected by the volume of the critical region, . This scaling is indeed confirmed experimentally Smith:2011b , as shown in Fig. 9.
One can take the comparison with theory beyond just the scaling of with , and quantitatively compare the measured at the MF critical point with the Monte-Carlo (MC) calculations Prokofev:2004 for a uniform gas. This also works out very well, with the measured and predicted agreeing within a few percent Smith:2011b . It is however important to carefully summarise the conceptual steps involved in this comparison:
(i) On the one hand, the measurements of the shift Smith:2011 experimentally provide (up to logarithmic corrections) the value of , via Eqs. (21), (22), and (23) Smith:2011b .
(ii) On the other hand, the MC calculations Kashurnikov:2001 ; Prokofev:2004 that predict the shift of Eq. (19) also provide tabulated values of the uniform-system condensate density for any .
(iii) Combining these two results and the LDA (Eq. (5)) we calculate the expected in a trapped gas with and find excellent agreement with the measurements shown in Fig. 9 Smith:2011b .
Overall this provides strong cross-validation of theory and experiment. However it is important to note that the two different measurements of beyond-MF effects (i.e. of the shift and ) do not provide two independent quantitative tests of the uniform-system theory. Instead, what we have shown is that they are consistently connected via the MC calculations for a uniform system. Finally it is also important to stress that we are still lacking a direct measurement of the shift, which would explicitly test the historically most debated theoretical result of Eq. (19). This goal remains open for future measurements, either of the local density in a harmonically trapped gas or on a uniformly trapped atomic gas.
5 Equilibrium criteria and non-equilibrium effects
Finally, we discuss the criteria for the measurements on a trapped Bose gas to faithfully represent its equilibrium properties, and the non-equilibrium effects revealed when they are violated. It is helpful to distinguish two types of non-equilibrium behaviour, transient and intrinsic.
Transient non-equilibrium effects are more familiar, and occur whenever some system parameter, such as the interaction strength, is rapidly changed (quenched). After such a quench the system relaxes towards its new equilibrium. Classically, one can estimate the relaxation time to be several elastic scattering times , where is the elastic scattering rate Monroe:1993 ; Arndt:1997 ; Newbury:1995 ; Kavoulakis:2000c .
However a system with continuous dissipation can only be “close to” thermodynamic equilibrium and is to some extent always intrinsically out of equilibrium. The proximity to equilibrium broadly depends on the competition between relaxation and dissipation. For an atomic gas, this leads to a criterion based on the dimensionless parameter , where is some characteristic dissipation time, e.g. for atom loss. In practice, the relevant and the criteria for equilibrium measurements depend on the required measurement precision.
In the case of the measurements presented in section 4, is determined to about , so we require that the gas continuously (re-)equilibrates on a timescale corresponding to only atom-loss. This requires about 100 times higher than one would naively conclude by taking the lifetime of the cloud as the relevant timescale.
An interesting question is then what happens if we violate these stringent equilibrium criteria. In Fig. 10(a) we show measurements extending beyond the equilibrium region shown in Fig. 7, and in Fig. 10(b) we plot the corresponding . Individually, and vary vastly as a function of ( increasing and decreasing) Smith:2011 , but the breakdown of equilibrium appears to occur at in both the low- and high- limit.
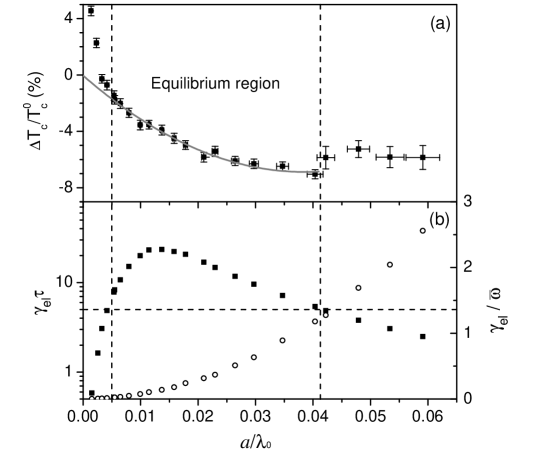
In the small- limit the apparent is significantly above the equilibrium curve. We can qualitatively understand this effect within a simple picture. In this regime, losses are dominated by one-body processes which equally affect and . The net effect of equilibrating elastic collisions would therefore be to transfer atoms from the condensate to the thermal cloud. However the dissipation rate is too high compared to , and so remains non-zero even after the total atom number drops below the equilibrium critical value .
In the large- limit the initial breakdown of equilibrium again appears to result in condensates surviving above the equilibrium . However the physics in this regime is much richer, with several potentially competing effects requiring further investigation. For example, three-body decay affects and differently, the thermal component is far from saturation, and the thermal component of the gas also enters the hydrodynamic regime, .
It is interesting that we observe “superheated” BECs for both very weak and very strong interactions. Further study of these effects should prove useful for improving the understanding of condensation in intrinsically out-of-equilibrium systems, such as polariton gases.
References
- (1) A. Einstein, Sitzungsberichte/Physikalische Klasse, Preussische Akademie der Wissenschaften 1, 3 (1925).
- (2) K. Huang, Statistical Mechanics (Wiley, New York, 1987).
- (3) C. Pethick, H. Smith, Bose–Einstein Condensation in Dilute Gases (Cambridge University Press, Cambridge, 2002).
- (4) L. Pitaevskii, S. Stringari, Bose–Einstein Condensation (Oxford University Press, Oxford, 2003).
- (5) J. Klaers, J. Schmitt, F. Vewinger, M. Weitz, Nature 468, 545 (2010).
- (6) N. Tammuz, R.P. Smith, R.L.D. Campbell, S. Beattie, S. Moulder, J. Dalibard, Z. Hadzibabic, Phys. Rev. Lett. 106, 230401 (2011).
- (7) R.P. Smith, R.L.D. Campbell, N. Tammuz, Z. Hadzibabic, Phys. Rev. Lett. 106, 250403 (2011).
- (8) R.P. Smith, N. Tammuz, R.L.D. Campbell, M. Holzmann, Z. Hadzibabic, Phys. Rev. Lett. 107, 190403 (2011).
- (9) F. Dalfovo, S. Giorgini, L.P. Pitaevskii, S. Stringari, Rev. Mod. Phys. 71, 463 (1999).
- (10) J.O. Andersen, Rev. Mod. Phys. 76, 599 (2004).
- (11) N.N. Bogoliubov, J. Phys. (USSR) 11, 23 (1947).
- (12) V.N. Popov, Functional Integrals and Collective Modes (Cambridge University Press, Cambridge, 1987).
- (13) R.L.D. Campbell, R.P. Smith, N. Tammuz, S. Beattie, S. Moulder, Z. Hadzibabic, Phys. Rev. A 82, 063611 (2010).
- (14) M. Zaccanti, B. Deissler, C. D’Errico, M. Fattori, M. Jona-Lasinio, S. Mueller, G. Roati, M. Inguscio, G. Modugno, Nature Physics 5, 586 (2009).
- (15) W. Ketterle, D.S. Durfee, D.M. Stamper-Kurn, Bose–Einstein condensation in atomic gases. Proceedings of the International School of Physics Enrico Fermi, Course CXL (IOS Press, Amsterdam, 1999).
- (16) F. Gerbier, J.H. Thywissen, S. Richard, M. Hugbart, P. Bouyer, A. Aspect, Phys. Rev. A 70, 013607 (2004).
- (17) T.D. Lee, C.N. Yang, Phys. Rev. 105, 1119 (1957).
- (18) T.D. Lee, C.N. Yang, Phys. Rev. 112, 1419 (1958).
- (19) M. Bijlsma, H.T.C. Stoof, Phys. Rev. A 54, 5085 (1996).
- (20) G. Baym, J.P. Blaizot, M. Holzmann, F. Laloë, D. Vautherin, Phys. Rev. Lett. 83, 1703 (1999).
- (21) M. Holzmann, W. Krauth, Phys. Rev. Lett. 83, 2687 (1999).
- (22) J.D. Reppy, B.C. Crooker, B. Hebral, A.D. Corwin, J. He, G.M. Zassenhaus, Phys. Rev. Lett. 84, 2060 (2000).
- (23) P. Arnold, G. Moore, Phys. Rev. Lett. 87, 120401 (2001).
- (24) V.A. Kashurnikov, N.V. Prokof’ev, B.V. Svistunov, Phys. Rev. Lett. 87, 120402 (2001).
- (25) M. Holzmann, G. Baym, J.P. Blaizot, F. Laloë, Phys. Rev. Lett. 87, 120403 (2001).
- (26) G. Baym, J.P. Blaizot, M. Holzmann, F. Laloë, D. Vautherin, Eur. Phys. J. B 24, 107 (2001).
- (27) H. Kleinert, Modern Physics Letters B 17, 1011 (2003).
- (28) M. Holzmann, J.N. Fuchs, G.A. Baym, J.P. Blaizot, F. Laloë, C. R. Physique 5, 21 (2004).
- (29) S. Giorgini, L.P. Pitaevskii, S. Stringari, Phys. Rev. A 54, R4633 (1996).
- (30) P. Arnold, B. Tomášik, Phys. Rev. A 64, 053609 (2001).
- (31) M. Houbiers, H.T.C. Stoof, E.A. Cornell, Phys. Rev. A 56, 2041 (1997).
- (32) M. Holzmann, W. Krauth, M. Naraschewski, Phys. Rev. A 59, 2956 (1999).
- (33) M.J. Davis, P.B. Blakie, Phys. Rev. Lett. 96, 060404 (2006).
- (34) O. Zobay, Laser Physics 19, 700 (2009).
- (35) J.R. Ensher, D.S. Jin, M.R. Matthews, C.E. Wieman, E.A. Cornell, Phys. Rev. Lett. 77, 4984 (1996).
- (36) F. Gerbier, J.H. Thywissen, S. Richard, M. Hugbart, P. Bouyer, A. Aspect, Phys. Rev. Lett. 92, 030405 (2004).
- (37) R. Meppelink, R.A. Rozendaal, S.B. Koller, J.M. Vogels, P. van der Straten, Phys. Rev. A 81, 053632 (2010).
- (38) M. Holzmann, G. Baym, Phys. Rev. Lett. 90, 040402 (2003).
- (39) N. Prokof’ev, O. Ruebenacker, B. Svistunov, Phys. Rev. A 69, 053625 (2004).
- (40) C.R. Monroe, E.A. Cornell, C.A. Sackett, C.J. Myatt, C.E. Wieman, Phys. Rev. Lett. 70, 414 (1993).
- (41) M. Arndt, M.B. Dahan, D. GuÈry-Odelin, M.W. Reynolds, J. Dalibard, Rev. Mod. Phys. 79, 625 (1997).
- (42) N.R. Newbury, C.J. Myatt, C.E. Wieman, Phys. Rev. A 51, R2680 (1995).
- (43) G.M. Kavoulakis, C.J. Pethick, H. Smith, Phys. Rev. A 61, 053603 (2000).