Characterizing Cosmic-Ray Propagation in Massive Star-Forming Regions: The Case of 30 Doradus and the Large Magellanic Cloud
Abstract
Using infrared, radio, and -ray data, we investigate the propagation characteristics of cosmic-ray (CR) electrons and nuclei in the 30 Doradus (30 Dor) star-forming region in the Large Magellanic Cloud (LMC) using a phenomenological model based on the radio–far-infrared correlation within galaxies. Employing a correlation analysis, we derive an average propagation length of pc for GeV CR electrons resident in 30 Dor from consideration of the radio and infrared data. Assuming that the observed -ray emission towards 30 Dor is associated with the star-forming region, and applying the same methodology to the infrared and -ray data, we estimate a GeV propagation length of pc for the CR nuclei. This is approximately twice as large as for GeV CR electrons, corresponding to a spatial diffusion coefficient that is times higher, scaling as with depending on the smearing kernel used in the correlation analysis. This value is in agreement with the results found by extending the correlation analysis to include GeV CR nuclei traced by the GeV -ray data (). Using the mean age of the stellar populations in 30 Dor and the results from our correlation analysis, we estimate a diffusion coefficient cm2 s-1. We compare the values of the CR electron propagation length and surface brightness for 30 Dor and the LMC as a whole with those of entire disk galaxies. We find that the trend of decreasing average CR propagation distance with increasing disk-averaged star formation activity holds for the LMC, and extends down to single star-forming regions, at least for the case of 30 Dor.
Subject headings:
cosmic rays – galaxies: individual (LMC) – rays: galaxies – Hii regions – infrared: galaxies – radio continuum: galaxies – stars: formation1. Introduction
Cosmic rays (CRs) are a dynamically important component of the interstellar medium (ISM) in galaxies. Yet their role in shaping galaxy evolution is currently unclear due to the difficulties in characterizing their origin and propagation in the ISM (e.g., Strong et al., 2007). The energy density of CRs is comparable to that of magnetic fields, as well as the radiation fields and turbulent motions of the interstellar gas in galaxies. Together, CRs and large-scale magnetic fields comprise a relativistic plasma whose interactions with the interstellar gas shape the overall chemistry and heating of the ISM (e.g., Boulares & Cox, 1990; Ferrière, 2001; Cox, 2005), and may also play a significant role regulating star-formation processes (e.g., Socrates et al., 2008; Papadopoulos, 2010; Papadopoulos et al., 2011).
The diffuse emissions from the radio to high-energy rays ( MeV), produced by various interactions between CRs and the interstellar gas, radiation and, magnetic fields, are the best way to characterize the physics of CRs throughout most of the Milky Way, and other galaxies. For example, the CR lepton component can be probed by radio, X-ray, and -ray observations. The radio emission arising from the injection of CR electrons from supernova remnants trace these particles as they propagate through large-scale magnetic fields and lose energy from synchrotron radiation. Similarly, the same CR electrons inverse Compton (IC) scatter off the interstellar radiation field (ISRF) and cosmic microwave background, yielding observable emissions from X-ray to -ray energies (Porter et al., 2008). High-energy rays are particularly useful because this energy range gives access to the dominant hadronic component in CRs via the observation of rays from the decay of neutral pions produced by inelastic collisions between CR nuclei and the interstellar gas (Pollack & Fazio, 1963).
Externally viewed galaxies have the advantage of mitigating line-of-sight confusion that hampers interpretation of the diffuse emissions of the Milky Way. While such observations can be used to determine the present distribution of CRs, understanding their propagation history remains difficult without knowledge of the initial distribution of CR sources. Using the tight, empirical correlation between the far-infrared (FIR) and (predominantly) non-thermal radio continuum emission from galaxies (de Jong et al., 1985; Helou et al., 1985), a number of studies have attempted to characterize the propagation of CR electrons in external galaxies (e.g., Marsh & Helou, 1998; Murphy et al., 2006a, 2008). The underlying physics relating the radio and FIR emission from galaxies lies in the process of massive star formation: young massive stars are the dominant sources of dust heating, and end their lives as supernovae whose remnants presumably accelerate and inject CR electrons into the ISM where they produce diffuse synchrotron emission. It was hypothesized that the radio image of a galaxy should resemble a smoothed version of its infrared image, because the mean free path of dust-heating photons ( pc) is significantly shorter than the typical diffusion length of CR electrons ( kpc) (Bicay & Helou, 1990). This phenomenology is supported by studies within nearby galaxies at kpc (e.g., Marsh & Helou, 1998) and few hundred pc (e.g., Murphy et al., 2006a) scales, as well as on scales of pc in the Large Magellanic Cloud (LMC, Hughes et al., 2006). Investigations on sub-kpc scales within a sample of nearby spirals have even shown a dependence of the typical propagation length of CR electrons on star-formation activity arising from the predominant youth of CR electron populations in galaxies with enhanced disk-averaged star formation rates (Murphy et al., 2006b, 2008).
Recently, using 11 months of data, the LMC was detected by the Fermi-LAT (Abdo et al., 2010b) at high significance with the resolved -ray emission showing very little correlation with the large-scale distribution of the gas column density. If CRs freely diffuse in the ISM of the LMC, as they appear to in the Milky Way, the -ray emission should be correlated with the distribution of gas, which is predominantly neutral hydrogen and helium in the LMC (Staveley-Smith et al., 2003). Instead, the observed -ray emission for the LMC is more strongly correlated with tracers of massive star-forming regions. Employing the multi-frequency diffuse emissions from radio to -ray energies, we can investigate for the first time the propagation of both CR electrons and nuclei associated with a star-forming region in an externally resolved galaxy, 30 Dor in the LMC.
2. Data and Analysis
We compiled archival infrared and radio data, together with 32 months of -ray data from the Fermi-LAT for our analysis. We assume a distance to 30 Dor of 50 kpc throughout this analysis111Taken from the NASA Extragalactic Database (NED; http://nedwww.ipac.caltech.edu), where there are currently 275 references for individual distance measurements to the LMC.
2.1. Spitzer Infrared Data
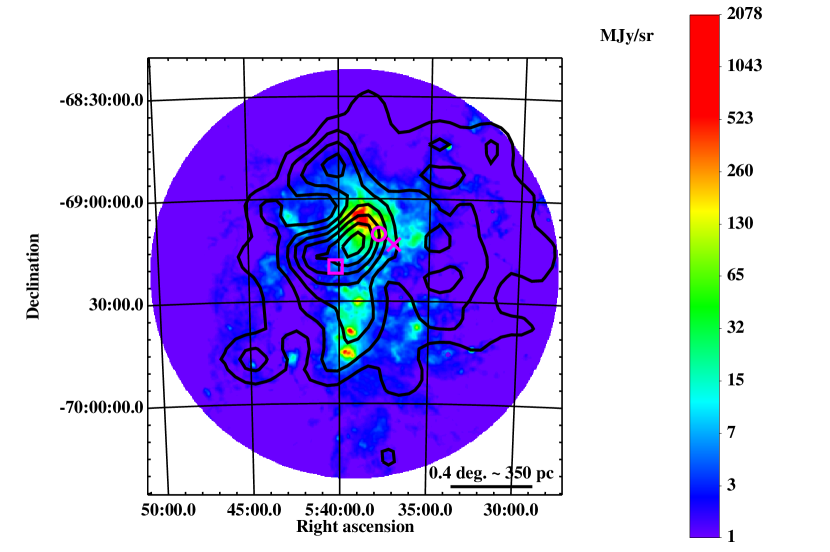
Spitzer imaging of the LMC was carried out as part of the Surveying the Agents of a Galaxy’s Evolution (SAGE; Meixner et al., 2006) legacy program. The observations covered an area of over the LMC in all IRAC (3.6, 4.5, 5.8, and 8 m) and MIPS (24, 70, and 160 m) bandpasses. The individual observations were calibrated, combined, and mosaicked by the SAGE team, using a custom pipeline (see Meixner et al., 2006, for further details). Because we are only interested in diffuse emission, we use point-source subtracted versions of these images prepared by the SAGE team (see right panel of Figure 1). For the present study, we only make use of the MIPS 24, 70, and 160 m data, which have native resolutions of 7, 17″, and 38″, respectively. The photometric uncertainties are conservatively taken to be 5, 10, and 15% at 24, 70, and 160 m, respectively (see the MIPS Instrument Handbook222http://irsa.ipac.caltech.edu/data/SPITZER/docs/mips/mipsinstrumenthandbook/).
The majority of the emission at 24 m arises from dust heated in the vicinity of massive stars, which are the progenitors of core-collapse supernovae. Consequently, the 24 m data are used as a proxy for the CR source distribution in our phenomenological modeling. We use the full infrared data (i.e., 24, 70, and 160 m imaging) to estimate the radiation field energy density over the LMC and 30 Dor (see 2.4).
2.2. Parkes+ATCA Radio Data
We use combined 1.4 GHz single-dish (Parkes 64 m) and interferometric (ATCA) data presented in Hughes et al. (2006), where a much more detailed description of the data preparation can be found. We employ a version of the radio map that has point sources removed (see left panel of Figure 1) from the map using a median filter technique (see Hughes et al., 2006) because more than 90% of such sources are expected to be background AGN (Marx et al., 1997). The angular resolution of the final combined mosaic is 40″, and sets the resolution for our analysis between the radio and infrared data. At our assumed distance for the LMC, this projects to a linear scale of pc.
Because we are interested in the non-thermal component of the radio data, we subtract the contribution from thermal (free-free) emission using a scaled version of the 24 m image following Equation 2 of Murphy et al. (2006b). This relation is based on the empirical correlation found between the 24 m and extinction-corrected Pa luminosities from star-forming regions within NGC 5194 by Calzetti et al. (2005). Although not universal (e.g., Pérez-González et al., 2006; Calzetti et al., 2007), it has proved to be a good first-order estimate of the thermal radio emission in nearby galaxies when compared to thermal fractions derived from multifrequency radio data (e.g., Murphy et al., 2008).
To check the reliability of our free-free emission estimate, we compare with the thermal fraction derived from standard radio spectral decompositions using single-dish radio data from the literature: 1.4 GHz (Klein et al., 1989), 2.3 GHz (Mountfort et al., 1987), and 2.45 GHz (Haynes et al., 1991). There is a known discrepancy between the total flux from the 1.4 GHz single-dish map and the combined ParkesATCA map being used here, as Hughes et al. (2007) report a global 1.4 GHz flux density that is 1.3 times smaller than the single dish estimate from Klein et al. (1989). This difference is largely attributed to an underestimation of the beam width for the single-dish data. Because the single-dish data were reduced and analyzed self-consistently by Haynes et al. (1991), we assume that each map is affected in a similar way.
Using these multifrequency radio data, and assuming a constant non-thermal spectral index of (Haynes et al., 1991), we derive a thermal fraction at 1 GHz that is times larger than the value of 25% found using the 24 m map over our region of interest surrounding 30 Dor shown in Figure 1. This difference is consistent with results from a high-resolution radio continuum survey of M 33 (Tabatabaei et al., 2007), where a standard radio spectral decomposition was found to yield thermal fractions for 11 Hii complexes that were overestimated by an average factor of 1.5 at 8.3 GHz. However, even if we scale the 24 m-derived free-free map by a factor of 1.2 to match the total thermal fraction measured by the radio spectral decomposition in our region of interest, our results are not significantly affected (see §3.2).
2.2.1 CR Electron Energy Estimate
We estimate the typical energies of the CR electrons emitting the observed non-thermal 1.4 GHz emission. For electrons propagating with a pitch angle in a magnetic field of strength with isotropically distributed velocities, such that leading to , then a CR electron emitting at a critical frequency will have an energy
| (1) |
Integrating the free-free corrected 1.4 GHz flux over the region shown in Figure 1 ( Jy; see §2.4), we use the revised minimum energy calculation of Beck & Krause (2005), assuming a proton-to-electron number density ratio of , a non-thermal spectral index of , and a path length of kpc, to calculate a minimum energy magnetic field strength of G. Using this range of values in Equation 1, our 1.4 GHz maps are most sensitive to GeV CR electrons. If the minimum energy condition does not hold, and we instead assume an extreme range in , such as G, the corresponding CR electron energies will range from GeV. However, the (in-)validity of the minimum energy assumption is uncertain and often assumed (as we do in this paper). We briefly discuss the impact of this on the derived properties of the diffusion coefficient in §4.2.1.
2.3. Fermi-LAT Data
The Fermi-LAT instrument, event reconstruction, and response are described in Atwood et al. (2009). In this paper, we use events and instrument response functions (IRFs) for the standard low-background “Clean” events corresponding to the Pass 7 event selections333We use the P7V6_CLEAN event class in this work; see http://fermi.gsfc.nasa.gov/ssc/data/analysis/documentation/Pass7_usage.html. To minimize the contribution from the very bright Earth limb, we restrict the event selection and exposure calculation to zenith angles . We selected all Front-converting events, for which the point-spread function (PSF) is narrowest, within a 20∘ square region of interest (RoI) centered on RA , Dec. (J2000) for months of sky survey data from 2008 August 4 until 2011 March 24. Exposure maps and the PSF for the pointing history of the observations were generated using the standard Fermi-LAT ScienceTools package available from the Fermi Science Support Center444http://fermi.gsfc.nasa.gov/ssc/data/analysis/. The exposure of the instrument over the RoI for the data taking period used in this analysis is very uniform.
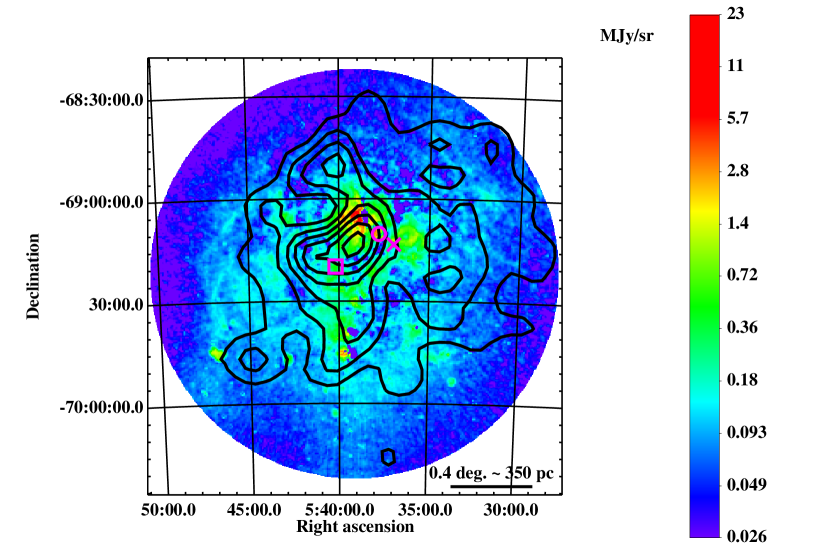
We constructed foreground-subtracted -ray maps over the same region using the standard Fermi-LAT diffuse emission model555http://fermi.gsfc.nasa.gov/ssc/data/access/lat/BackgroundModels.html together with the appropriate isotropic background model and -ray point sources from the Fermi-LAT Second Source Catalog (The Fermi-LAT Collaboration, 2011), forward folding the combination with the exposure and PSF to obtain the total counts expected for these foregrounds. These were subtracted from the data and the residual emission for the GeV energy interval is shown in Figure 1 overlaid on the free-free corrected 1.4 GHz and 24 m maps. The effective 68% containment radius for the Fermi-LAT PSF over this energy bin for the event selection used is ( pc), assuming an spectrum for the -ray emission, which is a sufficient approximation to the spectral shape determined by Abdo et al. (2010b) for the LMC -ray emission over this energy range666Weighting with an spectrum gives a marginally different result, being larger by 3.5%. Note that the effective full width at half-maximum (FWHM) of the Fermi-LAT PSF over this energy bin is ( pc), significantly smaller than the 68% containment radius quoted above.
| Proton Energy | -ray Energy Range | |||
|---|---|---|---|---|
| Index | GeV | GeV | ||
| (GeV) | (GeV) | (GeV) | (GeV) | |
| 2.1 | 1.63 | 22.4 | 5.10 | 69.2 |
| 2.2 | 1.61 | 19.5 | 5.04 | 60.4 |
| 2.3 | 1.60 | 17.2 | 4.99 | 53.6 |
| 2.4 | 1.58 | 15.4 | 4.93 | 48.1 |
| 2.5 | 1.60 | 14.1 | 4.87 | 43.6 |
| 2.6 | 1.55 | 12.5 | 4.82 | 39.8 |
| 2.7 | 1.54 | 11.5 | 4.77 | 36.6 |
| 2.8 | 1.53 | 10.5 | 4.72 | 33.9 |
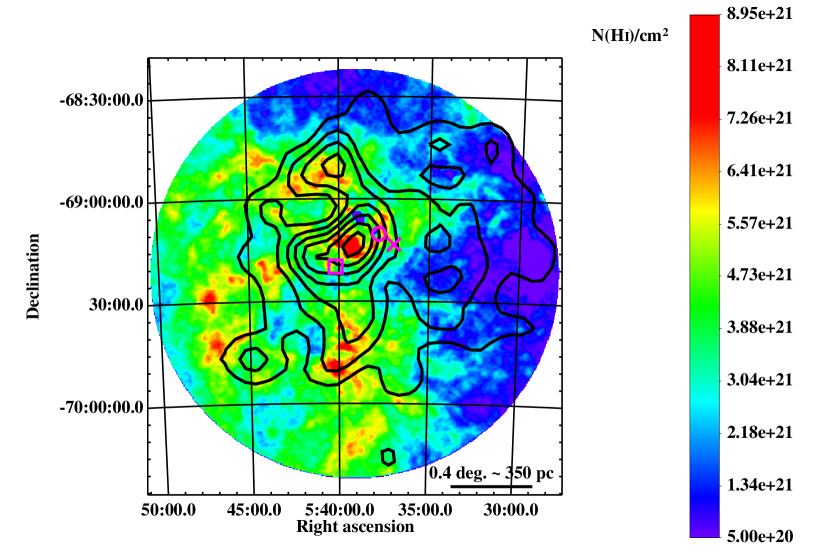
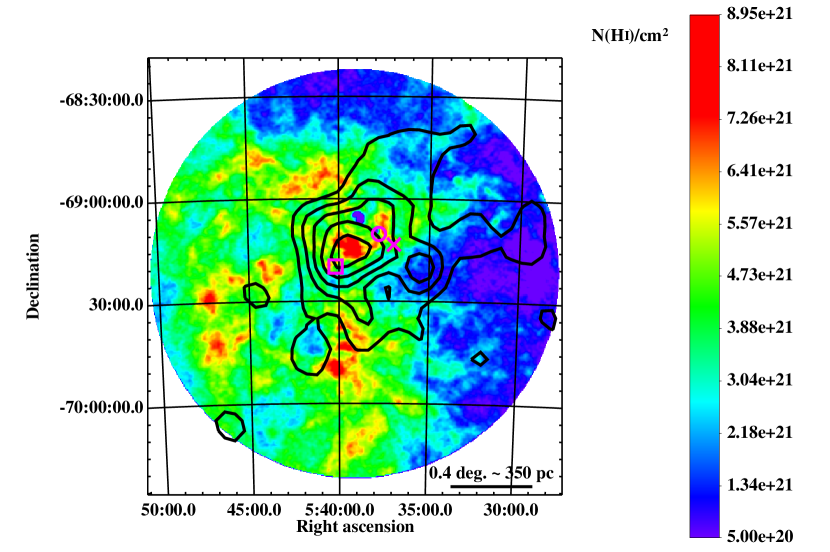
Similarly, we constructed a map for the GeV residual emission. This is shown in Figure 2 where we overlay the and GeV contours on the H i column density data (Staveley-Smith et al., 2003; Kim et al., 2003). The effective 68% containment radius for this map is ( pc), with an effective FWHM of ( pc), again assuming an spectrum for the -ray emission over this energy bin. However, the GeV map has much lower statistics, even near 30 Dor, contrasting with the GeV -ray map, which has times more events. Therefore, we base the majority of our spatial analysis on the GeV map, and only use the higher energy -ray data for testing the energy dependence of the CR propagation (see 4.2.2).
2.3.1 CR Nuclei Energy Estimate
As for electrons and the 1.4 GHz emission, we estimate the typical energies of the CR nuclei emitting rays for the energy ranges that we consider in this paper. For non-AGN dominated star-forming galaxies like the Milky Way and the LMC, the assumption that the CR nuclei are the predominant relativistic particle population producing the -ray emission in the Fermi-LAT energy range is reasonable (Strong et al., 2010).
We define the function
| (2) |
where and are the proton and -ray energies, , is the CR proton flux, is the differential cross section for -ray production calculated as in Moskalenko & Strong (1998), and is the minimum proton energy required to produce a photon of energy . The effective proton energy, , for a given is given by the root of so that contributions to the -ray flux at below and above are equal. The effective proton energy is a function of the proton spectral index , which we show for different for the GeV and GeV energy ranges in Table 1. We also show the effective (average) -ray energy for the GeV and GeV energy ranges, calculated assuming the same spectral index for the rays as for the protons. This assumption is valid for thin-target interactions by the CR nuclei with gas, which applies for the ISM surrounding 30 Dor and the greater LMC.
The effective proton energy changes by a factor of when the power-law index of the proton spectrum changes from 2.1 to 2.8, while the effective energy of rays does not change appreciably. For the -ray energies, this is not surprising because the effective energy is calculated over a relatively narrow energy bin. The effective proton energy change is a combination of the fairly steep rise in the inclusive pion production cross section as the momentum of the interacting proton increases, approximately between 10 and 100 GeV (see, e.g., Figure 2a from Dermer, 1986). When the proton spectrum is steep (e.g., with an index ), this rise is not large enough to compensate for the steeply falling number of high-energy protons. When the proton spectrum is flat (e.g., with an index ) the rise in the inclusive cross section increases the contribution of high-energy protons, making the significantly larger.
2.4. Image Registration and Smearing Analysis
All images were cropped to a common field-of-view and regridded to a common pixel scale. To properly compare each image at the same resolution, maps were convolved with an appropriate PSF. For the radio and infrared (24, 70, and 160 m) data, we convolve all images to the resolution of the 1.4 GHz image, which has a FWHM of 40″, using a Gaussian beam having a FWHM equal to the quadrature difference between the final and original FWHM values of each image.
To match the resolution of the 24 m data to that of the -ray maps, we convolve the 24 m image (at its native resolution) with the in-flight Fermi-LAT PSF, described in Section 2.3. Because the FWHM of the 24 m PSF is % of the effective FWHM over the -ray energy bins used in our analysis, we do not attempt to correct for this additional broadening.
Next, we apply our image smearing analysis (described below) to the resolution-matched images to determine the extension of the non-thermal radio and -ray morphologies relative to the 24 m morphology. The procedure largely follows that described in Murphy et al. (2006b, 2008), where we refer the reader for a more detailed description. Our underlying assumption is that the only difference between these distributions is due to the diffusion and energy losses of the CRs because of the common origin for the CR leptons and nuclei. We focus on the 24 m data in the smearing analysis rather than the 70 m data, as was done by Murphy et al. (e.g., 2008), because it traces warmer dust and has been found to be more peaked near star-forming regions than the 70 m morphology (Helou et al., 2004; Murphy et al., 2006a). For instance, typical 24m knots surrounding 30 Dor tend to be 10 pc in size. Thus, the 24 m maps likely act as a better source function for recently accelerated CRs.
To summarize the procedure, we convolve the entire 24 m image of the LMC by a parameterized kernel and compute the residuals between the free-free corrected 1.4 GHz and smoothed 24 m maps. The smoothing kernel is a function of a two-dimensional position vector r, having a magnitude of , where and are the right ascension and declination offsets on the sky, respectively. We investigate both exponential and Gaussian kernels because a preference of kernel type may suggest different CR transport effects. The exponential and Gaussian kernels have the forms of and , respectively, where is the -folding scale length. Thus, for the Gaussian kernel, .
Exponential kernels, which have broader tails than Gaussian kernels of the same scale length, imply energy loss and/or escape timescales less than, or comparable to, the diffusion timescale. Gaussian kernels, on the other hand, suggest a simple random walk scenario. Because the LMC lacks a well-definied disk, and has a low inclination (; Nikolaev et al., 2004), we assume spherical symmetry for 30 Dor. Hence, there is no need to modify the position vector by geometric factors.
We calculate the normalized-squared residuals between the radio and the infrared images
| (3) |
where is the radio image with free-free emission removed, is the infrared image smoothed by a kernel with scale length , is used as a normalization factor (i.e., the global 24 m/1.4 GHz ratio), and the subscript indexes each pixel. Only pixels detected with a significance of of the RMS noise in each map are used in the calculation of the residuals. The minimum in defines the best-fit scale length, which is taken to be the typical distance traveled by the CR electrons. Similarly, we perform the same procedure using the 24 m and GeV -ray maps to determine the typical distance traveled by the CR nuclei.
For this procedure, generically, if there is no broadening due to propagation effects, the minimum of Equation 3 will be at , because both the radio and -ray data have already reduced to the same angular resolution. Below, we obtain kernel scale lengths indicating that significant smoothing of the 24 m image is required to improve the match with the radio and -ray images. While the scale lengths obtained for the radio/24 m residual analysis are much larger than the angular resolution of these maps, for the -ray/24 m data, the derived scale lengths are comparable to the angular resolution after convolution with the Fermi-LAT PSF. The technique is capable of detecting scale lengths that are a small fraction of the resolution (i.e., pc, which is the scale length step size used in the analysis), and is more sensitive for higher signal-to-noise ratio maps. We emphasize that the kernel scale lengths obtained in this case are in addition to the smoothing of the 24 m data to match the Fermi-LAT PSF. If there was no additional effect from propagation, the derived scale lengths would be zero, whereas we detect a meaningfully non-zero scale length.
The uncertainty in is estimated by numerically propagating the uncertainties in the input images as measured by the 1 RMS noise of each map, with the uncertainty for the best-fit scale length then estimated as the range in scale length corresponding to that from to along the residual curve. We note that this places a lower limit on the uncertainty for the best-fit scale lengths since there is additional uncertainty on the 1.4 GHz thermal fraction estimation and foreground subtraction for the -ray maps. The calculation of the residuals and photometry was carried out within an aperture having a radius of ( pc), encompassing 30 Dor, centered at (J2000, see Figure 1).
We use the 24, 70, and 160 m photometry to calculate the total infrared (IR, m) luminosity over this region by fitting these data to the spectral energy distribution (SED) models of Dale & Helou (2002) and integrating the best-fit SED between 8 and 1000 m. The individual 24, 70, and 160 m flux densities are , , and Jy, respectively. In addition to photometric uncertainties, the above errors include a term for the mean RMS noise values in the convolved 24, 70, and 160 m maps, which are measured to be 0.045, 0.685, and 13.2 MJy sr-1, respectively. We obtain an IR luminosity of (). Taking this value, we estimate the corresponding radiation field energy density
| (4) |
where is the bolometric surface brightness, is the speed of light, and is the area over which the photometry was measured. All quantities in Equation 4 are in cgs units. This calculation is for radiation emitted near the surface of a semitransparent body, and the parenthetical term provides an empirically derived correction for non-absorbed UV emission (Bell, 2003), resulting in a value of () averaged over the volume considered.

3. Results
We present our results from comparing the morphologies of 30 Dor as measured by warm dust emission at 24 m, synchrotron emission at 1.4 GHz, and -ray emission at GeV. We compare the morphologies both qualitatively, through a visual inspection, as well as quantitatively using the image smearing analysis described above.
3.1. 24 m, 1.4 GHz, and GeV -ray Morphologies
Figure 1 shows the residual GeV -ray emission overplotted as contours on the free-free corrected 1.4 GHz radio and 24 m warm dust emission in the left and right panels, respectively. While there is a general correspondence between the -ray, radio, and infrared emission, the peak of the -ray emission is clearly offset from the peak of the radio and infrared emission, which appear to be nearly co-spatial. This lack of correspondence between the peak of the -ray emission with the radio and infrared emission leads one to question whether the observed -ray emission is indeed associated with 30 Dor.
In Abdo et al. (2010b), it was noted that -ray emission near 30 Dor may have a non-negligible contribution from two Crab-like pulsars, PSR J05406919 (; J2000) and PSR J05376910 (; J2000). In addition, there is a background X-ray source (RX J0536.96913: ; J2000) that is also coincident with the line-of-sight toward 30 Dor, which could also contribute to the observed emission. The locations of these point sources are shown in Figure 1 and Figure 2, and are near, but not at, the peak of the and GeV -ray emission. It is also interesting to see that the and -ray contours appear to peak close to a region of high Hi column density in Figure 2. It is possible to subtract fitted -ray point sources at the the locations of the pulsars and AGN, resulting in a situation where 30 Dor does not exhibit -ray emission in excess of the subtracted foreground model. The implications of such a scenario are described in 4.1. However, we note that there is no detection of pulsed -ray emission so far reported from either of the pulsars. Also, no variability is detected from the region during our period of analysis. If RX J0536.96913 is a -ray emitting AGN, the lack of variability makes it difficult to determine if this candidate source contributes significantly in our RoI.
3.2. Results from the Smearing Analysis
In Figure 3 we plot the residuals (, see §2.4) between the free-free corrected 1.4 GHz and smoothed 24 m maps as a function of exponential and Gaussian kernel scale lengths. The residuals between the free-free corrected 1.4 GHz and 24 m maps are decreased by more than a factor of 2 after smoothing the 24 m map using either exponential or Gaussian kernels. A slightly larger improvement is found by using an exponential kernel, suggesting energy losses and/or escape may be important for the CR electrons. The corresponding best-fit exponential and Gaussian kernel scale lengths are 100 and 200 pc, respectively. We note that the estimated 3 GeV CR electron propagation length reported here assuming random walk diffusion (i.e., using a Gaussian kernel) is consistent within errors to the GeV CR proton confinement length reported by Abdo et al. (2010b), whose estimate assumed Gaussian profiles (see Figure 3). Abdo et al. (2010b) report the Gaussian to be pc, so we multiply this number by for proper comparison with the scale length definition for our Gaussian kernel.
As discussed in §2.2, we test how our results are affected by assuming that the thermal fraction of the 1.4 GHz radio map is being underestimated by the 24 m maps relative to what is derived using single-dish radio data at 1.4, 2.3, and 2.45 GHz. By scaling the 24 m-derived free-free maps by a factor of 1.2 to match the total thermal fraction measured by the radio spectral decomposition, and repeating the smearing analysis, we find that the best-fit exponential scale length is still 100 pc, while the best-fit Gaussian scale length is slightly increased to 250 pc. A larger improvement is again found using an exponential kernel relative to a Gaussian kernel. The results therefore do not appear to be significantly affected by increasing the thermal fraction estimate to match that from the radio spectral decomposition method.
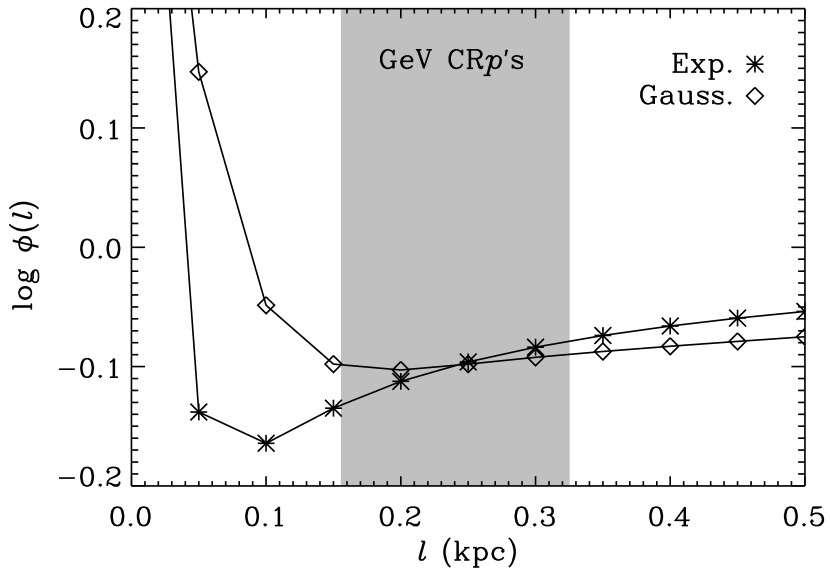
Similarly, in Figure 4, we plot the residuals between the GeV -ray and smoothed 24 m maps as a function of exponential and Gaussian kernel scale lengths. The residuals between the GeV and 24 m maps are decreased by a factor of 2 after smoothing the 24 m map using either exponential or Gaussian kernels. While a slightly larger improvement is found by using exponential kernels in the comparison between the 1.4 GHz and 24 m maps, we do not find a preference in kernel type for the GeV -ray map. The corresponding best-fit exponential and Gaussian kernel scale lengths are 200 and 450 pc, respectively. These best-fit scale lengths are significantly larger (i.e., a factor of 2) than what was measured for the 1.4 GHz maps. Because the 1.4 GHz and GeV -ray maps probe different energy CR particle populations, the corresponding differences in their best-fit scale lengths may arise from different diffusion speeds. This scenario is discussed in 4.2.
4. Discussion
Using a phenomenological image smearing model, we have estimated the typical propagation lengths of GeV CR electrons and GeV CR nuclei by comparing the spatial distributions of smoothed 24 m maps images with (free-free corrected) 1.4 GHz and (foreground subtracted) GeV -ray maps, respectively. From the analysis, there is a difference between the typical distances travelled by GeV CR electrons and GeV protons (assuming a proton energy index of ), where the 20 GeV CR protons are found to travel 2 times further, on average, independent of kernel type. However, it is additionally worth including a brief discussion of the physical implications for the case where 30 Dor may not be emitting in rays.
4.1. The Case for a Dark 30 Dor in rays
As stated in 3.1, there are both pulsars and a background X-ray emitting source that may contribute to the observed -ray emission towards 30 Dor. For this case, the situation has 30 Dor emitting at 1.4 GHz, therefore containing diffusing CR electrons, but no observational signature for the CR nuclei. Explaining this would require the CR nuclei to escape the system without interacting with the interstellar gas.
Taking the above estimate for the bolometric luminosity from 30 Dor (i.e., the IR luminosity given in §2.4 corrected by the parenthetical term in Equation 4 for non-absorbed UV emission) together with the updated star formation rate (SFR) calibrations given in Murphy et al. (2011), we estimate a corresponding SFR of 0.15 . This value is consistent with others in the literature (e.g., Hughes et al., 2007; Harris & Zaritsky, 2009; Lawton et al., 2010). Assuming this value and the sensitivity of the Fermi-LAT data used in our analysis, the absence of -ray emission from 30 Dor clearly disagrees with the empirical correlations between SFR or the product of supernova rate and the gas mass with -ray luminosity found for the local group and nearby starbursts (e.g., Abdo et al., 2010a; Lenain & Walter, 2011). Furthermore, theoretical expectations of such scaling relations and their implications for the contribution by normal star-forming galaxies to the diffuse -ray extragalactic background (e.g., Pavlidou & Fields, 2001; Fields et al., 2010) would then be questionable. However, because there is currently no strong evidence linking the -ray emission from 30 Dor to the known point sources in the field, we discuss the physical interpretation of our analysis with the assumption that it arises from 30 Dor.
4.2. Cosmic Ray Propagation from 30 Dor
To interpret our findings on the kernel scale lengths, we must consider the dependence of gas density on the synchrotron and -ray emission. The diffuse rays in the energy range that we have used ( GeV) are predominantly from CR nuclei interacting with the interstellar gas, and therefore where and are the densities of the CR nuclei and gas, respectively. The diffuse synchrotron emission is proportional to the CR electron density, , and the square of the magnetic field strength, , i.e., . Assuming flux-freezing scaling of (e.g. Ruzmaikin et al., 1988; Niklas & Beck, 1997; Crutcher, 1999), the synchrotron emission becomes proportional to the product of the electron density and the density of the interstellar gas, . This simple scaling argument therefore suggests that the differences in appearance of the -ray and radio images are due to differences in the distributions of the CR nuclei and electrons. This was tested by normalizing the -ray and free-free corrected radio images by the H i column density map before applying the smearing analysis, recovering results consistent with those described in §3.2.
4.2.1 Cosmic Ray Transport Properties
We assume that the transport of the CRs can be described by a simple random-walk process with an rigidity-dependent spatial diffusion coefficient (e.g., Ginzburg et al., 1980). The diffusion coefficient is defined as
| (5) |
where is the normalization constant and is the characteristic distance that CRs travel after a time . For our Gaussian kernels, we can relate to the corresponding best-fit scale lengths such that .
If we assume that the CR electrons and nuclei are injected by the same source(s) and have been propagating through the ISM for the same length of time, we find that the GeV CR nuclei diffusion coefficient is times larger than that for the GeV CR electrons. Solving Equation 5 for , we find that the diffusion coefficient scales as from the exponential best-fit scale lengths and as using the Gaussian best-fit scale lengths. Errors on were estimated by a standard Monte Carlo approach using the uncertainties in the best-fit scale lengths777 was calculated by taking 1000 random samples, picking best-fit scale lengths from a normal distribution having a dispersion set by their lower and upper-bound uncertainties. The standard deviation of this set is taken as the uncertainty on .. If the minimum energy assumption does not hold, and we instead consider the extreme range of G described earlier in §2.2.1, we find corresponding values of .
These model-independent values of are consistent with the value of used in empirical diffusion models to fit the observed secondary-to-primary ratios, typically boron-to-carbon (B/C), for the Milky Way. In addition, our derived values for generally exceed those for physically motivated turbulence theories, being larger than the nominal value of for Kolomogorov (Kolmogorov, 1941), and marginally consistent with the value of for Iroshnikov-Kraichnan (Iroshnikov, 1964; Kraichnan, 1965) turbulence spectra. However, the values for the Milky Way are found for a large volume in a spiral galaxy, while the results of our analysis are for a single, highly active star-forming region: 30 Dor exhibits a complex network of kinematic features including slow () and fast () expanding shells powered by stellar winds from young massive stars and supernovae (Chu & Kennicutt, 1994).
Because of strong radiative energy losses as they propagate, the corresponding diffusion lengths for the GeV CR electrons may be underestimated by our best-fit scale lengths, which would result in an overestimate for . This is suggested by the fact that an exponential kernel resulted in a lower minimum residual between the 1.4 GHz and 24 m maps than a Gaussian kernel. However, as discussed below, the additional cooling of electrons may not significantly affect our estimate for .
Taking the average derived value for (i.e., 0.75), together with the age of the current star formation activity responsible for supernova remnants accelerating the CRs, we can estimate the diffusion coefficient normalization factor . The 30 Dor complex is known to contain many non-coeval stellar populations ranging in age from Myr from HST spectroscopy (Walborn & Blades, 1997). Recently, using a Bayesian analysis, Martínez-Galarza et al. (2011) fit Spitzer-IRS data for 30 Dor using mid-infrared SED models (continuum + lines), arriving at a luminosity-weighted age for the system of Myr. This suggests that CRs associated with this star-forming event have been accelerated in the supernova remnants of very massive O-stars, and that the bulk of CRs have yet to be accelerated by the supernova remnants from the more numerous and less massive (i.e., ) stars with lifetimes of Myr. Note that this age is less than the estimated cooling lifetime Myr for the 1.4 GHz emitting CR electrons as they propagate through the ISM of 30 Dor888This maximum lifetime is estimated using the combined energy losses due to synchrotron, inverse Compton, bremsstrahlung, and ionization processes (see, e.g., Murphy, 2009). Using the previously estimated values for the minimum energy magnetic field strength (G; see 2.2), the radiation field energy density (; see 2.4), and assuming an average ISM density of cm-3 (Kim et al., 2003), we estimate a cooling time for the observed 1.4 GHz emitting ( GeV) electrons of Myr. We note that the individual lifetimes estimated against synchrotron, inverse Compton, bremsstrahlung, and ionization losses are 33, 55, 43, and 140 Myr, respectively.
Using this mean age of 3 Myr in Equation 5, together with the best-fit Gaussian scale lengths corresponding to pc and 320 pc for the 3 GeV and 20 GeV electrons and nuclei, respectively, we find a diffusion coefficient normalization constant of . This is more than an order of magnitude lower than those found in the Milky Way (e.g., cm2 s-1, Trotta et al., 2011). However, analytical solutions for the perpendicular diffusion coefficient (i.e., diffusion across magnetic field lines) are found to be much smaller. For example, Shalchi et al. (2010) report a perpendicular diffusion coefficient of . Because 30 Dor is an active star-forming region, which likely has a strong turbulent magnetic field and lacks a large-scale regular field like the Galaxy, it may not be surprising that our derived value for the diffusion coefficient normalization factor is intermediate in the range for the perpendicular diffusion coefficients obtained by other authors.
4.2.2 Results Including GeV Maps
So far we have only discussed the results comparing the propagation for GeV CR electrons and GeV CR nuclei. While it seems that the cooling time for the 1.4 GHz (3 GeV) CR electrons is a factor of times larger than the average age of the stellar population in 30 Dor, trying to interpret the differences in their propagation lengths is complicated by the fact that the GeV CR electrons lose energy more rapidly than the GeV CR nuclei. That the electron energy losses are important is suggested by the result that the residuals between the 1.4 GHz and 24 m maps are decreased more when using exponential kernels rather than Gaussian kernels. We therefore include the GeV -ray map to provide an additional estimate for the propagation length of CR nuclei because it is sensitive to much higher energy CR nuclei (i.e., GeV for a proton energy index of ). Employing these data, we can try to determine whether the difference between the CR electrons and protons is in fact the result of rigidity-dependent diffusion.
Applying the same smearing analysis to the 1.4 GHz radio, GeV, and GeV -ray maps, but limiting the area of the residual calculation to that where there are GeV -ray events (i.e., the area having GeV -ray events), we obtain the following results. The best-fit exponential and Gaussian scale lengths are 50 and 150 pc, respectively, for GeV electrons, 150 and 300 pc, respectively, for GeV CR protons, and 200 and 400 pc, respectively, for GeV protons. Because the detected GeV events are concentrated around the center of 30 Dor, lacking a significant extended component as observed in the -ray map, it is not surprising that the scale lengths obtained are generally smaller than those calculated from the residuals over a larger area.
Using all six possible combinations of these values to solve for results in a median and dispersion of . This is consistent with the energy dependence estimated above using the 1.4 GHz radio and GeV -ray maps. We note that the value of estimated by comparing only the -ray maps, which is independent of assumptions for the magnetic field strength and proton energy index, is , whereas the median when only including the 1.4 GHz maps is , suggesting that the best-fit scale lengths for the CR electrons may be underestimated due to additional energy losses. This is consistent with exponential kernels working slightly better to tighten the correlation between the 1.4 GHz and 24 m maps compared to Gaussian kernels. Additionally, the estimate for the value of using only the -ray maps is independent of assumptions for the magnetic field strength However, we emphasize that the GeV -ray map is statistically limited, having times fewer events than the GeV maps.


4.2.3 Propagation Length vs. Star Formation Activity
Having estimated the average distance traveled by CR electrons for an individual star-forming region, 30 Dor, it is interesting to see how these results compare with similar estimates of CR electron propagation distances for entire galaxies. Murphy et al. (2006b, 2008) reported a correlation between the CR electron propagation distance and galaxy surface brightness such that CR electrons are found to travel shorter distances, on average, in galaxies having higher star formation activity.
In Figure 5 we plot the results from Murphy et al. (2008, i.e., the best-fit exponential scale lengths projected in the plane of the sky versus ) along with our estimates for 30 Dor. We note that various systematics and selection effects (e.g., distance, inclination) were rigorously investigated by Murphy et al. (2008). They additionally tested the differences between isotropic kernels and kernels projected in the plane of each galaxy disk, finding a preference, i.e., smaller residuals, for isotropic kernels.
The estimate for 30 Dor was calculated from the surface brightness measured over an area of 2.4 , the same region for which the residuals were estimated (see §2.4). For this case, the best-fit scale length was measured by comparing the free-free corrected 1.4 GHz with smoothed 70 m maps to allow a proper comparison with the results of Murphy et al. (2008). The best-fit exponential and Gaussian kernel scale lengths were 0 and 50 pc, respectively. Because Murphy et al. (2008) plot exponential kernel scale lengths, we plot the result from smoothing the 70 m map of 30 Dor with a Gaussian kernel as an upper limit.
Included in Figure 5 are both spirals and star-forming irregulars. The latter have markedly small best-fit scale lengths for their values of relative to the sample of spirals. This is thought to be caused by increased escape of CR electrons in these systems (e.g., Cannon et al., 2005, 2006; Murphy et al., 2008). To see how the behavior of entire galaxies compares with the LMC as a whole, we repeat the image smearing analysis using the 70 m maps after first projecting the LMC to the mean distance of the Murphy et al. (2008) sample irregulars, Mpc to take possible resolution effects into account. We calculate the residuals and within an aperture having a radius of kpc (275 at the distance of 3.9 Mpc) centered at (J2000). This is approximately the area over which the 24 m emission was detected at level. The best-fit exponential and Gaussian scale lengths are 200 and 400 pc, respectively. This places the LMC close to the main trend among the star-forming spirals.
Focusing only on the region containing the star-forming spirals, we re-plot the disk galaxies along with 30 Dor and the LMC in Figure 6. The dotted-line is a least-squares fit to the Murphy et al. (2008) galaxy disks, excluding the LMC and 30 Dor. Clearly, the position of 30 Dor in the plot is consistent with the empirical trend describing spiral galaxies, but extrapolated to a surface brightness greater by almost an order of magnitude. Thus, this scaling relation appears to operate on the scales of entire galaxies all the way down to individual star-forming regions.
5. Conclusions
Using a phenomenological image smearing model, we have estimated the typical propagation length of GeV CR electrons and GeV CR nuclei by comparing the spatial distributions of smoothed 24 m and (free-free corrected) 1.4 GHz and GeV -ray maps, respectively. Below we list the major results and conclusions:
-
1.
We estimate the typical distances traveled by 3 GeV CR electrons from 30 Dor to be pc. This is factor of 2 smaller than that estimated for 20 GeV CR nuclei, which is found to be pc.
-
2.
In our image-smearing analysis, we find that exponential kernels work slightly better to tighten the correlation between the 1.4 GHz and 24 m maps compared to Gaussian kernels. In contrast, both exponential and Gaussian kernels are found to work equally well to tighten to correlation between the GeV -ray and 24 m maps. This difference suggests that, unlike the CR nuclei, CR leptons suffer additional energy losses as they propagate through the ISM near 30 Dor on timescales less than, or comparable to, the diffusion timescale.
-
3.
Assuming that the CR electrons and nuclei are produced by the same sources, and that their propagation is well described by a random walk, the differences in their estimated propagation lengths suggest differences in their associated spatial diffusion coefficients. This allows us to make the first model-independent measurement of the energy dependence of the diffusion coefficient for an external galaxy. For CRs produced in this star-forming region, the 20 GeV CR proton diffusion coefficient is 4 times larger than that for 3 GeV CR electrons, scaling as where . This value is consistent with that obtained by including the more statistically limited GeV -ray map ( GeV CR protons; ).
-
4.
The value of reported here is larger than the spectral index of the diffusion coefficient assuming Kolomogorov turbulence and Milky Way secondary-to-primary ratios, and marginally consistent with Iroshnikov-Kraichnan turbulence. This may reflect the fact that 30 Dor region exhibits complex kinematic features, and fast expanding shells, resulting in a larger value of .
-
5.
Assuming that the CRs in 30 Dor are as old as the average stellar population (3 Myr), we estimate a diffusion coefficient normalization constant of . This value is less than and similar to model-dependent estimates of the parallel and perpendicular diffusion coefficient for the Galaxy, respectively. The similarity between our estimate and perpendicular diffusion coefficient values may be due the 30 Dor region having a magnetic field configuration that is highly turbulent.
-
6.
We place our results for 30 Dor, and the LMC as a whole, in the context of the scaling relation between the typical CR electron propagation length and disk-averaged star formation activity for entire disk galaxies, where CR electron propagation is found to decrease with increasing star formation activity. This relation appears to apply to the LMC and the individual star-forming region of 30 Dor.
References
- Abdo et al. (2010a) Abdo, A. A., Ackermann, M., Ajello, M., et al. 2010a, A&A, 523, L2+
- Abdo et al. (2010b) Abdo, A. A., Ackermann, M., —. 2010b, A&A, 512, A7+
- Atwood et al. (2009) Atwood, W. B., Abdo, A. A., Ackermann, M., et al. 2009, ApJ, 697, 1071
- Beck & Krause (2005) Beck, R., & Krause, M. 2005, Astronomische Nachrichten, 326, 414
- Bell (2003) Bell, E. F. 2003, ApJ, 586, 794
- Bicay & Helou (1990) Bicay, M. D., & Helou, G. 1990, ApJ, 362, 59
- Boulares & Cox (1990) Boulares, A., & Cox, D. P. 1990, ApJ, 365, 544
- Calzetti et al. (2005) Calzetti, D., Kennicutt, Jr., R. C., Bianchi, L., et al. 2005, ApJ, 633, 871
- Calzetti et al. (2007) Calzetti, D., Kennicutt, R. C., Engelbracht, C. W., et al. 2007, ApJ, 666, 870
- Cannon et al. (2005) Cannon, J. M., Walter, F., Bendo, G. J., et al. 2005, ApJ, 630, L37
- Cannon et al. (2006) Cannon, J. M., Smith, J.-D. T., Walter, F., et al. 2006, ApJ, 647, 293
- Chu & Kennicutt (1994) Chu, Y.-H., & Kennicutt, Jr., R. C. 1994, ApJ, 425, 720
- Cox (2005) Cox, D. P. 2005, ARA&A, 43, 337
- Crutcher (1999) Crutcher, R. M. 1999, ApJ, 520, 706
- Dale & Helou (2002) Dale, D. A., & Helou, G. 2002, ApJ, 576, 159
- de Jong et al. (1985) de Jong, T., Klein, U., Wielebinski, R., & Wunderlich, E. 1985, A&A, 147, L6
- Dermer (1986) Dermer, C. D. 1986, A&A, 157, 223
- Ferrière (2001) Ferrière, K. M. 2001, Reviews of Modern Physics, 73, 1031
- Fields et al. (2010) Fields, B. D., Pavlidou, V., & Prodanović, T. 2010, ApJ, 722, L199
- Ginzburg et al. (1980) Ginzburg, V. L., Khazan, I. M., & Ptuskin, V. S. 1980, Ap&SS, 68, 295
- Harris & Zaritsky (2009) Harris, J., & Zaritsky, D. 2009, AJ, 138, 1243
- Haynes et al. (1991) Haynes, R. F., Klein, U., Wayte, S. R., et al. 1991, A&A, 252, 475
- Helou et al. (1985) Helou, G., Soifer, B. T., & Rowan-Robinson, M. 1985, ApJ, 298, L7
- Helou et al. (2004) Helou, G., Roussel, H., Appleton, P., et al. 2004, ApJS, 154, 253
- Hughes et al. (2007) Hughes, A., Staveley-Smith, L., Kim, S., Wolleben, M., & Filipović, M. 2007, MNRAS, 382, 543
- Hughes et al. (2006) Hughes, A., Wong, T., Ekers, R., et al. 2006, MNRAS, 370, 363
- Iroshnikov (1964) Iroshnikov, P. S. 1964, Soviet Ast., 7, 566
- Kim et al. (2003) Kim, S., Staveley-Smith, L., Dopita, M. A., et al. 2003, ApJS, 148, 473
- Klein et al. (1989) Klein, U., Wielebinski, R., Haynes, R. F., & Malin, D. F. 1989, A&A, 211, 280
- Kolmogorov (1941) Kolmogorov, A. 1941, Akademiia Nauk SSSR Doklady, 30, 301
- Kraichnan (1965) Kraichnan, R. H. 1965, Physics of Fluids, 8, 1385
- Lawton et al. (2010) Lawton, B., Gordon, K. D., Babler, B., et al. 2010, ApJ, 716, 453
- Lenain & Walter (2011) Lenain, J.-P., & Walter, R. 2011, ArXiv e-prints
- Marsh & Helou (1998) Marsh, K. A., & Helou, G. 1998, ApJ, 493, 121
- Martínez-Galarza et al. (2011) Martínez-Galarza, J. R., Groves, B., Brandl, B., et al. 2011, ApJ, 738, 176
- Marx et al. (1997) Marx, M., Dickey, J. M., & Mebold, U. 1997, A&AS, 126, 325
- Meixner et al. (2006) Meixner, M., Gordon, K. D., Indebetouw, R., et al. 2006, AJ, 132, 2268
- Moskalenko & Strong (1998) Moskalenko, I. V., & Strong, A. W. 1998, ApJ, 493, 694
- Mountfort et al. (1987) Mountfort, P. I., Jonas, J. L., de Jager, G., & Baart, E. E. 1987, MNRAS, 226, 917
- Murphy (2009) Murphy, E. J. 2009, ApJ, 706, 482
- Murphy et al. (2008) Murphy, E. J., Helou, G., Kenney, J. D. P., Armus, L., & Braun, R. 2008, ApJ, 678, 828
- Murphy et al. (2006a) Murphy, E. J., Braun, R., Helou, G., et al. 2006a, ApJ, 638, 157
- Murphy et al. (2006b) Murphy, E. J., Helou, G., Braun, R., et al. 2006b, ApJ, 651, L111
- Murphy et al. (2011) Murphy, E. J., Condon, J. J., Schinnerer, E., et al. 2011, ApJ, 737, 67
- Niklas & Beck (1997) Niklas, S., & Beck, R. 1997, A&A, 320, 54
- Nikolaev et al. (2004) Nikolaev, S., Drake, A. J., Keller, S. C., et al. 2004, ApJ, 601, 260
- Papadopoulos (2010) Papadopoulos, P. P. 2010, ApJ, 720, 226
- Papadopoulos et al. (2011) Papadopoulos, P. P., Thi, W.-F., Miniati, F., & Viti, S. 2011, MNRAS, 414, 1705
- Pavlidou & Fields (2001) Pavlidou, V., & Fields, B. D. 2001, ApJ, 558, 63
- Pérez-González et al. (2006) Pérez-González, P. G., Kennicutt, Jr., R. C., Gordon, K. D., et al. 2006, ApJ, 648, 987
- Pollack & Fazio (1963) Pollack, J. B., & Fazio, G. G. 1963, Physical Review, 131, 2684
- Porter et al. (2008) Porter, T. A., Moskalenko, I. V., Strong, A. W., Orlando, E., & Bouchet, L. 2008, ApJ, 682, 400
- Ruzmaikin et al. (1988) Ruzmaikin, A., Sokolov, D., & Shukurov, A. 1988, Nature, 336, 341
- Shalchi et al. (2010) Shalchi, A., Büsching, I., Lazarian, A., & Schlickeiser, R. 2010, ApJ, 725, 2117
- Socrates et al. (2008) Socrates, A., Davis, S. W., & Ramirez-Ruiz, E. 2008, ApJ, 687, 202
- Staveley-Smith et al. (2003) Staveley-Smith, L., Kim, S., Calabretta, M. R., Haynes, R. F., & Kesteven, M. J. 2003, MNRAS, 339, 87
- Strong et al. (2007) Strong, A. W., Moskalenko, I. V., & Ptuskin, V. S. 2007, Annual Review of Nuclear and Particle Science, 57, 285
- Strong et al. (2010) Strong, A. W., Porter, T. A., Digel, S. W., et al. 2010, ApJ, 722, L58
- Tabatabaei et al. (2007) Tabatabaei, F. S., Beck, R., Krügel, E., et al. 2007, A&A, 475, 133
- The Fermi-LAT Collaboration (2011) The Fermi-LAT Collaboration. 2011, ArXiv e-prints
- Trotta et al. (2011) Trotta, R., Jóhannesson, G., Moskalenko, I. V., et al. 2011, ApJ, 729, 106
- Walborn & Blades (1997) Walborn, N. R., & Blades, J. C. 1997, ApJS, 112, 457