Star formation history and environment of the dwarf galaxy UGCA 92††thanks: Based on observations made with the NASA/ESA Hubble Space Telescope, obtained from the data archive at the Space Telescope Science Institute. STScI is operated by the Association of Universities for Research in Astronomy, Inc. under NASA contract NAS 5-26555.
Abstract
We present a quantitative star formation history of the nearby dwarf galaxy UGCA 92. This irregular dwarf is situated in the vicinity of the Local Group of galaxies in a zone of strong Galactic extinction (IC 342 group of galaxies). The galaxy was resolved into stars with HST/ACS including old red giant branch. We have constructed a model of the resolved stellar populations and measured the star formation rate and metallicity as function of time. The main star formation activity period occurred about 8 – 14 Gyr ago. These stars are mostly metal-poor, with a mean metallicity [Fe/H] – dex. About 84 per cent of the total stellar mass was formed during this event. There are also indications of recent star formation starting about 1.5 Gyr ago and continuing to the present. The star formation in this event shows moderate enhancement from 200 Myr to 300 Myr ago. It is very likely that the ongoing star formation period has higher metallicity of about – dex. UGCA 92 is often considered to be the companion to the starburst galaxy NGC 1569. Comparing our star formation history of UGCA 92 with that of NGC 1569 reveals no causal or temporal connection between recent star formation events in these two galaxies. We suggest that the starburst phenomenon in NGC 1569 is not related to the galaxy’s closest dwarf neighbours and does not affect their star formation history.
keywords:
galaxies: dwarf – galaxies: formation – galaxies: evolution – galaxies: stellar content – galaxies: individual: UGCA 921 Introduction
Dwarf galaxies are most numerous objects in the Universe. The question of star formation in dwarf galaxies is extremely important for understanding of their origin and evolution. The local Universe (10 Mpc) is particularly important and convenient for studying dwarf galaxies. Nearby galaxies are resolved into individual stars, which allow us to study stellar population of these galaxies directly. In the last decades, significant progress has been achieved in the study of resolved stellar populations due to the Hubble Space Telescope (HST) and new large ground-based telescopes.
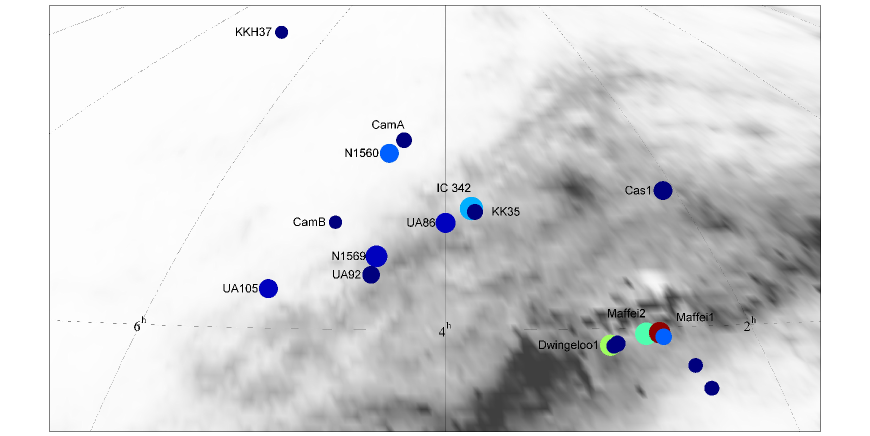
About 50 per cent of nearby galaxies are situated in groups and clouds (Makarov & Karachentsev, 2011). Taking into account loose associations of dwarf galaxies (Tully et al., 2006), most of the galaxies within 3 Mpc are not isolated objects. The nearby group around IC 342 is obscured by strong Galactic extinction (see Fig. 1). The IC 342-Maffei complex should have significant impact on dynamic and evolution of the nearby Universe. Unfortunately, the ‘Zone of Avoidance’ hides this region from us and a determination of main properties of galaxies behind it is a challenge.
In the framework of the study of the structure of the nearby Universe (HST project 9771) we have obtained the images of dwarf galaxies within IC 342/Maffei complex. In the present work we have considered the star formation history of the dwarf irregular galaxy UGCA 92, which has for a long time been considered to be the closest neighbour of the nearest starburst galaxy NGC 1569 (Karachentsev et al., 1994b; Makarova & Karachentsev, 2003).
The small irregular galaxy UGCA 92 was discovered by Nilson (1974) and independently catalogued as a possible planetary nebula by Ellis et al. (1984). CCD observations of Hoessel et al. (1988) partially resolving it into individual stars in the g and r passband images first showed that UGCA 92 (EGB 0427+63) is a dwarf irregular galaxy. Hodge & Miller (1995) detected 25 H ii regions within UGCA 92, concentrated in two well-separated regions of the galaxy. The reddening, measured from the emission-line spectra for bright H ii regions is and the mean oxygen abundance is about 13 per cent solar, with an uncertainty of 50 per cent. Karachentsev & Kaisin (2010) carried out H flux measurement for UGCA 92 and derived a current star formation rate of M⊙/yr.
The general parameters of UGCA 92 are presented in Table 1. The total magnitudes, colours and central surface brightnesses, , are not corrected for Galactic extinction.
| R.A.(J2000) | ||
| Dec (J2000) | ||
| size, arcmin | ||
| Linear diameter, kpc | ||
| , mag | ||
| Distance, Mpc | ||
| , mag | ||
| , mag | ||
| , mag | ||
| , mag | ||
| , mag | ||
| , mag | ||
| , mag arcsec-2 | ||
| , mag arcsec-2 | ||
| , mag arcsec-2 | ||
| , mag | ||
| , mag | ||
| , km s-1 | ||
| , mag | ||
| , M⊙ | ||
| Fraction of old stars (12–14 Gyr), % | ||
| Metallicity of old stars, [Fe/H], dex | – | |
| Fraction of young stars (500 Myr), % | ||
| , 12 – 14 Gyr ago, M⊙ yr-1 | ||
| , last 500 Myr, M⊙ yr-1 | ||
| this work; LEDA; Karachentsev et al. (2004); Karachentseva et al. (1996); Sharina et al. (2008); Vaduvescu et al. (2005); Schlegel et al. (1998); Begum et al. (2008) | ||
2 The Dataset
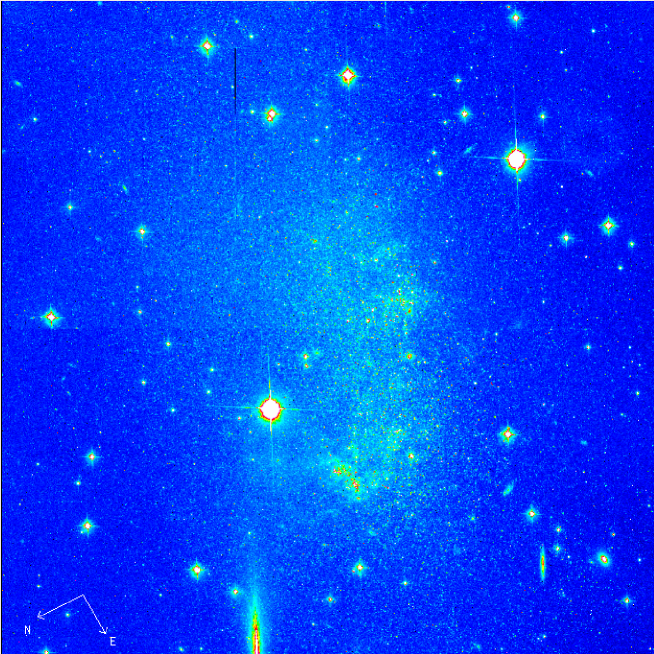
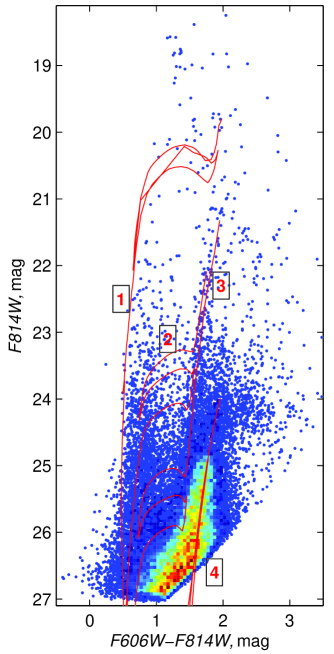

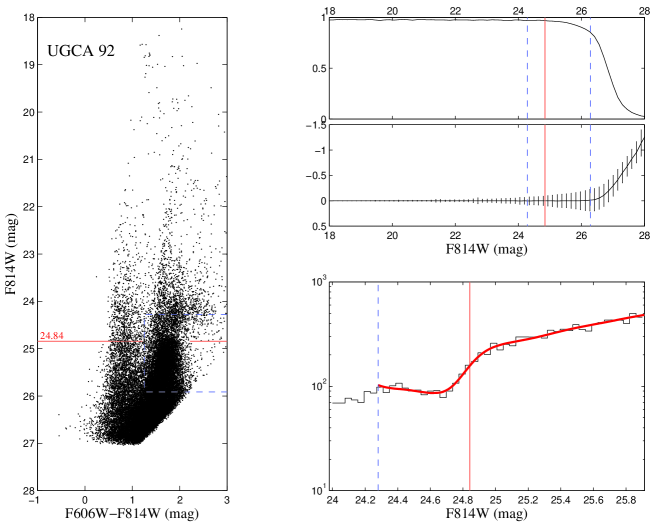
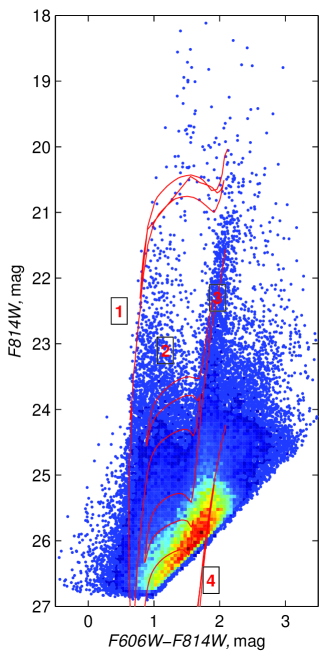
The dwarf irregular galaxy UGCA 92 was observed aboard HST using Advanced Camera for Surveys (ACS) at March 28, 2004 (SNAP 9771, PI I. Karachentsev). Two exposures were made with the filters F606W (1200 s) and F814W (900 s). An ACS image of the dwarf galaxy is shown in Fig. 2. The photometry of resolved stars in the galaxy was performed with the ACS module of the dolphot package111http://purcell.as.arizona.edu/dolphot/ for crowded field photometry (Dolphin, 2002) using the recommended recipe and parameters. Only stars with photometry of good quality were included in the final list, following recommendations given in the dolphot User’s Guide. We have selected stars with signal-to-noise (S/N) in both filters, and . The resulting colour-magnitude diagram contains 32699 stars (Fig. 3).
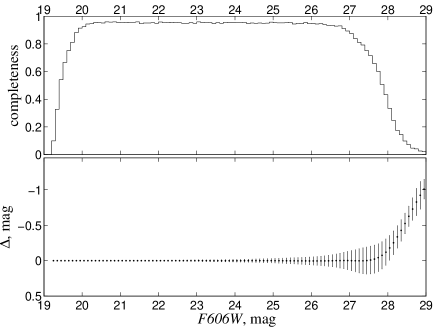
Artificial star tests were performed using the same reduction procedures to estimate photometric errors, crowdedness and blending effects in the most accurate way. A large library of artificial stars was generated spanning the necessary range of stellar magnitudes and colours so that the distribution of the recovered photometry is adequately sampled. The photometric errors and completeness are presented in Fig. 4. The 1 photometric precision is 0.07 at and 0.19 at mag. Malmquist bias becomes notable for stars with mag. In F606W the 1 photometric precision is 0.06 at 26 and 0.18 at 28 mag.
3 Colour-magnitude diagram
All resolved stars are significantly shifted to redder colours due to high extinction in the Zone of Avoidance of the Milky Way. The diagram is typical for dwarf irregular galaxies. A pronounced upper main sequence (MS) and probable helium-burning blue loop stars are found at mag. The red supergiant branch (RSG) and the intermediate age asymptotic giant branch (AGB) are also well populated. The most abundant feature in the CMD is the red giant branch (RGB) (see Fig. 3).
3.1 Extinction
The dwarf galaxy UGCA 92 is situated at the Galactic latitude . Galactic extinction in the field of UGCA 92 needs to be addressed in more detail because reddening estimation at low Galactic latitude in the Zone of Avoidance is highly uncertain (see Schlegel et al., 1998, appendix C). Schlegel et al. (1998) give a colour excess of using IRAS/DIRBE maps of infrared dust emission. We apply this value to the colour-magnitude diagram and estimate a mean colour of the upper MS as a first test of the feasibility of the colour excess value. The unreddened colour of upper MS stars is about zero (see Kenyon & Hartmann, 1995, for example). We have selected main sequence stars in the appropriate magnitude and colour range, and . According to our measurements, the mean MS colour is mag. The colour spread of the MS mag is rather large. This spread, as well as the slightly reddish mean MS colour, could indicate a presence of a blue loop population. Thereby, the extinction value given by Schlegel et al. (1998) seems reasonable, and we also do not expect a significant value of internal extinction in this faint dwarf galaxy.
The reddening in UGCA 92 was also determined by Hodge & Miller (1995) from the spectroscopy of 25 bright H ii regions within the galaxy. Their reddening value is in agreement with the value of Schlegel et al. (1998) within uncertainties. The resolution in the IRAS/DIRBE maps is 6.1 arcmin (Schlegel et al., 1998). It is considerably larger than the ACS field of view. Therefore, we cannot get an information about possible variations in extinction across the field of view from these maps. However, a simple test was made using a colour-magnitude diagram of UGCA 92. A value of the tip of the red giant branch was measured in four different subframes along y axis of the whole ACS frame. We have found, that the TRGB value has no variations within 1.5 of the TRGB uncertainty. Consequently, we suggest no variations of external extinction within the ACS field of UGCA 92.
Therefore, we use the colour excess from Schlegel et al. (1998) in all our measurements in the present paper.
3.2 Foreground contamination
The colour-magnitude diagram is highly contaminated by Milky Way (MW) stars. To account for this contamination we need to construct colour-magnitude diagram of the MW in the direction of UGCA 92. This information can be obtained from images of neighbouring ‘empty’ fields. Three fields nearby UGCA 92 were found in the HST data archive exposed with WFPC2 in the parallel mode (coordinates of the centre are , ). However, the photometric limit of these images is about 3 mag higher than photometric limit of the working UGCA 92 images. To account for the MW contamination in the region of faint stars, we have used the trilegal program (Girardi et al., 2005), which computes synthetic colour-magnitude diagrams for the specified coordinates in the sky and given parameters of the Milky Way models. Consequently, we use neighbouring field stars to account for the Milky Way contribution to the UGCA 92 CMD brighter than mag and the trilegal synthetic data for the fainter part of the CMD. Thirty synthetic CMDs were constructed with trilegal and then averaged to avoid stochastic errors in synthetic CMDs. Random and systematic photometric uncertainties and completeness measured from artificial star experiments were applied to the synthetic CMDs. Resulting contamination by the MW stars was determined to be 202 stars over the CMD of UGCA 92.
4 Distance determination
The distance of UGCA 92 was first estimated by Karachentsev et al. (1994a) using the brightest blue and red supergiants as distance indicators. The estimated distance modulus mag suffered from large photometric uncertainties associated with crowded stellar fields and uncertain reddening. Later Karachentsev et al. (1997) estimated a distance to UGCA 92 using the same distance indicators and better quality data. The resulting distance modulus is mag. Recently, more precise distance determination was made using HST/ACS data (Karachentsev et al., 2006). A deep colour-magnitude diagram permitted the use of the TRGB distance indicator, resulting in a distance modulus of mag.
However, the TRGB method has recently been considerably improved. We have determined the photometric TRGB distance with our trgbtool program, which uses a maximum-likelihood algorithm to determine the magnitude of the tip of the red giant branch from the stellar luminosity function (Makarov et al., 2006). The estimated value of TRGB is equal to mag in the ACS instrumental system. The calibration of the TRGB distance indicator has also recently been improved (Rizzi et al., 2007), where the colour dependence of the absolute magnitude of the TRGB and zero-point issues in HST/ACS and WFPC2 have been addressed. Using this calibration, we have obtained the true distance modulus to UGCA 92 of mag and a distance of Mpc. Bear in mind that the given small error of the TRGB measurement (0.02 mag) and the high precision of the calibration (0.02 mag), the resulting accuracy is entirely determined by uncertainty of foreground extinction of 0.25 mag in the direction of UGCA 92. The colour-magnitude diagram with the fitted RGB luminosity function and the resulting TRGB value is shown in Fig. 5.
5 Star formation history
The star-formation and metal-enrichment history of UGCA 92 has been determined from its CMD using our StarProbe package. This program adjusts the observed photometric distribution of stars in the colour-magnitude diagram against a positive linear combination of synthetic diagrams of single stellar populations (SSPs, single age and single metallicity). Our approach is described in more detail in Makarov & Makarova (2004) and Makarova et al. (2010).
The observed data were binned into Hess diagrams, giving the number of stars in cells of the CMD (two-dimensional histogram). The size of the cell is 0.05 mag in each passband. The synthetic Hess diagrams were constructed from theoretical stellar isochrones and initial mass function (IMF). Each artificial diagram is a map of probabilities to find a star in a cell for given age and metallicity. We used the Padova2000 set of theoretical isochrones (Girardi et al., 2000), and a Salpeter (1955) IMF. The distance is adopted from the present paper (see above) and the Galactic extinction from Schlegel et al. (1998). The synthetic diagrams were altered by the same incompleteness and crowding effects, and the photometric systematics, as those determined for the observations using artificial stars experiments. We also have taken into account the presence of unresolved binary stars (binary fraction). Following Barmina et al. (2002), the binary fraction was taken to be 30 per cent. The mass distribution for the secondary was taken to be flat in the range 0.7 to 1.0 of the primary mass. The best-fitting combination of synthetic CMDs is a maximum-likelihood solution taking into account the Poisson noise of star counts in the cells of the Hess diagram. The resulting star formation history (SFH) is shown in the Fig. 6. The 1 error of each SSP is derived from an analysis of likelihood function.
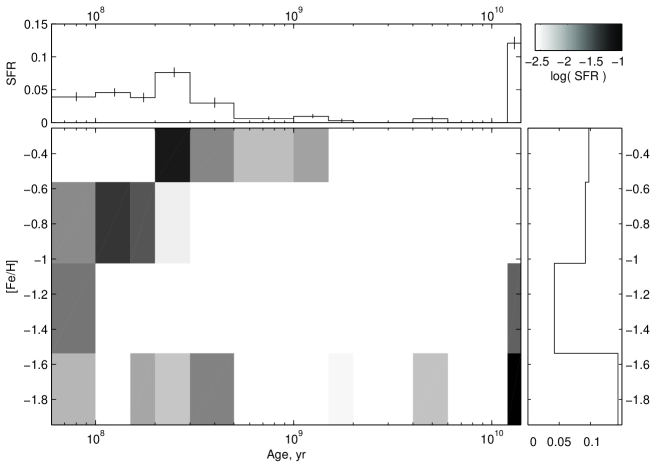
According to our measurements, the main star formation event occurred in the period 12 – 14 Gyr ago with a rather high mean star formation rate (SFR) of M⊙ yr-1. This is the total SFR over the whole galaxy. The metallicity range for the most stars formed during this event is dex. This initial burst accounts for about 84 per cent of the total mass of formed stars.
The quiescence period has appearing from about 6 to 12 Gyr ago. However, the absence of star formation activity in this period could be due to tight packing of the different age stars in the upper part of the RGB. At the distance of 3 Mpc, fainter stellar populations, like a horizontal branch and a lower part of the main sequence, are hardly resolved at the HST. Without these details it is difficult to resolve an age-metallicity-SFR relation for the oldest ( Gyr) star formation events, due to tight packing of the correspondent isochrones for the brightest part of the CMD.
There are signs of marginal (insignificant) star formation 4 – 6 Gyr ago. A metallicity of these stars is similar to the metal abundance of the oldest stellar population.
There are also indications of recent star formation starting about 1.5 – 2 Gyr ago and continuing to the present. We have measured the SFH in short age periods in the last 500 Myr to give more detail for the recent and ongoing star formation. A mean SFR of the stars formed in the last 50 Myr is M⊙ yr-1. This ongoing star formation rate is in good agreement with the independent estimation by Karachentsev & Kaisin (2010) from H flux measurements ( M⊙ yr-1). The recent star formation is showing moderate enhancement from 200 Myr to 300 Myr. A mean star formation rate in the last 500 Myr is M⊙ yr-1. A mass portion of stars formed in the last 500 Myr is 7.6 per cent of the total stellar mass. A metallicity of the recent star formation event is determining with large uncertainty due to relatively poor statistic in comparison with sufficiently more numerous old stars. However, the measurements show that a significant part of the young stars is evidently metal enriched. It is very likely that the ongoing star formation has a metallicity of – dex.
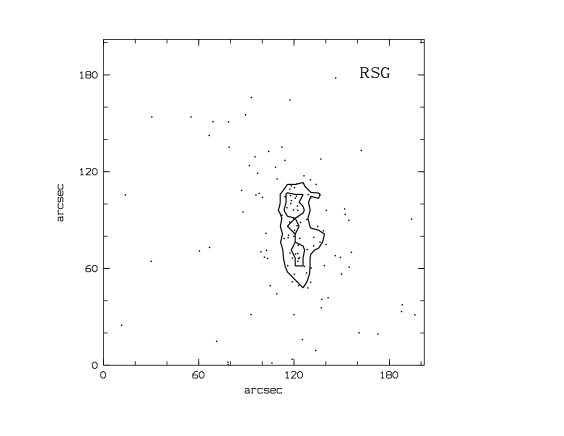
5.1 Spatial distribution of stellar populations
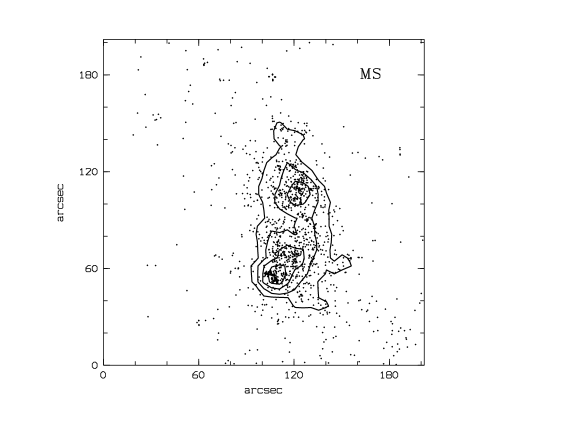


We have selected few stellar populations depending on their position in the CM diagram. The result of this selection is presented in Fig. 7. The upper main sequence stars (upper left panel) has the unreddened colour , their age range is about 10–100 Myr. These youngest stars of the galaxy are mainly concentrated in few knots which highlight regions of ongoing star formation and form actual irregular structure of UGCA 92.
In the upper right panel of the figure we show supposed blue-loop (BL) stars selected by a colour . Their age range is 10–200 Myr. Spatial distribution of these stars is considerably more smooth and regular in comparison with MS stars though they are well-concentrated to the central parts of the galaxy.
A selection criterion for red supergiant stars (RS), with ages in range 10 Myr – 1 Gyr, (lower left panel) was quite conservative ( and ) to avoid possible contamination of the spatial structure by young and intermediate age AGB stars (which are redder) and RGB (which are fainter). As a result, the selected population is not numerous and smoothly distributed in the central part of the galaxy nearly along the major axis.
A most numerous population is the red giant branch (1 Gyr) observed nearly and . The stars are widely distributed in the image with apparent concentration to the centre of UGCA 92 and nearly the major axis of the object. The density of the stars is smoothly decayed to the edge of the galaxy, which probably extends beyond the image boundary.
6 Star formation and environment

Maffei – IC 342 is highly obscured nearby galaxy complex. These galaxies are gathered in two groups. One group is around the giant face-on galaxy IC 342 and another one is around the pair of E+S galaxies Maffei 1 and Maffei 2. According to Karachentsev (2005), the groups contain eight members each. One should keep in mind, that the distances to the group members could be highly uncertain due to the high uncertainty in the Galactic extinction in this direction. The IC 342 group structure is shown in the Fig. 8. There are 19 galaxies in the plot which situated at distances Mpc from IC 342. The distances were taken from the Catalog of Neighboring Galaxies (Karachentsev et al., 2004). The data on the distances were updated recently (Karachentsev, private communications). The two galaxy groups, around IC 342 and around Maffei 1 and Maffei 2 could be seen in the figure. Most of the complex members are dwarf galaxies. The morphological types of the objects are coded by a colour according to de Vaucouleurs et al. (1991) and Karachentsev et al. (2004) from the early types (red) to the late types (dark blue). It is interesting to note that all the dwarf satellites of IC 342, including the galaxy under study UGCA 92 are irregulars. An absence of dwarf spheroidal satellites subsystem in the group can imply that dSphs still were not discovered, because their lower surface brightness and high Galactic extinction put serious observational constrains.
The dwarf irregular galaxy under study UGCA 92 is situated at a linear distance kpc from the gravitational centre of the group IC 342. The three nearest to UGCA 92 galaxies are UGCA 86 (a linear distance kpc), UGCA 105 ( kpc) and NGC 1569 ( kpc). UGCA 92 is often considered to be the companion to the starburst galaxy NGC 1569. They have been known to have close radial velocities, km s-1 for UGCA 92 (Begum et al., 2008) and km s-1 for NGC 1569 (Walter et al., 2008). Indeed, except for the giant spiral IC 342 ( kpc from NGC 1569) and a very small irregular galaxy Cam B ( kpc from NGC 1569), UGCA 92 is the spatially closest companion to NGC 1569.
A median radial velocity of galaxies within IC 342 group is km s-1 with the velocity dispersion of 79 km s-1. The pair of galaxies NGC 1569 – UGCA 92 has a maximal peculiar velocity within the group. The question arises whether these galaxies form a real subsystem within IC 342 group. Indeed, the uncertainty in UGCA 92 distance is 350 kpc (see Tab. 1), which is pretty close to derived linear separation between NGC 1569 and UGCA 92. The main source of this uncertainty is a huge Galactic absorption. Taking into account the close radial velocities and close positions on the sky, these galaxies could form a tight physical pair. In this case we could expect to find a correlation in their star formation. From the other hand, the estimation of the linear distance between the galaxies is reasonable. Therefore, the similar velocities and positions on the sky are just coincidence in a virialized system.
NGC 1569 is the well-known nearest strong starburst galaxy. Vallenari & Bomans (1996) have found evidence of a recent burst of star formation from about 15 to 4 Myr ago. One more distinct burst was found not older than 150 Myr ago. Later Angeretti et al. (2005) have found three recent distinct starbursts using HST/NICMOS data: 13 – 37 Myr, 40 – 150 Myr and 1 Gyr ago (for 2.2 Mpc distance). A presence of bright H ii regions also indicate substantial ongoing star formation. The galaxy contains two extremely luminous super-star clusters (Hunter et al., 2000). In the last work 45 other young clusters also have been identified, the most of them have an age Myr. The distance to this galaxy was uncertain for the long time. The accurate TRGB distance ( Mpc) was measured by Grocholski et al. (2008) using HST/ACS images. Stellar content of the NGC 1569 halo was studied in great detail recently by Ryś et al. (2011). Judging from these two papers, the old (about 10 Gyr) RGB stars, including the outer halo in this starburst galaxy should be more metal reach ([Fe/H] ) than we measured for the old RGB stars of UGCA 92. One of the interesting conclusions of Ryś et al. (2011) is that the outer stellar halo of the starburst galaxy NGC 1569 is not tidally truncated and it is not outward extension of the inner disk, but instead it is the distinct stellar halo with no evident age/metallicity gradient, i.e. the starburst phenomenon is highly centrally concentrated. Probably, such a morphology could be the result of past interaction/merging. The question arises whether we can find any signs of past interactions for the dwarf galaxies using the information on star formation of these objects.
Besides UGCA 92, in the subgroup of the closest neighbours NGC 1569–UGCA 92–UGCA 86–UGCA 105 only UGCA 86 has observations deep enough (HST/ACS images within the project number 9771, PI I. Karachentsev) to judge about overall star formation from the photometry of resolved stars. The colour-magnitude diagram of this galaxy is presented in the Fig. 9. The both UGCA 92 (D = 3.03 Mpc) and UGCA 86 (D = 2.96 Mpc, Karachentsev et al. (2006)) are at nearly the same distance from us. However, UGCA 86 has the brighter absolute stellar magnitude () and larger angular size. We have measured more resolved stars in the ACS field. An upper main sequence and helium-burning blue loop stars are found at mag. The well-populated RSG and the huge AGB are situated above the TRGB at mag and mag. Galactic extinction for UGCA 86 is even higher ( mag according to Schlegel et al. (1998)). A photometric limit and the large colour excess seriously affect the RGB zone in the CMD (see Fig. 9). This fact reduces seriously a reliability of a computational modelling of the star formation older than 1 Gyr. Therefore, we only fitted a number of theoretical isochrones to the young stellar population of UGCA 86. The age and metallicity of these populations are similar in UGCA 86 and UGCA 92.
H i and H observations of NGC 1569, UGCA 92 and UGCA 86 were performed by different authors. Numerous H knots were detected in all the three galaxies, tracking the ongoing star formation events in these objects (Hodge & Miller, 1995; Kingsburgh & McCall, 1998; Karachentsev & Kaisin, 2010). High-sensitivity H i maps of NGC 1569 show an evidence for a companion H i cloud connected with the galaxy by a low surface brightness H i bridge. At the edge of NGC 1569 it coincides with H i arcs (Stil & Israel, 1998). The hydrogen cloud is apparently not correlated with any optical satellites/counterparts. Stil & Israel (2002) argued, that about 10 per cent by mass of all H i in NGC 1569 have unusually high velocities. Some of this H i may be associated with the mass outflow evident from H measurements, but some may also be associated with the NGC 1569’s H i companion and H i bridge, in which case, infall rather than outflow might be the cause of the discrepant velocities. H i observations by Stil et al. (2005) show a complex structure of UGCA 86, with two separate components: a rotating disk and a highly elongated spur that is kinematically disjunct from the disk.
Hereby, summarizing the cited results, we could conclude, that hydrogen at the outskirts of the starburst galaxy NGC 1569 is highly disturbed with the signs of infall, but no similar features were detected in the neighbouring dwarfs UGCA 92 and UGCA 86.
It should be note, that all the data known to date could not give us the particular age, when the series of the distinct intensive star bursts in NGC 1569 was started. Angeretti et al. (2005) mention that the last starburst should occur 8 – 27 Myr ago if the distance to the galaxy is 2.9 Mpc instead 13 – 37 Myr assuming the distance of 2.2 Mpc. The revised accurate distance to NGC 1569 is 3.36 Mpc according to Grocholski et al. (2008). It is possible that other two starburst periods occurred 40 – 150 Myr ago and about 1 Gyr ago will be shifted to the younger ages assuming the new distance. Our data on recent star formation in the companion UGCA 92 galaxy show substantial and continuous star formation in the last 500 Myr with the enhancement at about 200 – 300 Myr. Therefore, our results do not indicate a direct connection between the recent star formation in the two galaxies.
7 Conclusions
We have derived a quantitative star formation history of the dwarf irregular galaxy UGCA 92 situated in the highly obscured nearby galaxy group IC 342. Due to a low Galactic latitude () the extinction is very high ( according to Schlegel et al. (1998)) in this direction. The star formation history was reconstructed using HST/ACS images of the galaxy and a resolved stellar population modelling. According to our measurements, 84 per cent of the total stellar mass were formed during the star formation occurred about 12 – 14 Gyr ago. A metallicity range of these stars is dex. There are also signs of marginal star formation 4 – 6 Gyr ago. A metallicity of these stars is similar to the metal abundance of the oldest stellar population.
UGCA 92 has a typical morphology of an irregular dwarf with apparent associations of bright blue stars in its body. Numerous H ii knots were also detected in the galaxy, tracking the ongoing star formation. According to our measurements, recent star formation was started about 1.5 – 2 Gyr ago and continuing to the present. We modelled the star formation history with good time resolution for the recent star formation event. The continuous star formation in this period shows moderate enhancement from about 200 Myr to 300 Myr ago. A mean star formation rate in the last 500 Myr is M⊙ yr-1 and M⊙ yr-1 in the last 50 Myr. The mass portion of the stars formed in the last 500 Myr is 7.6 per cent of the total mass of formed stars. A metallicity of the recent star formation event is determining with a large uncertainty due to relatively poor statistic in comparison with sufficiently more numerous old stars. However, the measurements show that a significant part of the young stars is evidently metal enriched. It is very likely that the ongoing star formation has a metallicity of – dex.
UGCA 92 is often considered to be the companion to the starburst galaxy NGC 1569. They have been known to have close radial velocities, km s-1 for UGCA 92 (Begum et al., 2008) and km s-1 for NGC 1569 (Walter et al., 2008). The linear distance between the galaxies is kpc. These two objects are evidently could be considered as a close pair of galaxies.
Another dwarf galaxy close to UGCA 92 is UGCA 86 with the linear distance kpc. Our HST/ACS data allow to judge about overall star formation from the photometry of resolved stars. Theoretical isochrone fitting shows an apparent similarity of the resolved stellar populations in the two galaxies.
It is worth to note, that the mean metallicity of the old RGB stars measured by us in UGCA 92 is lower, than the known metallicity of the halo RGB stars in NGC 1569.
Comparing our star formation history of UGCA 92 with that of NGC 1569 reveals no causal or temporal connection between recent star formation events in these two galaxies. We suggest, that the starburst phenomenon in NGC 1569 has not related to the closest dwarf neighbours and does not affect their star formation history.
Probably, detailed N-body modelling of the group within 300 kpc from IC 342 is necessary to clarify a reason of recent star bursts in NGC 1569.
Acknowledgements
The work was supported by the Russian Foundation for Basic Research (RFBR) grant 11–02–00639 and Russian-Ukrainian RFBR grant 11–02–90449. We acknowledge the support of the Ministry of Education and Science of the Russian Federation, the contract 14.740.11.0901. This work was partially supported by Physical Sciences Department program of Russian Academy of Sciences. We are thankful to the anonymous referee for the very useful comments to the paper and to Scott Trager for his kind help with the text preparation. We acknowledge the usage of the HyperLEDA database (http://leda.univ-lyon1.fr).
References
- Angeretti et al. (2005) Angeretti L., Tosi M., Greggio L., Sabbi E., Aloisi A., Leitherer C., 2005, AJ, 129, 2203
- Barmina et al. (2002) Barmina R., Girardi L., Chiosi C., 2002, A&A, 385, 847
- Begum et al. (2008) Begum A., Chengalur J. N., Karachentsev I. D., Sharina M. E., Kaisin S. S., 2008, MNRAS, 386, 1667
- de Vaucouleurs et al. (1991) de Vaucouleurs G., de Vaucouleurs A., Corwin Jr. H. G., Buta R. J., Paturel G., Fouque P., 1991, Third Reference Catalogue of Bright Galaxies, de Vaucouleurs, G., de Vaucouleurs, A., Corwin, H. G., Jr., Buta, R. J., Paturel, G., & Fouque, P., ed.
- Dolphin (2002) Dolphin A. E., 2002, MNRAS, 332, 91
- Ellis et al. (1984) Ellis G. L., Grayson E. T., Bond H. E., 1984, PASP, 96, 283
- Girardi et al. (2000) Girardi L., Bressan A., Bertelli G., Chiosi C., 2000, A&AS, 141, 371
- Girardi et al. (2005) Girardi L., Groenewegen M. A. T., Hatziminaoglou E., da Costa L., 2005, A&A, 436, 895
- Grocholski et al. (2008) Grocholski A. J., Aloisi A., van der Marel R. P., Mack J., Annibali F., Angeretti L., Greggio L., Held E. V., Romano D., Sirianni M., Tosi M., 2008, ApJ, 686, L79
- Hodge & Miller (1995) Hodge P., Miller B. W., 1995, ApJ, 451, 176
- Hoessel et al. (1988) Hoessel J. G., Saha A., Danielson G. E., 1988, PASP, 100, 680
- Hunter et al. (2000) Hunter D. A., O’Connell R. W., Gallagher J. S., Smecker-Hane T. A., 2000, AJ, 120, 2383
- Karachentsev et al. (1997) Karachentsev I., Drozdovsky I., Kajsin S., Takalo L. O., Heinamaki P., Valtonen M., 1997, A&AS, 124, 559
- Karachentsev (2005) Karachentsev I. D., 2005, AJ, 129, 178
- Karachentsev et al. (2006) Karachentsev I. D., Dolphin A., Tully R. B., Sharina M., Makarova L., Makarov D., Karachentseva V., Sakai S., Shaya E. J., 2006, AJ, 131, 1361
- Karachentsev & Kaisin (2010) Karachentsev I. D., Kaisin S. S., 2010, AJ, 140, 1241
- Karachentsev et al. (2004) Karachentsev I. D., Karachentseva V. E., Huchtmeier W. K., Makarov D. I., 2004, AJ, 127, 2031
- Karachentsev et al. (1994a) Karachentsev I. D., Tikhonov N. A., Sazonova L. N., 1994a, Astronomy Letters, 20, 84
- Karachentsev et al. (1994b) —, 1994b, A&AS, 106, 555
- Karachentseva et al. (1996) Karachentseva V. E., Prugniel P., Vennik J., Richter G. M., Thuan T. X., Martin J. M., 1996, A&AS, 117, 343
- Kenyon & Hartmann (1995) Kenyon S. J., Hartmann L., 1995, ApJS, 101, 117
- Kingsburgh & McCall (1998) Kingsburgh R. L., McCall M. L., 1998, AJ, 116, 2246
- Makarov & Karachentsev (2011) Makarov D., Karachentsev I., 2011, MNRAS, 412, 2498
- Makarov et al. (2006) Makarov D., Makarova L., Rizzi L., Tully R. B., Dolphin A. E., Sakai S., Shaya E. J., 2006, AJ, 132, 2729
- Makarov & Makarova (2004) Makarov D. I., Makarova L. N., 2004, Astrophysics, 47, 229
- Makarova et al. (2010) Makarova L., Koleva M., Makarov D., Prugniel P., 2010, MNRAS, 406, 1152
- Makarova & Karachentsev (2003) Makarova L. N., Karachentsev I. D., 2003, Astrophysics, 46, 144
- Nilson (1974) Nilson P., 1974, in UGCA, pp. 0–+
- Rizzi et al. (2007) Rizzi L., Tully R. B., Makarov D., Makarova L., Dolphin A. E., Sakai S., Shaya E. J., 2007, ApJ, 661, 815
- Ryś et al. (2011) Ryś A., Grocholski A. J., van der Marel R. P., Aloisi A., Annibali F., 2011, ArXiv e-prints
- Salpeter (1955) Salpeter E. E., 1955, ApJ, 121, 161
- Schlegel et al. (1998) Schlegel D. J., Finkbeiner D. P., Davis M., 1998, ApJ, 500, 525
- Sharina et al. (2008) Sharina M. E., Karachentsev I. D., Dolphin A. E., Karachentseva V. E., Tully R. B., Karataeva G. M., Makarov D. I., Makarova L. N., Sakai S., Shaya E. J., Nikolaev E. Y., Kuznetsov A. N., 2008, MNRAS, 384, 1544
- Stil et al. (2005) Stil J. M., Gray A. D., Harnett J. I., 2005, ApJ, 625, 130
- Stil & Israel (1998) Stil J. M., Israel F. P., 1998, A&A, 337, 64
- Stil & Israel (2002) —, 2002, A&A, 392, 473
- Tully et al. (2006) Tully R. B., Rizzi L., Dolphin A. E., Karachentsev I. D., Karachentseva V. E., Makarov D. I., Makarova L., Sakai S., Shaya E. J., 2006, AJ, 132, 729
- Vaduvescu et al. (2005) Vaduvescu O., McCall M. L., Richer M. G., Fingerhut R. L., 2005, AJ, 130, 1593
- Vallenari & Bomans (1996) Vallenari A., Bomans D. J., 1996, A&A, 313, 713
- Walter et al. (2008) Walter F., Brinks E., de Blok W. J. G., Bigiel F., Kennicutt Jr. R. C., Thornley M. D., Leroy A., 2008, AJ, 136, 2563