Jet - Underlying Event Separation Method for Heavy Ion Collisions at the Relativistic Heavy Ion Collider
Abstract
Reconstructed jets in heavy ion collisions are a crucial tool for understanding the quark-gluon plasma. The separation of jets from the underlying event is necessary particularly in central heavy ion reactions in order to quantify medium modifications of the parton shower and the response of the surrounding medium itself. There have been many methods proposed and implemented for studying the underlying event substructure in proton-proton and heavy ion collisions. In this paper, we detail a method for understanding underlying event contributions in Au+Au collisions at = 200 GeV utilizing the HIJING event generator Gyulassy and Wang (1994). This method, extended from previous work by the ATLAS collaboration ATLAS (2011), provides a well-defined association of “truth jets” from the fragmentation of hard partons with “reconstructed jets” using the anti- algorithm. Results presented here are based on an analysis of 750M minimum bias HIJING events. We find that there is a substantial range of jet energies and radius parameters where jets are well separated from the background fluctuations (often termed “fake jets”) that make jet measurements at RHIC a compelling physics program.
I Introduction
Understanding the detailed interaction and coupling between hard scattered partons and the quark-gluon plasma through which they propagate is essential to our fundamental knowledge of QCD and in determining properties of the quark-gluon plasma. The measurement of fully reconstructed jets in heavy ion collisions at the LHC Aad et al. (2010); Chatrchyan et al. (2011) highlight the substantial additional information contained therein and its complementary nature to single hadron Adcox et al. (2002); Adams et al. (2003); Adare et al. (2008a), di-hadron correlations Adams et al. (2006); Adare et al. (2008b); Abelev et al. (2009); Adare et al. (2010). The measurement of direct photon-jet correlations is another critical handle to be utilized Wang et al. (1996). Extending fully calorimetric jet measurements to lower center-of-mass energies at the Relativistic Heavy Ion Collider provides measurements for kinematics difficult to access at the LHC and the QGP at different temperature and coupling regime.
With the first Pb+Pb at =2.76 TeV collisions at the LHC new insights into jet physics in heavy ion collisions were gained. The ATLAS collaboration reported an increase in the number of energy asymmetric di-jets in central Pb+Pb collisions compared to proton-proton and peripheral Pb+Pb collisions Aad et al. (2010). They also reported the suppression of jets with 100200 GeV/c by a factor of approximately when comparing central to peripheral Pb+Pb collisions Steinberg and Collaboration (2011). The CMS collaboration measured jet-hadron correlations in a similar jet range and found that the energy lost by high fragments was approximately balanced by very low tracks far from the jet axis Chatrchyan et al. (2011). However the data from both RHIC and the initial LHC results are not enough to constrain the physics of jet quenching. Most theoretical descriptions have relied on weakly coupled techniques Majumder and Van Leeuwen (2010). Features of strong coupling, as observed in descriptions of the bulk matter, might contribute to jet quenching as well. More data on jet observables (including dijet, -jet and heavy flavor tagged jets) at RHIC and the LHC will be necessary to understand the physics of jet quenching over the full range of medium properties and jet kinematics and probe for sensitivity of the quenching to outgoing parton virtuality.
The multiplicity of charged particles is approximately 2.15 times higher for Pb+Pb central collisions at = 2.76 TeV compared with Au+Au central collisions at =200 GeV Aamodt et al. (2011). Thus the soft particle background is substantially higher for LHC events. However, the jet cross section is substantially higher as well, and measurements for jets with energies greater than 100 GeV appear well separated from the background (though detailed publications of these studies are not yet available). Various methods have been explored at the LHC and RHIC for understanding the underlying event contributions, and what are often referred to as “fake jets” Lai (2009); Jacobs (2010); ATLAS (2011); Cacciari et al. (2011); Abelev et al. (2012).
At =200 GeV the projected jet rates into 1 based on NLO pQCD cross sections Vogelsang and expected RHIC luminosities have been computed PHENIX (2010). In a typical year of RHIC running 50B Au+Au events could be sampled. In the top 20% centrality that would lead to approximately jets above 20 GeV, jets above 30 GeV, jets above 40 GeV and jets above 50 GeV. Over 60% of the time there is full containment of the opposing dijet for 20 GeV jets with that percentage increasing with increasing jet energy.
In this paper, we present a study of jet reconstruction and separation from the underlying event using the HIJING Gyulassy and Wang (1994) event generator for Au+Au events at =200 GeV. This follows an iterative underlying event subtraction procedure extended from one developed by the ATLAS Collaboration ATLAS (2011). While the exact definition of a correctly reconstructed jet versus a “fake jet” is arbitrary, this methodology allows us to make a well-defined and documented comparison to cross-check with other methods.

II Jet - Underlying Event Separation Methodology
For these studies we utilize the HIJING (version 1.383) event generator run with standard settings and quenching turned off for Au+Au collisions at =200 GeV. HIJING is a QCD based Monte Carlo for the study of jet production in high energy nucleus-nucleus collisions. For these initial studies, we explore what a “perfect” detector is capable of measuring. We assume a segmentation in = and that all particle energies are recorded perfectly (with the exception of neutrinos and muons). We assume a nominal coverage of and full azimuthal coverage. For the entire study we utilize the anti- jet reconstruction algorithm Cacciari et al. (2008) (part of the FastJet package Cacciari and Salam (2006)) with radius parameters R=0.2, 0.3, and 0.4.
A schematic diagram of the underlying event subtraction steps is shown in Fig. 1. The first step is to run the anti- algorithm over the full set of energy values (unsubtracted) with R=0.2 and record the jet axis coordinates in and . This initial suite of jet candidates is used to exclude regions around these jets from the initial underlying event average energy. Exclusion regions are defined by R=0.2 jets in which the maximum tower in the jet has an energy of more than three times the average tower energy in the jet. We then exclude all energies for cells whose center coordinate is within of any of the above initial jet candidates. The remaining energy values are used to determine the average cell energy (i.e. in the non-jet regions) in 0.1 strips. The modulation in the background due to flow must first be removed, so the (i.e. parameter) is also determined for the energy distribution and removed from each cell before determining the average. Only the strips which have complete coverage after the determination of the exclusion regions are used in the determination.
The HIJING generator has no bulk collective flow and thus has only a modest from decays, di-jet correlations and global momentum conservation. As the flow modulation of the underlying event is an important component of any subtraction procedure on real data, we have added a flow modulation to the individual HIJING particles prior to segmenting the energies into cells. The flow parameterization Masera et al. (2009) is based on fits to the available data. Higher flow moments have an increasing relative importance for more central events Adare et al. (2011), and can be incorporated in future studies.
This underlying event average energy is a zeroth order estimate since the initial jet determination does not have an underlying event subtraction. We now subtract the modulated underlying event energy cell-by-cell from the cells contained by the initial set of R=0.2 jets to get a better estimate of the jet . At this second iterative step, new exclusion regions are defined by towers with 0.4 around background subtracted jets with 20 GeV. The underlying event and are re-determined removing towers within 0.4 of the jets as described above and the background re-subtracted from the original unsubtracted towers. Finally the anti- jet algorithm is run on the background subtracted towers with a range of R values (0.2, 0.3, 0.4).
When the jet reconstruction is run over background subtracted towers many of the towers have negative . We modify these towers to have a small positive energy before passing them to the jet reconstruction algorithm. After the towers are grouped into jets we recalculate the jet including the negative energy.
III HIJING Truth Information
In order to identify “true jets” from the HIJING event generator, we have augmented the code so that every time the fragmentation routine (HIJFRG) is called, we record the set of final state hadrons that result from that fragmentation. We then run the anti- algorithm on those final state hadrons (using their exact momentum vectors). The jet reconstruction is run once for each anti- jet R parameter under consideration and the resulting “true jet” information is added to the output.
Before presenting the results, it is important to define our terms. Even in a model such a HIJING where all truth information is known, there is an arbitrariness in the definitions of “fake jets” and “true jets” as examples. For example, consider a HIJING fragmentation call that results in hadrons reconstructed via anti- with R = 0.4 into a jet with an energy of 20 GeV. If after running jet reconstruction over the full HIJING event one reconstructs a jet using anti- with R = 0.4 that has a jet axis within and energy 18 GeV, common sense might dictate that this was a “true jet” and the 2 GeV difference is a result of the fluctuations in the underlying event. However, imagine that the HIJING fragmentation reconstructed to an energy of 4 GeV and the full HIJING event resulted in a jet along the same axis but with energy of 40 GeV. Common sense might dictate that this was a “fake jet” (i.e. a very small jet that combined with substantial background fluctuations that results in a very large energy reconstruction).
Here, we define a “fake jet” as one where the associated HIJING fragmentation jet is less than 5 GeV (or does not exist at all). The jet is a good “true jet” if there is an associated HIJING fragmentation jet within and greater than 5 GeV. We then examine in detail the HIJING fragmentation jet energy distribution for those associated with different selected fully reconstructed jet energies. In principle, one could introduce no such arbitrary definition and put everything into a response matrix down to the lowest energy scales. In practice, if there are substantial contributions of very low energy HIJING fragmentation jet energies to high energy reconstruction jets it will be nearly impossible to control the systematics and unfold such a matrix.
Results presented here are based on an analysis of 750M minimum bias HIJING events.
IV Results
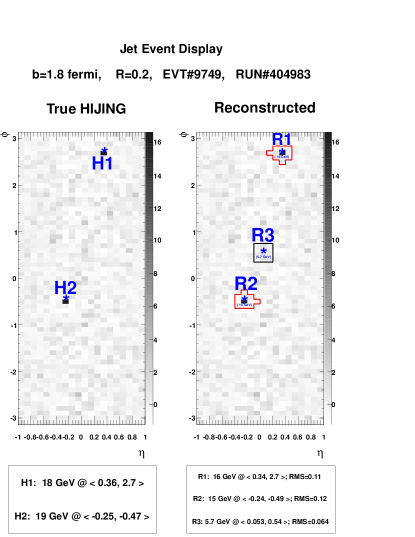
In order to illustrate the background subtraction procedure, we show a selection of event displays. Figure 2 shows a true dijet pair with R = 0.2 where both jets have been matched to reconstructed jets. The reconstructed jet has an axis within 0.1 of the true. Also shown in the event are the next highest reconstructed jet. This jet is not matched to any true jets with 5 GeV and has in the region where we expect fake jets to dominate. Figure 3 shows a fake jet with 30 GeV which is not matched to any true jet from the HIJING event. One other fake jet, also not matched to any true jets, is shown on the plot.

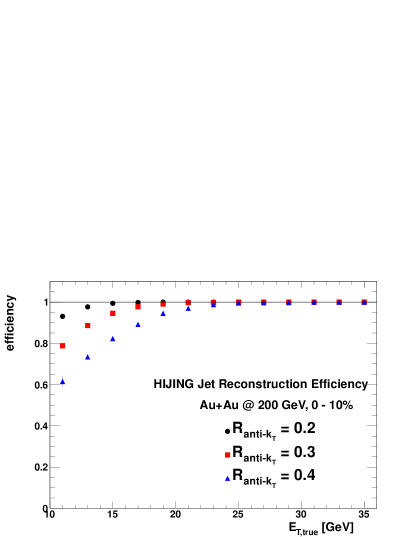
We concentrate on central collisions where the underlying event background is largest. For this study we define collision centrality in the HIJING events by the number of charged particles with psuedorapidity 34. Figure 4 shows the efficiency of finding matches to true jets in the most central 10% of collisions for the various anti- R parameters as a function of the true jet . For all R parameters the efficiency rises with jet and approaches 100% between 20 and 30 GeV.
However, in order to quantify the jet performance we need to understand the contribution to the reconstructed jet spectrum from jets which are not matched to any true HIJING jet, “fake jets”. In Figure 5 we show the true, reconstructed and fake jet spectra for R = 0.2 (left), 0.3 (middle) and 0.4 (right) for the 10% most central Au+Au at = 200 GeV HIJING events. Shown as red are the true HIJING fragmentation jet distributions. The points show the final reconstructed jet distribution. This is broken down into those jets that are matched with a true HIJING jet and those that are not matched with a true HIJING jet. To be considered matched the jet axis of the reconstructed jet must be within 0.25 of the true HIJING jet and the HIJING jet must have 5 GeV. One observes a good match between true HIJING and matched reconstructed jet distributions taking into account the additional energy resolution blurring from the underlying event subtraction. One observes a very large contribution fraction of reconstructed jets are not matched at low ; the fraction then falls quickly and goes below the matched reconstructed jets at around 18 GeV in the R = 0.2 case. The crossing point is at higher for R=0.3 and 0.4 jets, around 25 and 30 GeV, respectively.


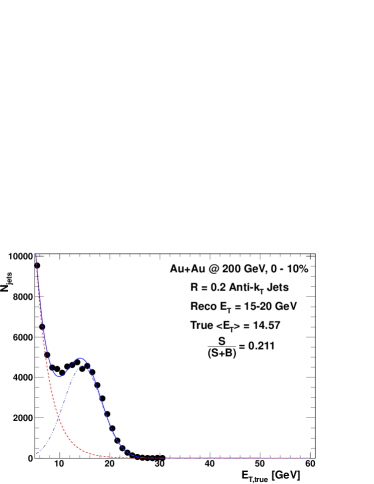
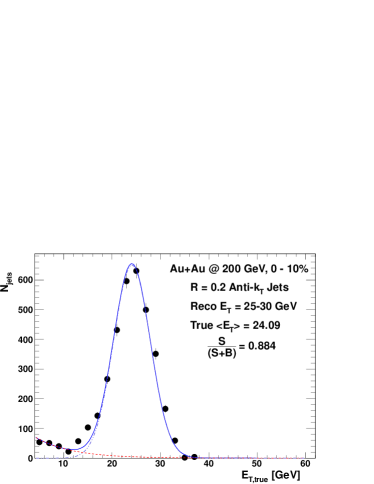
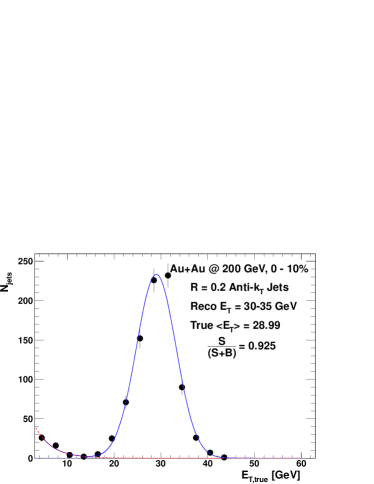
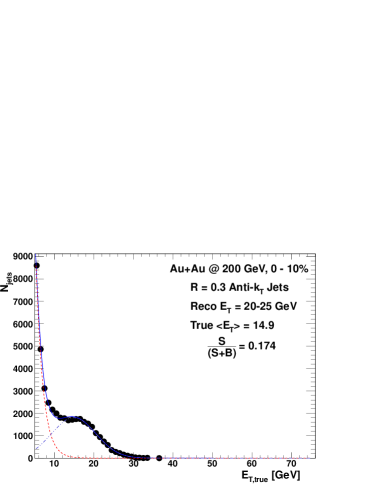
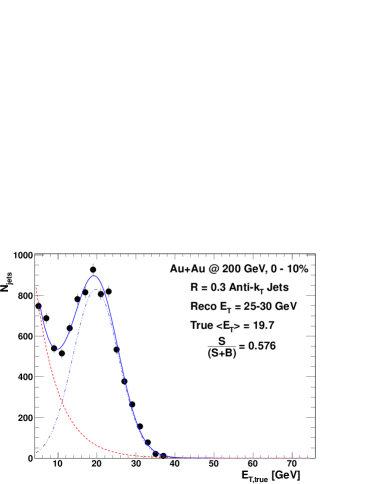
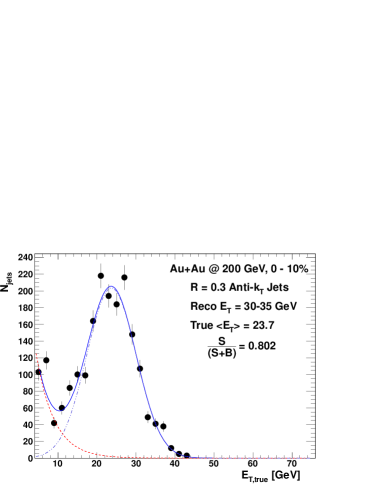
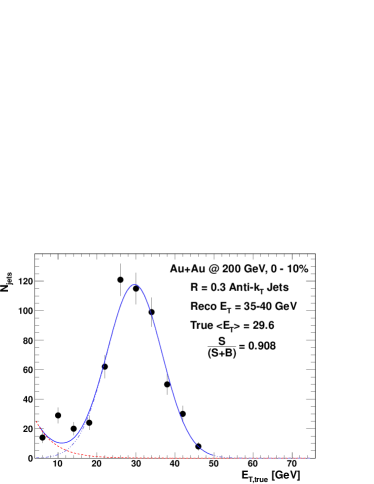
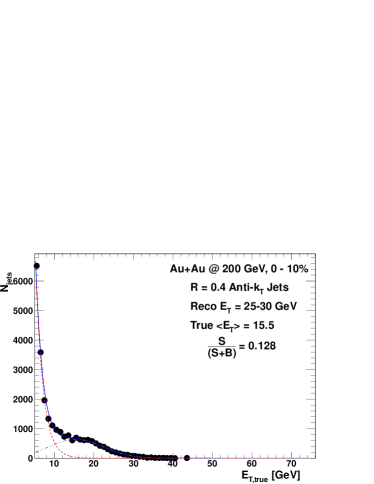
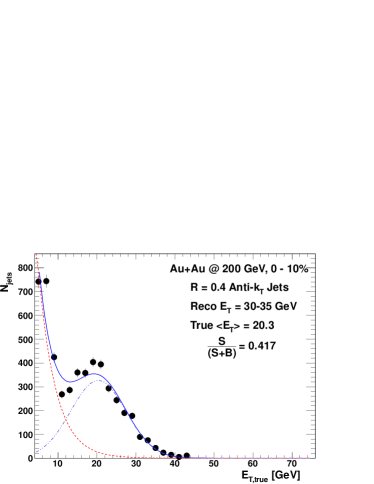
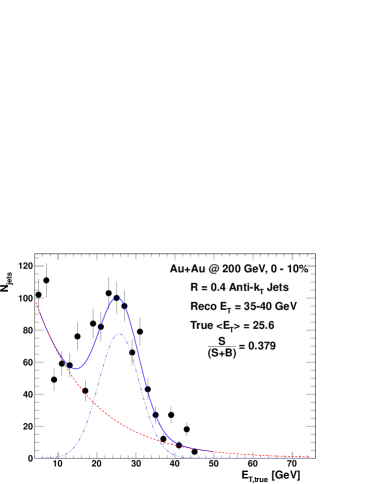
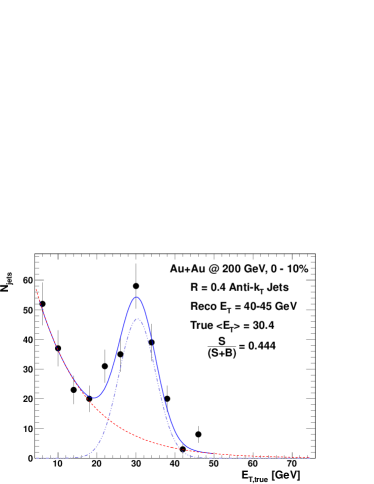
The low fake rate alone is not sufficient due to the arbitrariness of the 5 GeV separation between “fake” and “true” jet fragmentation associations. Shown in Figure 6 is the distribution of HIJING true energies for fully reconstructed jet energies (with different selections). The upper left panel for reconstructed jets with R = 0.2 and energies 15-20 GeV shows a peaked distribution around 15 GeV. The tail to lower energies could in principle be accounted for in a response matrix (though with great care and systematic cross checks). However, as one moves to higher energies 25-30 GeV, there is essentially no tail contributions and a peak around 26 GeV and width of 5 GeV. This indicates a regime where a standard response matrix and unfolding procedure should be successful. Similar plots are shown for R = 0.3 and R = 0.4. There is a shift downward from the reconstructed jet energies to the corresponding true jet energies due to the rapid fall off of the jet cross section with energy and a tail to low HIJING jet energies that disappears with increasing reconstructed jet and the corresponding decrease of fake jets.
In order to quantify the purity of the reconstructed jet sample, we have fit the distributions with a background contribution which falls exponentially with increasing jet and a Gaussian with a free mean and width. The results of those fits, along with the fractions of the total reconstructed jets (both matched and unmatched) which are included in the Gaussian are shown in Tables 1-3.

| (GeV) | (GeV) | ||
|---|---|---|---|
| (GeV) | (GeV) | ||
|---|---|---|---|
| (GeV) | (GeV) | ||
|---|---|---|---|
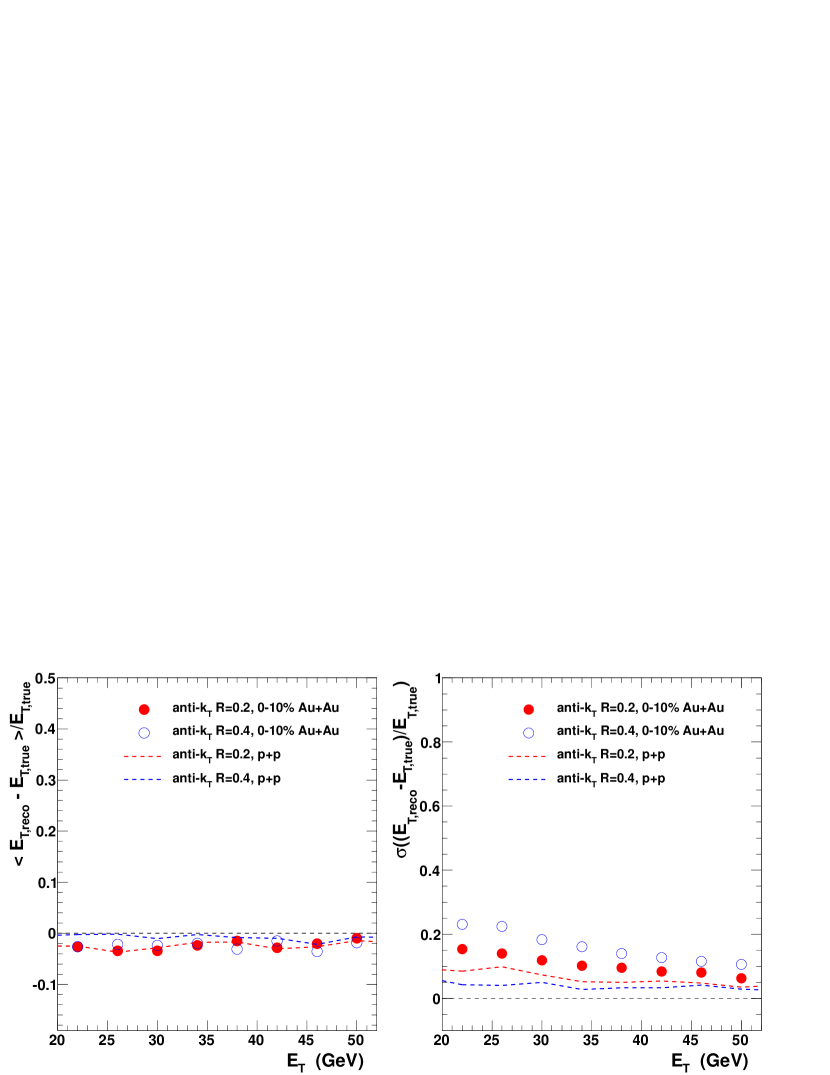
In addition to the fake jet contribution to the reconstructed jet sample it is also important to quantify the jet energy resolution and scale for our algorithm. In order to do this we have embedded PYTHIA Sjostrand et al. (2001) (version 6.421) jets into our HIJING events. One PYTHIA event with a high dijet was embedded into every HIJING event. The PYTHIA and reconstructed jets are required to obey the same matching cut of 0.25 as the fake jet study discussed above. The jet energy resolution and jet energy scale are shown in Figure 9 the anti- R parameters 0.2 and 0.4 for central HIJING events and PYTHIA events (not embedded into HIJING) put into towers in the same manner as the HIJING events. The jet energy resolution improves with increasing jet energy and decreasing jet R as expected. The energy scale, is within 5% of zero for the anti- R parameters considered here. The energy offset for the PYTHIA jets is due to the imposed tower segmentation. For the purposes of this study we did not pursue further refinements. A similar resolution evaluation has been done by the CMS collaboration Chatrchyan et al. (2011).
V Conclusions
We have performed a HIJING study of jet reconstruction using an iterative background subtraction method and full calorimetric information. We have shown that in this case we are able to reconstruct the input HIJING jets with a large signal to background with 20 GeV for R = 0.2 jets, 30 GeV for R = 0.3 jets and 40 GeV for R=0.4 jets. The results presented here are obtained without any additionally rejection of fake jets, though it is possible the reconstructed jet purities shown here could be further increased with fake jet rejection of some kind.
This study was designed to evaluate the feasibility of purely calorimetric jet measurements at RHIC. The results here are obtained using an ideal model of the detector and suggest promise for such measurements. This study is of course limited in scope. We have not taken into effect any detector effects aside from geometrical acceptance and granularity. More detailed studies need to be done to demonstrate the suitability of any particular detector design for jet measurements.
VI Acknowledgments
We would like to thank Yue Shi Lai for valuable discussions on the identification of jets in HIJING. Funding has been provided from the Department of Energy under contract number DE-AC02-98CH10886 (A.M.S, A.F, D.P.M, C.H.P, and P.S) and grant numbers DE-FG02-96ER40988 (J.A.H, B.S.,M.vS) and DE-FG02-03ER41244 (M.P.M, J.L.N, M.S).
References
- Gyulassy and Wang (1994) M. Gyulassy and X. Wang, Comput. Phys. Commun. 83, 307 (1994), eprint nucl-th/9502021.
- ATLAS (2011) ATLAS (ATLAS Collaboration) (2011), URL cdsweb.cern.ch/record/1353220/files/ATLAS-CONF-2011-075.pdf.
- Aad et al. (2010) G. Aad et al. (Atlas Collaboration), Phys.Rev.Lett. 105, 252303 (2010), eprint 1011.6182.
- Chatrchyan et al. (2011) S. Chatrchyan et al. (CMS Collaboration), Phys.Rev. C84, 024906 (2011), eprint 1102.1957.
- Adcox et al. (2002) K. Adcox et al. (PHENIX), Phys. Rev. Lett. 88, 022301 (2002), eprint nucl-ex/0109003.
- Adams et al. (2003) J. Adams et al. (STAR Collaboration), Phys.Rev.Lett. 91, 172302 (2003), eprint nucl-ex/0305015.
- Adare et al. (2008a) A. Adare et al. (PHENIX), Phys. Rev. Lett. 101, 232301 (2008a), eprint 0801.4020.
- Adams et al. (2006) J. Adams et al. (STAR Collaboration), Phys.Rev.Lett. 97, 162301 (2006), eprint nucl-ex/0604018.
- Adare et al. (2008b) A. Adare et al. (PHENIX Collaboration), Phys.Rev. C78, 014901 (2008b), eprint 0801.4545.
- Abelev et al. (2009) B. Abelev et al. (STAR Collaboration), Phys.Rev. C80, 064912 (2009), eprint 0909.0191.
- Adare et al. (2010) A. Adare et al. (PHENIX), Phys. Rev. Lett. 104, 252301 (2010), eprint 1002.1077.
- Wang et al. (1996) X.-N. Wang, Z. Huang, and I. Sarcevic, Phys.Rev.Lett. 77, 231 (1996), eprint hep-ph/9605213.
- Steinberg and Collaboration (2011) P. Steinberg and A. Collaboration (2011), eprint 1110.3352.
- Majumder and Van Leeuwen (2010) A. Majumder and M. Van Leeuwen (2010), eprint 1002.2206.
- Aamodt et al. (2011) K. Aamodt et al. (ALICE Collaboration), Phys.Rev.Lett. 106, 032301 (2011), eprint 1012.1657.
- Lai (2009) Y. Lai (PHENIX) (2009), eprint 0911.3399.
- Jacobs (2010) P. Jacobs (STAR Collaboration) (2010), eprint 1012.2406.
- Cacciari et al. (2011) M. Cacciari, G. P. Salam, and G. Soyez, Eur.Phys.J. C71, 1692 (2011), eprint 1101.2878.
- Abelev et al. (2012) B. Abelev et al. (ALICE Collaboration) (2012), eprint 1201.2423.
- (20) W. Vogelsang, private communication.
- PHENIX (2010) PHENIX (2010), URL {http://www.phenix.bnl.gov/phenix/WWW/docs/decadal/2010/phenix_decadal10_full_refs.pdf}.
- Cacciari et al. (2008) M. Cacciari, G. Salam, and G. Soyez, JHEP 0804, 063 (2008), eprint 0802.1189.
- Cacciari and Salam (2006) M. Cacciari and G. P. Salam, Phys.Lett. B641, 57 (2006), eprint hep-ph/0512210.
- Masera et al. (2009) M. Masera, G. Ortona, M. Poghosyan, and F. Prino, Phys. Rev. C79, 064909 (2009).
- Adare et al. (2011) A. Adare et al. (PHENIX Collaboration), Phys.Rev.Lett. 107, 252301 (2011), eprint 1105.3928.
- Sjostrand et al. (2001) T. Sjostrand et al., Comput. Phys. Commun. 135, 238 (2001), eprint hep-ph/0010017.