Sizes, Half-Mass Densities, and Mass Functions of Star Clusters in the Merger Remnant NGC 1316: Clues to the Fate of Second-Generation Globular Clusters11affiliation: Based on observations with the NASA/ESA Hubble Space Telescope, obtained at the Space Telescope Science Institute, which is operated by the Association of Universities for Research in Astronomy, Inc., under NASA contract NAS5-26555
Abstract
We study mass functions of globular clusters derived from HST/ACS images of the early-type merger remnant galaxy NGC 1316 which hosts a significant population of metal-rich globular clusters of intermediate age ( 3 Gyr). For the old, metal-poor (‘blue’) clusters, the peak mass of the mass function increases with internal half-mass density as whereas it stays approximately constant with galactocentric distance . The mass functions of these clusters are consistent with a simple scenario in which they formed with a Schechter initial mass function and evolved subsequently by internal two-body relaxation. For the intermediate-age population of metal-rich (‘red’) clusters, the faint end of the previously reported power-law luminosity function of the clusters with kpc is due to many of those clusters having radii larger than the theoretical maximum value imposed by the tidal field of NGC 1316 at their . This renders disruption by two-body relaxation ineffective. Only a few such diffuse clusters are found in the inner regions of NGC 1316. Completeness tests indicate that this is a physical effect. Using comparisons with star clusters in other galaxies and cluster disruption calculations using published models, we hypothesize that most red clusters in the low- tail of the initial distribution have already been destroyed in the inner regions of NGC 1316 by tidal shocking, and that several remaining low- clusters will evolve dynamically to become similar to ‘faint fuzzies’ that exist in several lenticular galaxies. Finally, we discuss the nature of diffuse red clusters in early-type galaxies.
Subject headings:
galaxies: star clusters — globular clusters: general — galaxies: individual (NGC 1316) — galaxies: interactions1. Introduction
Globular star clusters (GCs) have long been recognized as important laboratories in the study of the formation and evolution of galaxies for a variety of reasons. Studies of star formation within molecular clouds using infrared observations have shown that most, if not all, stars form in clusters with initial masses in the range M⊙ (e.g., Lada & Lada, 2003; Portegies Zwart et al., 2010, and references therein). While most star clusters with M⊙ are thought to disperse into the field population of galaxies within a few Gyr by a variety of disruption processes, the surviving massive GCs constitute luminous compact sources that can be easily observed out to distances of several tens of megaparsecs. Furthermore, star clusters represent very good approximations of a “simple stellar population” (hereafter SSP), i.e., a coeval population of stars with a single metallicity, whereas the diffuse light of galaxies is typically composed of a mixture of populations. Thus, star clusters represent invaluable probes of the SFR and chemical enrichment occurring during the main star formation epochs within a galaxy’s assembly history.
As to the class of “normal” giant early-type galaxies (E and S0 galaxies, i.e., galaxies whose light is dominated by a “bulge” component), deep imaging studies with the Hubble Space Telescope (HST) revealed that such galaxies typically contain rich GC systems with bimodal color distributions (Kundu & Whitmore, 2001; Larsen et al., 2001; Peng et al., 2006a). Follow-up spectroscopy with 8-m class telescopes showed that both “blue” and “red” GC subpopulations are nearly universally old, with ages 8 Gyr (e.g. Forbes et al., 2001; Puzia et al., 2005, 2006; Woodley et al., 2009), similar to the case of GCs in our Galaxy (Marín-Franch et al., 2009). This implies that the color bimodality is due mainly to differences in metallicity. The colors and spatial distribution of the blue GCs are usually consistent with those of metal-poor halo GCs in our Galaxy and M31, while red GCs have colors and spatial distributions that are similar to those of the “bulge” light of their host galaxies (Geisler et al., 1996; Forbes et al., 1997; Rhode & Zepf, 2001; Goudfrooij et al., 2001b; Jordán et al., 2004; Peng et al., 2006a; Goudfrooij et al., 2007). Thus, the nature of the red metal-rich GCs is likely to hold important clues to the star formation history of their host galaxies.
The star formation activity associated with the formation of the bulge component of giant early-type galaxies is generally thought to be dominated by vigorous starbursts triggered by mergers and interactions of gas-rich galaxies (e.g., White & Frenk, 1991; Baugh et al., 1996; Mihos & Hernquist, 1996; Cole et al., 2000; Somerville et al., 2001). Indeed, deep images taken with the HST have shown that nearby galaxy mergers and young merger remnant galaxies host very rich populations of young star clusters with masses reaching 107 M⊙ and beyond (e.g., Holtzman et al., 1992; Schweizer et al., 1996; Miller et al., 1997; Whitmore et al., 2010). The ages and masses of these young clusters predicted from their colors and luminosities were confirmed by spectroscopy (Zepf et al., 1995; Schweizer & Seitzer, 1998; Maraston et al., 2004; Bastian et al., 2006). Their metallicities tend to be near-solar, as expected for clusters formed out of enriched gas in spiral galaxies. As to the question whether or not these young metal-rich GC populations can survive several Gyr of stellar and/or dynamical evolution (this was brought up by Brodie et al., 1998), studies of GCs in early-type merger remnants of intermediate age (2 – 4 Gyr) have shown that such metal-rich GC populations do survive at least that long with relatively minor changes in their mass function down to the detection limit (Goudfrooij et al., 2001a, b; Whitmore et al., 2002; Goudfrooij et al., 2004, 2007). It seems natural to interpret these data in the sense that the bulges of normal giant early-type galaxies and their metal-rich GCs formed at high redshift in a way similar to that observed in gas-rich galaxy mergers today, as originally predicted by Schweizer (1987) and Ashman & Zepf (1992).
A significant difference between young GC systems in mergers and ancient GC systems is the shape of their respective luminosity functions (LFs). Young GC systems in mergers and young merger remnants have LFs consistent with power laws: with (e.g., Schweizer et al., 1996; Miller et al., 1997; Zepf et al., 1999; Zhang & Fall, 1999; Fall et al., 2009), without a sign of a peak or “turnover” down to the detection limit of the data. Perhaps not surprisingly, this distribution is consistent with the mass function of giant molecular clouds in star forming regions in our Galaxy (Elmegreen & Efremov, 1997). In contrast, the LFs of GC systems in “normal” galaxies are well described by Gaussians in magnitude space (or lognormal luminosity distributions), peaking at mag (e.g., Harris, 2001; Jordán et al., 2007), corresponding roughly to a “turnover” mass M⊙. If one accepts the view that ancient GCs in normal galaxies formed in the early universe through essentially the same processes as star clusters in galaxy mergers today, then large numbers of low-mass clusters must have been destroyed or disrupted in the mean time. Recent studies of dynamical evolution of GCs through mechanisms acting on long time scales (notably two-body relaxation and tidal shocking) have shown that low-mass clusters disrupt first as galaxies age, which can evolve a power-law mass function into lognormal mass functions in a few Gyr (e.g., Fall & Rees 1977; Fall & Zhang 2001; Prieto & Gnedin 2008, but see Vesperini 2001). However, there is some debate as to the impact of the tidal field of the host galaxy on the way GC mass functions (GCMFs) are shaped over time. One school of thought is that long-term cluster disruption is dominated by internal two-body relaxation which is essentially independent of the tidal field of the galaxy. This view is supported by properties of the GCMFs of the Milky Way and the Sombrero galaxy (Chandar et al., 2007; McLaughlin & Fall, 2008). Another view is that the strength of the tidal field must be a significant factor in terms of the impact of two-body relaxation (e.g. Baumgardt & Makino, 2003; Gieles & Baumgardt, 2008; Baumgardt et al., 2008). This in turn seems to be supported by the finding that the turnover luminosity of GCLFs of early-type galaxies decreases with decreasing galaxy luminosity (Jordán et al., 2007). Studies of GC systems of intermediate-age (1 – 5 Gyr old) merger remnants can help clarify the relative importance of different dynamical effects on GC systems formed during galaxy interactions.
Several studies have established firmly that the giant galaxy NGC 1316 (= Fornax A = Arp 154), the dominant galaxy of a subgroup of the Fornax cluster of galaxies, is a bona fide intermediate-age merger remnant. Its outer envelope includes several nonconcentric arcs, tails, and loops that are most likely remnants of tidal perturbations, while the inner part of the spheroid is characterized by a surprisingly high central surface brightness and small effective radius for the galaxy’s luminosity (Schweizer, 1980, 1981; Caon et al., 1994). All of these features indicate that NGC 1316 is the product of a dissipative merger with incomplete dynamical relaxation. Goudfrooij et al. (2001a, b) discovered a significant population of 3-Gyr-old GCs of near-solar metallicity through a comparison of BVIJHK colors as well as H and Ca ii triplet line strengths with SSP model predictions. It is classified as a lenticular galaxy in galaxy catalogs: (R′)SAB(s)0 in the RC3 catalog (de Vaucouleurs et al., 1991) and S01pec in the RSA catalog (Sandage & Tammann, 1987), and its stellar body is rotationally supported (e.g., Arnaboldi et al., 1998). In accordance with our earlier work, we adopt a distance of 22.9 Mpc for NGC 1316 in this paper. This distance was derived using known tight relations between the light curve shape, luminosity, and color of type Ia supernovae in NGC 1316 (see Goudfrooij et al., 2001b, and references therein).
In a previous paper (Goudfrooij et al., 2004), we used deep photometry taken with the Advanced Camera for Surveys (ACS) aboard HST and showed that the inner 50% of the system of intermediate-age GCs of NGC 1316 showed evidence of the presence of a turnover in its LF, while the GCLF of the outer 50% was still consistent with a power-law down to the detection limit. While this provided evidence that long-term dynamical evolution of GCs formed in mergers of massive gas-rich galaxies can indeed transform MFs of “young” clusters to MFs of ancient GC systems, it did not clarify the fate of the clusters in the outer regions of NGC 1316. A specific issue in that regard is that GCLFs and GCMFs in the outskirts of “normal” galaxies typically show very similar shapes and turnovers to those in their inner regions, and the question is whether and how dynamical evolution of the GCs in the outskirts of NGC 1316 may create a mass function similar to those seen in “normal” giant early-type galaxies over the next 10 Gyr. Using new GC size measurements, this issue is one of the main topics being addressed in the current paper.
The remainder of this paper is organized as follows. After a brief description of the imaging data in Section 2, the data analysis is presented in Section 3. Section 4 describes relations between radii and other properties of the blue and red GC subpopulations in NGC 1316 and presents their mass functions as functions of mass density and galactocentric radius. In Section 5, we apply various dynamical evolution model calculations to the red, intermediate-age clusters and evaluate the properties of their resulting mass functions and their distribution in the mass-radius plane. A summary and discussion of the results, including the large number of diffuse red clusters in NGC 1316, is provided in Section 6.
2. Data
We use the HST/ACS imaging dataset described previously in Goudfrooij et al. (2004). Briefly, this consists of several wide-field channel (WFC) images taken with the F435W, F555W, and F814W filters with total exposure times of 1860 s, 6980 s, and 4860 s, respectively. The sample of star cluster candidates in NGC 1316 and its subdivision in “old, metal-poor” (“blue”) versus “intermediate-age, metal-rich” (“red”) clusters was adopted from Goudfrooij et al. (2004). For purposes of dynamical evolution calculations, we assume throughout this paper that the system of “red” GCs in NGC 1316 is dominated by GCs of an age of 3 Gyr, which is the age found for the brightest red GCs using spectroscopy and multi-color photometry (Goudfrooij et al., 2001a, b). While it is possible that (one of) the progenitor galaxies possessed older metal-rich GCs that were “donated” to NGC 1316 during the merger, the LF of the red GCs does not show any sign of the presence of a significant number of “old” GCs such as a turnover near mag (see Goudfrooij et al., 2004). Instead, the LF of the red GCs continues to rise to the completeness limit of the data similar to the situation in other merger remnants. Hence we deem it unlikely that NGC 1316 hosts significant numbers of old red GCs formerly associated with merger progenitor galaxies. However, the impact of the presence of a small fraction of old metal-rich GCs to the results shown in this paper will be discussed where relevant.
3. Analysis
3.1. Size Measurements
GC structural parameters were derived using the ishape algorithm (Larsen, 1999), which fits the object’s surface brightness profile with analytical models convolved with a subsampled PSF. Since GCs at the distance of NGC 1316 are only marginally resolved, reliable size measurements require a very good knowledge of the ACS PSF at the time of observation. While many studies build empirical PSFs from several well-exposed stars in the field of view for this purpose, the ACS images of NGC 1316 do not contain enough such stars to create a robust set of PSFs. Hence we have to rely on external PSF libraries. To test the influence of the PSF library chosen, we performed a comparison between values measured using PSFs created by means of two methods: (i) the TinyTim package (Krist & Hook, 2004) which takes into account the field-dependent aberration of the ACS/WFC camera, filter passband effects, charge diffusion variations, and varying pixel area due to the significant field distortion in the ACS/WFC field of view. The ten times subsampled Tiny Tim PSF was evaluated at the position of each point-like object in the image and convolved with the charge diffusion kernel. (ii) the empirical grid of ACS PSFs of Anderson & King (2006). Since the latter PSFs are created for individual ACS *_flt.fits images rather than images combined with multidrizzle, we used Maurizio Paolillo’s Multiking suite of scripts (which we modified to work on filters other than F606W) to create a grid of empirical PSFs at the location of each GC candidate in blank versions of each individual input _flt.fits ACS image. These images were then combined by MultiDrizzle in the exact same way as the final NGC 1316 image. These PSFs were then subsampled by a factor 10 in order for them to be used appropriately within ishape, using polynomial interpolation. We refer to these PSFs as ePSFs in the following discussion. These two sets of PSFs were then used within ishape to fit the objects’ profiles with King (1962) model concentration parameters (where is the tidal radius and is the core radius) of 5, 15, 30, and 100. GC structural parameters were calculated using the value that yielded the lowest .
The effect of the fitting radius (parameter fitrad within ishape) on the derived cluster radii was assessed by using values of 4, 6, 10, and 15 pixels. While larger values of fitrad are in principle preferable over smaller ones (especially for more extended sources), we found that the associated increase in fitting uncertainties for fainter sources renders this advantage negligible. Similar to Carlson & Holtzman (2001), we find that fitrad 6 pixels yield consistent values within the uncertainties, even for the largest GCs found in this study (which are mainly the fainter ones, see Sect. 4.2 and beyond). Hence we adopt fitrad = 6 pixels for this study. GC half-light radii were derived from the geometric mean of the FWHM values measured along the semi-major and semi-minor axes. The measured values of were multiplied by a factor 4/3 to account for projection effects (Spitzer, 1987). In order to render correct values of signal-to-noise ratio (S/N) for the fits, we added the local background level back into the model-subtracted image (using the mknoise task within IRAF) for each object prior to running ishape on it. Objects fit by ishape with S/N were considered for the remaining analysis. Several studies found this S/N constraint sufficient to yield reliable half-light radii when using methods such as ishape (e.g., Larsen, 1999; Harris, 2009; T. H. Puzia et al., 2012, in preparation)111 We note that a much higher value of S/N is required to determine King model concentration indices robustly for marginally resolved objects (S/N , see Carlson & Holtzman, 2001). Hence, the best-fit values of determined here for each GC should typically be regarded as estimates..
To test for systematic differences between sizes measured in the F555W and F814W images, we plot the ratio versus in Figure 1 for all clusters measured with S/N in both passbands. Weighting by inverse variance, the weighted mean value . We thus assume that there is no significant systematic difference between sizes measured in F555W versus F814W for this dataset. In the following, we concentrate on sizes measured in the F555W image because (i) the F555W image reaches the highest S/N ratio for cluster candidates in the color parameter space of interest and (ii) F555W images were taken using the highest number of distinct spatial offsets (6 “dithers”) between individual images which renders the highest spatial resolution after image combination using the multidrizzle task available within PyRAF/STSDAS. The constraint of S/N in the F555W image yielded a total of 424 GCs, 212 of which are “red” and 212 are “blue”. Fig. 2 depicts a comparison between the values derived from the best-fit TinyTim PSFs and those derived from the ePSFs. The values derived from the ePSFs are systematically smaller than those derived from the TinyTim PSFs by pixel. Effects of this order of magnitude (differences of 0.4 – 0.5 pixel) were also seen in previous studies using HST/ACS images that compared GC sizes derived with TinyTim PSFs versus empirical PSFs (e.g., Spitler et al., 2006; Georgiev et al., 2009). This discrepancy is likely due to effects that are not incorporated in TinyTim such as telescope focus changes among and during HST orbits (“breathing”) as well as slight broadening of the effective PSF due to the effect of image combination. With this in mind, we adopt the structural parameters of GCs measured using the ePSFs.


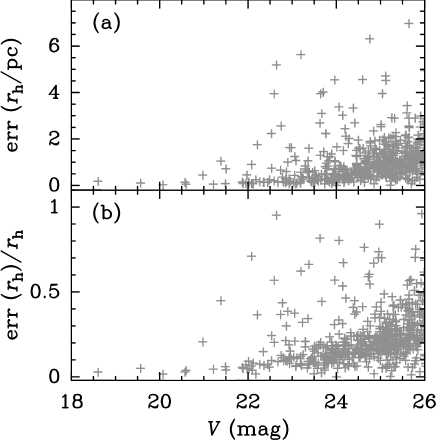
Finally, Figure 3 depicts the formal standard deviation of as a function of magnitude calculated from the ishape output, both in an absolute sense and relative to the values of . Standard deviations were calculated using ishape parameter correrr = yes, meaning that correlated errors between different ishape parameters were taken into account. Table 1 lists magnitudes, colors, values, and values for all GC candidates used in this paper.
| ID | ID2001b | RA | DEC | ||||
|---|---|---|---|---|---|---|---|
| (1) | (2) | (3) | (4) | (5) | (6) | (7) | (8) |
| 1 | 114 | 50.6770102 | 37.2111334 | 18.607 0.002 | 1.093 0.002 | 6.23 0.18 | 30 |
| 2 | 50.6781450 | 37.2045648 | 19.570 0.002 | 1.013 0.002 | 2.03 0.10 | 30 | |
| 3 | 210 | 50.6585913 | 37.2186257 | 20.078 0.002 | 1.003 0.002 | 1.70 0.03 | 30 |
| 4 | 110 | 50.6522255 | 37.1822058 | 20.578 0.004 | 1.044 0.006 | 4.74 0.14 | 30 |
| 5 | 50.6923963 | 37.2013999 | 20.601 0.004 | 1.055 0.006 | 1.40 0.05 | 30 |
3.2. Impact of Varying Cluster Size to Observables
3.2.1 Aperture Corrections
The effect of varying GC sizes to photometric aperture corrections at the distance of NGC 1316 was determined by using the Multiking package (see § 3.1 above) to create a grid of ePSF-convolved King (1962) models located uniformly throughout the ACS/WFC field of view for all three ACS/WFC filters used in this dataset. In this regard we used values of 0, 1, 2, 3, 5, 7, 10, 15, and 20 pc and King concentration parameters = 5, 15, 30, and 100. Aperture corrections were calculated from an aperture radius of 3 pixels (as used by Goudfrooij et al. 2004 for example) to 50 pixels. We found that the effect of varying to these aperture corrections at a given was negligible relative to the effect of varying itself. The aperture corrections for the various values are plotted in Fig. 4. Note that the total intensities of the ePSF’s are normalized to unity within a radius of 10 ACS/WFC pixels (Anderson & King, 2006). Hence, the aperture correction values from a radius of 10 pixels to infinity listed by Sirianni et al. (2005) were added to the measured values to arrive at the “final” aperture correction values plotted in Fig. 4. Aperture corrections for all clusters were applied by means of 5th-order polynomial least-square fits of aperture correction versus . These fits are shown in Fig. 4 as dashed lines.
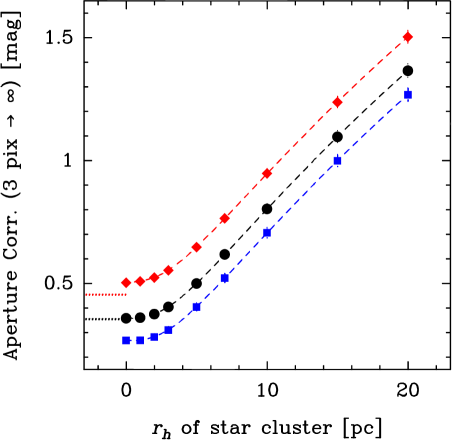
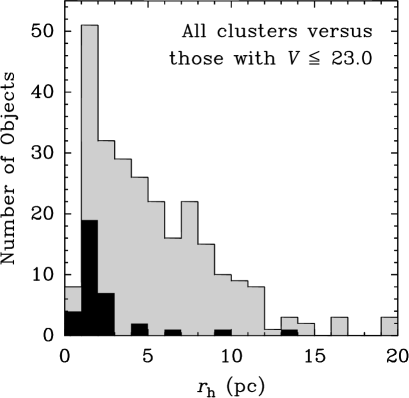
Note the significant increase of aperture correction values for clusters with pc, which has a relevant impact on such clusters’ derived luminosities and masses when compared with “average-sized” clusters which have . This turns out to have a significant impact for the case of NGC 1316: The clusters used by Goudfrooij et al. (2004) to calculate aperture corrections were the 35 brightest clusters (with mag). While those clusters obviously render the highest-quality aperture corrections as intended, it turns out that their distribution is not representative for the cluster system as a whole. This is illustrated in Fig. 5: Clusters with pc are quite common among the cluster system as a whole (see also Masters et al., 2010) whereas they happen to be strongly underrepresented among clusters with mag. Obviously, the measurement of half-light radii can be very important in photometry studies of star clusters that are marginally resolved (see also Kundu, 2008).
3.2.2 Completeness Corrections
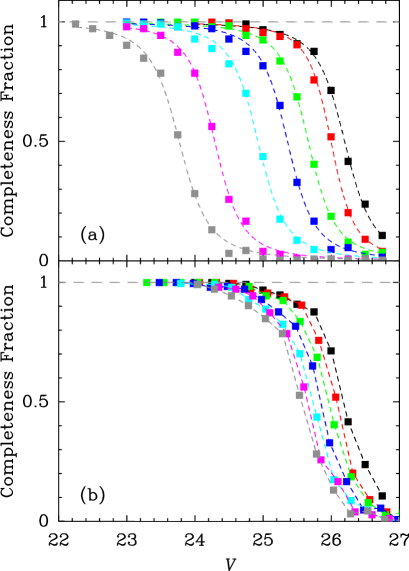
Given the varying cluster sizes and their possible systematics with galactocentric distance, we investigated the influence of varying cluster sizes to completeness corrections by repeating the artificial object tests done in Goudfrooij et al. (2004), but now using the Multiking package to add simulated GCs with = 1, 2, 3, 5, 7, 10, 15, and 20 pc and to the final NGC 1316 images in the F555W and F814W filters. The background levels and (total) magnitude intervals employed for the completeness tests were identical to those used in Goudfrooij et al. (2004), as were the parameters used for the daofind task within IRAF. The resulting completeness functions and their dependence on GC size are illustrated in Fig. 6 for a typical background level of 200 e-/pix per individual 1100 s exposure.
Completeness values were parameterized by fitting the measured completeness fractions by the following function:
| (1) |
where is the 50% completeness limit in and the parameter is a measure of the steepness of the completeness function near . Panel (a) of Fig. 6 depicts the curves that were fit to the simulated data of the various values mentioned above, using a least-squares fitting routine to determine and . These fits were performed for 5 background levels encompassing the observed values, equally spaced in log (background). Completeness fractions of all individual clusters were then determined from their magnitudes, background levels, and values. Values for and in the function were determined by means of bilinear interpolation in log (background) versus log () parameter space.
As shown by panel (a) of Fig. 6, the dependence of the completeness fraction on half-light radius is significant. In quantitative terms, ranges from 26.2 for = 2 pc to 23.8 for = 20 pc, roughly by 2.4 mag per dex in . However, when comparing this result to the completeness values used in Goudfrooij et al. (2004), one should keep in mind that Goudfrooij et al. (2004) used a cluster profile based on the brightest 35 clusters for their artificial objects. That cluster profile had a pc (see Fig. 5). Since the brightness of artificial objects is scaled by their total (integrated) magnitude prior to being inserted in an image while the photometric measurements are done with an aperture radius of 3 pixels (both here and in Goudfrooij et al. 2004), a proper comparison between the completeness values determined in this paper versus those in Goudfrooij et al. (2004) should take the aperture corrections for clusters of different sizes into account. Hence we shift the magnitudes in panel (a) of Fig. 6 by the size-dependent aperture correction values shown in Fig. 4, relative to those appropriate for = 2 pc. The result is shown in panel (b) of Fig. 6. Note that the “net” size dependence of completeness values is much reduced relative to the results shown in panel (a): effectively changes by only 0.6 mag per dex in .
3.3. Contamination by Background Galaxies
Contamination by compact background galaxies is always a potentially critical issue in extragalactic star cluster studies. To address this, we select images from 4 blank, high-latitude control fields that used ACS/WFC over the course of 3 HST orbits ( 2.3 hours) with the F555W and F814W filters from the HST archive. These observations were taken as parallel images in HST Program GO-11691, and are well suited to the purpose of probing the background contamination in our cluster sample. Each of these sets of images were then run through the same image combination, object detection and selection, and aperture photometry procedures as those employed by Goudfrooij et al. (2004) for the NGC 1316 images, with one exception. Since none of these control fields included large foreground galaxies, the compact-source photometry in these control fields goes deeper than in the NGC 1316 images. Hence we performed the detection of cluster candidates as if NGC 1316 were included in each blank field. To this end, we used the “model” images generated during the object detection procedure for the NGC 1316 images (see Goudfrooij et al., 2004) from which we calculated images representing the Poisson noise associated with the diffuse light of NGC 1316, using the mknoise program within IRAF. The latter noise images were added to the blank fields (after scaling by the square root of the exposure times) prior to running the detection procedure.
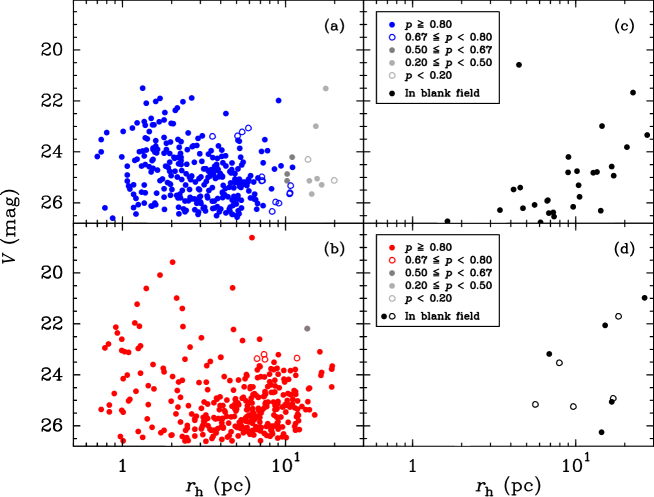
The level of background contamination of the “blue” and “red” cluster subsamples is illustrated in Figure 7 which shows size-magnitude diagrams for the data and control fields. The top panels show “blue” candidate clusters while the bottom panels show “red” candidate clusters. The control field photometry tables have been randomly sampled so as to only plot 1/4 of the objects found in the 4 blank fields. Typically, the relatively small number of “cluster candidates” found in the control fields (which are most likely background galaxies) are fainter and more extended than the (far more numerous) cluster candidates in the NGC 1316 images.
To evaluate the probability that a given cluster candidate in the NGC 1316 images is physically associated with NGC 1316, we apply a two-dimensional Gaussian smoothing kernel to the data in log () versus parameter space to produce density distributions of the numbers of cluster candidates and contaminants per unit area using the kde2d algorithm (Venables & Ripley, 2002). Probability values for cluster candidates being physically associated with NGC 1316 are then calculated from the ratio where and are the two-dimensional density distributions of cluster candidates in NGC 1316 and in the blank fields, respectively. For the remainder of this paper, we define “clusters” as objects with , i.e., objects with .
4. Size Demography of the Cluster Subpopulations
In this Section we illustrate the size-related properties of the metal-poor (blue) and metal-rich (red) cluster subpopulations in NGC 1316 and attempt to put them in context by comparing them to clusters in our Galaxy, younger merger remnant galaxies, and “normal”, old giant early-type galaxies.
4.1. Dependence on Galactocentric Radius
The top and middle panels of Fig. 8 plot versus projected galactocentric radius for blue and red clusters in NGC 1316. To avoid biases related to varying incompleteness as functions of and , only clusters brighter than mag are considered (cf. panel b of Fig. 6). In panel (b) of Fig. 8 we plot running medians of the distribution as function on . As can be seen, median sizes of the blue GCs are 2.5 – 3.5 pc with only a slight dependence on . This is similar to the situation seen for metal-poor GCs in “normal” early-type galaxies (e.g., Spitler et al., 2006; Harris, 2009; Madrid et al., 2009). However, the situation for the red GCs in NGC 1316 is markedly different from that in “normal” ellipticals. In NGC 1316, the red GCs within 5 kpc from the galaxy center have sizes similar to those of the blue GCs. Outside = 5 kpc however, the median size of the red GCs increases steadily with increasing galactocentric radius, reaching pc at 12 kpc. In stark contrast, sizes of red GCs in “normal” ellipticals are typically 20% smaller than blue GCs (e.g., Kundu & Whitmore, 1998; Puzia et al., 1999; Jordán et al., 2005; Masters et al., 2010). The size ratio of blue versus red GCs in “normal” ellipticals does not change significantly with (Paolillo et al., 2011; T. H. Puzia et al., 2012, in preparation).
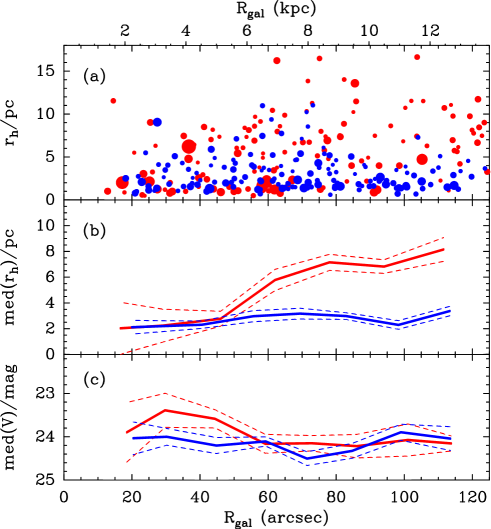
To put this result in context, recall that the bulk of red GCs in NGC 1316 most likely represent an intermediate-age population (age 3 Gyr, cf. Goudfrooij et al., 2001a, b; Bastian et al., 2006). Assuming that to be the case, long-term cluster disruption mechanisms such as two-body relaxation and tidal shocks will have been active for much (some 7 – 10 Gyr) less long than for “old” red GCs in “normal” ellipticals. In particular, late-epoch cluster contraction due to accumulative effects of two-body relaxation (e.g., Mackey et al., 2008; Heggie & Giersz, 2008; Vesperini et al., 2009) will not yet have taken place. As such, one might expect the size demography of the red GCs in NGC 1316 to bear similarities to that of younger cluster systems in otherwise similar environments. While size measurements of young GCs in massive merger remnant galaxies are still quite sparse in the literature, the available data do show strong similarities to the red GCs in NGC 1316. Trancho et al. (2007) measured half-light radii of 10 – 20 pc for young GCs in the outskirts of NGC 3256, a remnant of a recent galaxy merger which Toomre (1977) placed in the middle of his sequence of disk galaxy merger remnants. These clusters in NGC 3256 have estimated ages of Myr (see also Zepf et al., 1999), and hence they have likely already undergone the cluster expansion driven by strong mass loss due to supernova type II explosions as well as stellar evolution in the first few 107 yr (Baumgardt et al., 2008; Vesperini et al., 2009), which renders them an appropriate comparison with the intermediate-age red GCs in NGC 1316. Other young cluster systems in merger remnants with accurate size measurements also have size distributions similar to that of the red GCs in NGC 1316, cf. the 300 – 700 Myr old clusters in NGC 1275 and NGC 3597 (Carlson & Holtzman, 2001), with mean values of 6.2 and 5.4 pc, respectively, and a set of 8 clusters covering the age range in the Antennae galaxies, with a mean of 8.0 pc (Bastian et al., 2009). In conclusion, the relatively large sizes seen among the red GCs in NGC 1316 seem consistent with them being intermediate-age counterparts of metal-rich clusters seen in younger merger remnants. The observed increase of the median of the red GCs with increasing will be discussed below in Sect. 5.
4.2. Luminosity-Radius Relation
Panels (a) and (b) of Fig. 9 plot versus for the same clusters as those shown in Fig. 8. With regard to the blue (metal-poor) GCs, previous studies of sizes of GCs in galaxies found no significant relation between and luminosity down to the turnover of the GC luminosity function (e.g., McLaughlin, 2000; Jordán et al., 2005). Our results for the blue GCs are consistent with this. However, our dataset yielded robust values for GCs fainter than the turnover luminosity for old, metal-poor GCs (; see Fig. 9) where we find evidence for an increase of the (median) size of blue GCs with decreasing luminosity. Panel (c) of Fig. 9 shows that this increase is not due to the increase of with increasing for kpc for blue GCs shown in Fig. 8. Instead, we interpret this effect as being due to dynamical evolution within GCs, i.e. the mass density dependence of cluster evaporation due to two-body relaxation, as discussed further in Sect. 4.3 below.
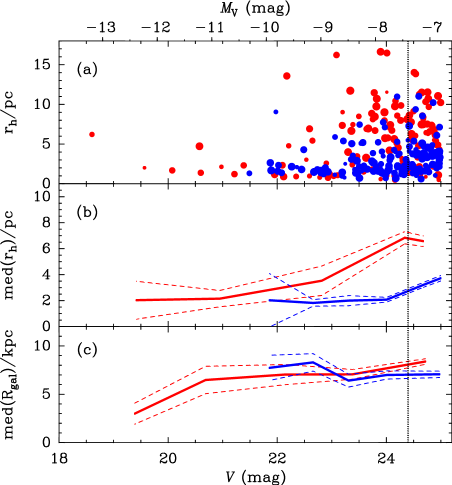
As to the red (metal-rich) GCs, panel (b) of Fig. 9 shows an obvious increase of with decreasing luminosity. However, before trying to interpret this relation in terms of physical effects, we point out that it is likely associated with the correlation between and shown in panel (b) of Fig. 8. This is illustrated by panel (c) of Fig. 9 which shows that the median also increases significantly with decreasing luminosity. Note that for GCs with mag, the median is in the range where the rate of increase of with increasing is significant (see panel (b) of Fig. 8). These relations are interpreted in terms of dynamical evolution processes in the next Section.
4.3. Cluster Distribution in the ‘Survival Diagram’
The versus cluster mass diagram is a useful tool to illustrate the ‘survivability’ of star clusters to various internal and external dissolution mechanisms (e.g. Fall & Rees, 1977; Gnedin & Ostriker, 1997; Georgiev et al., 2009). Fig. 10 shows the distribution of GCs in NGC 1316 with size measurements in this ‘survival diagram’, separately for blue and red GCs in panels (a) and (b). For comparison purposes, we include the same diagram for the Galactic GCs in panel (c). To convert luminosities of GCs in NGC 1316 into masses, we adopt values of the SSP synthesis models of Bruzual & Charlot (2003), using a Chabrier (2003) initial mass function (IMF)222Use of the Maraston (2005) SSP models with a Kroupa (2001) IMF yields values that are 5% higher; applying the Salpeter (1955) IMF yields values higher by 75% relative to Chabrier or Kroupa IMFs.. We adopt age = 3 Gyr and [Z/H] = 0.0 for the red GCs (Goudfrooij et al., 2001a, b) and age = 13 Gyr and [Z/H] = 1.6 for the blue GCs, similar to the average properties of metal-poor GCs in our Galaxy (e.g. Harris, 1996). For the Galactic GCs, half-light radii and cluster masses were taken from McLaughlin & van der Marel (2005) when available, and from Harris (1996) for the remainder. Symbol sizes scale with , as shown in the legend in the top right of the Figure.
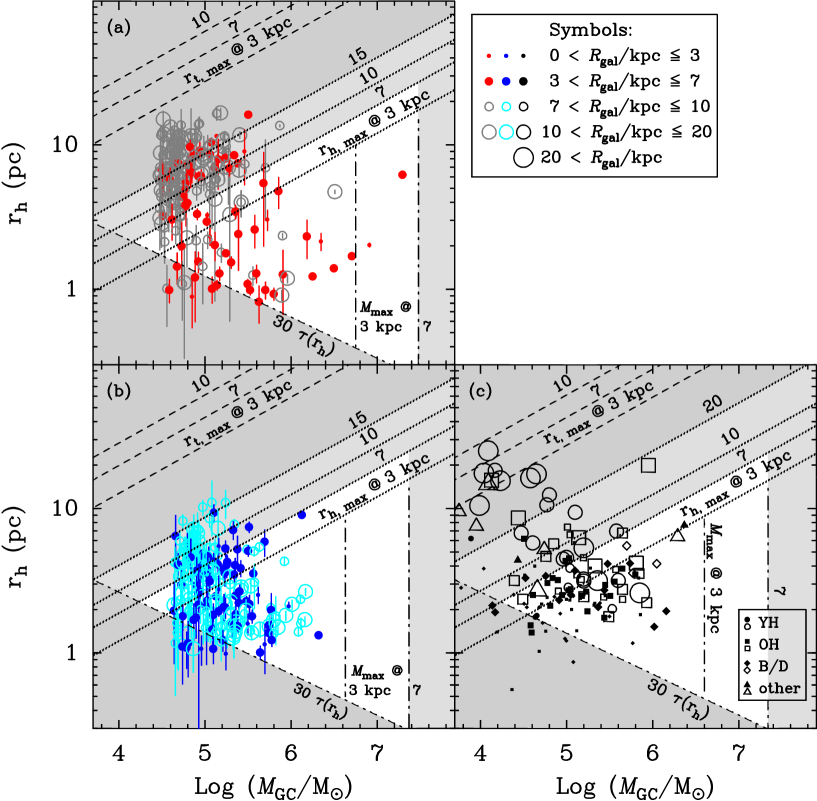
Fig. 10 includes various lines that depict limits in the mass-radius plane imposed by various dynamical evolution mechanisms. To indicate limits imposed by the tidal field of NGC 1316, we calculate maximum tidal cluster radii by using the tidal limit for a satellite on a circular orbit:
| (2) |
(e.g., Binney & Tremaine, 1987; Baumgardt & Makino, 2003) where is the circular velocity of the galaxy and is the galactocentric distance. For the latter, we multiply the observed (projected) galactocentric distances by a factor to account for an assumed viewing angle of 60∘. We use km s-1 for NGC 1316; this represents the rotation velocity and velocity dispersion values added in quadrature using velocities of planetary nebulae and GCs (Arnaboldi et al., 1998; Goudfrooij et al., 2001b). is shown in Fig. 10 by short-dashed lines for three values of : 3, 7, and 10 kpc. To translate values to observed half-light radii , we use the value of for King models with , i.e., 333This choice was made for this figure because provides the best fit for the majority of clusters in NGC 1316 and in our Galaxy. For reference, values for = 15 and 100 are 0.136 and 0.051, respectively.. Limits are drawn in Fig. 10 for = 3, 7, 10, and 15 kpc (for our Galaxy [i.e., panel c], the latter is 20 kpc), using dotted lines.
Dash-dotted lines represent limits imposed by cluster evaporation due to two-body relaxation:
| (3) |
for clusters of initial mass that survived a time after initial relaxation times; is the average stellar mass in a SSP of the appropriate age and metallicity, and is a correction constant taken from cluster simulations (Giersz & Heggie, 1996). GCs with initial will have dissolved after a time of dynamical evolution (e.g. Fall & Zhang, 2001). To facilitate the identification of red GCs in NGC 1316 that are likely to evaporate after 10 additional Gyr, we show for Gyr, (see Gnedin & Ostriker, 1997), and in panel (a) of Fig. 10. For panels (b) and (c) of Fig. 10 we use Gyr, , and , appropriate for 13 Gyr old populations with [Z/H] = 1.6. Note however that the GC masses plotted in Fig. 10 are current masses whereas in equation (3) refers to initial masses. I.e., one should take into account that GCs in panels (b) and (c) of Fig. 10 have already undergone some 13 Gyr of dynamical evolution when comparing the cluster data with the lines that indicate limits in the mass-radius plane.
Maximum values for cluster mass imposed by dynamical friction in the galaxy potential () are estimated by using equation [7-26] of Binney & Tremaine (1987):
| (4) |
where is the Coulomb logarithm, is the initial galactocentric distance, and is the velocity of the cluster with respect to the host galaxy. Values of the latter two parameters are estimated here by assuming and . Values for are calculated by solving equation (4) for using = 10 Gyr for the red GCs in NGC 1316, and = 13 Gyr for the blue GCs in NGC 1316 and the Galactic GCs.
Overall, the distribution of blue GCs in NGC 1316 in the mass-radius plane is very similar to that of (metal-poor) halo GCs in our Galaxy. This is encouraging, since blue GCs in galaxies are commonly thought to represent the counterpart of halo GCs in our Galaxy. Note that the tail of the distribution of Galactic GCs towards low masses and large values is not accessible in the NGC 1316 ACS data given its detection limit and limited radial coverage.
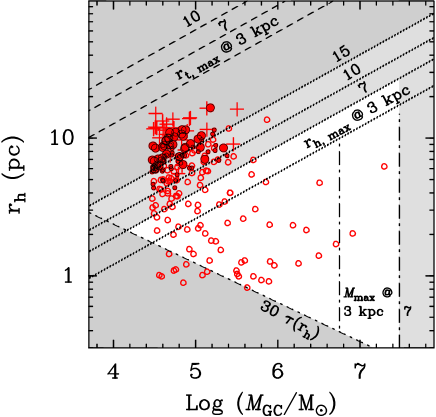
As to the distribution of red GCs in Fig. 10, it can be seen that the majority of the clusters are located in “healthy” regions for a 3-Gyr old population, taking their galactocentric radii into account. Furthermore, there are only a dozen or so GCs that are expected to evaporate completely in the next 10 Gyr due to two-body evaporation, and the effect of dynamical friction is expected to be negligible. However, several GCs in the top left region of panel (a) of Fig. 10 have values that are larger than the value for their . This is illustrated in Fig. 11 which shows the same diagram as panel (a) of Fig. 10 except that different symbols now indicate the value of the ratio . It seems likely that many of the red GCs with will experience significant mass loss during ten additional Gyr of tidal shocking. The impact of dynamical evolution mechanisms on the distribution of red GCs in the ‘survival diagram’ and their mass function will be discussed in Section 5.
4.4. Present-Day GC Mass Functions
Observations of young star clusters in merging galaxies and young merger remnants show that the number of clusters per unit mass are well described by a power law, with (e.g., Fall et al., 2009). In the case of ancient GCs in massive “normal” galaxies with hundreds or even thousands of GCs, the mass function decreases more rapidly than a power law for masses larger than M⊙ (see Burkert & Smith, 2000). A function that provides an accurate description of the shape of mass functions of young clusters as well as the 50% most massive GCs in ancient galaxies is the Schechter (1976) function, , with power-law component and exponential cutoff above some large mass that might vary among galaxies (e.g., Burkert & Smith, 2000; Gieles et al., 2006; Jordán et al., 2007, and references therein). This apparent connection between the GC mass function at high masses and that of young clusters and molecular clouds has been explained by theoretical models (McLaughlin & Pudritz, 1996; Elmegreen & Efremov, 1997). The main difference between the mass functions of ancient GCs and young clusters is the fact that the number of clusters per unit mass interval continues to rise like a power law towards the detection limit for young clusters, while it stays approximately constant among ancient GCs fainter than the classic peak magnitude of the GC luminosity function. The latter behavior is a signature of long-term dynamical evolution driven by two-body relaxation (Fall & Zhang, 2001; Jordán et al., 2007).
Another signature of relaxation-driven dynamical evolution is that the evaporation time scale scales with cluster mass as , where is the mean density inside the cluster’s half-mass radius. Under the common assumption that star clusters conserve their mean half-mass density while their dynamical evolution is dominated by evaporation (e.g., Vesperini, 2000, 2001; Fall & Zhang, 2001), this means that the peak mass of the mass function of ancient cluster systems would scale with as . McLaughlin & Fall (2008, hereafter MF08) found roughly this dependence of on among the old GCs in our Galaxy and argued that this presents evidence for a scenario that dynamical evolution shaped the mass function of ancient GC systems and that the dynamical evolution is dominated by two-body relaxation (see also Chandar et al., 2007, showing similar results for the Sombrero galaxy).
In the context of these recent studies, we reanalyze the mass functions of the blue and red GCs in NGC 1316 that have robust size measurements in the remainder of this Section. The completeness-corrected GC mass functions of the blue and red GCs with robust size measurements are shown in Figs. 12 and 13, respectively. The mass functions are shown in two bins of half-mass density in the left-hand panels, and two bins of projected galactocentric radius in the right-hand panels. We plot the mass functions as rather than so as to create a shape similar to the familiar GC luminosity functions.
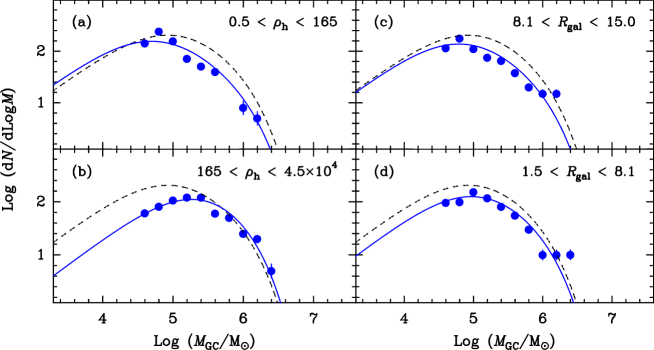
4.4.1 Mass Function of Blue GCs
The mass functions of the blue GCs in Fig. 12 show the familiar single-peaked “log-normal” shape of luminosity or mass functions of GCs in “normal” early-type galaxies, as expected for “ancient” GC systems (see, e.g., Jordán et al., 2007). Furthermore, Fig. 12 shows that the peak mass exhibits a clear dependence on , whereas it depends much less strongly on . This is consistent with the situation for cluster mass functions in our Galaxy and the Sombrero galaxy (Chandar et al. 2007; MF08).
To enable a systematic comparison between the different peak cluster masses for different ranges of and , we fit the data in Fig. 12 by a model mass function. For purposes of consistency with recent work on fitting mass functions of “old” star clusters (cf. above), we adopt a sum of so-called “evolved Schechter functions”:
| (5) |
(Jordán et al. 2007; Chandar et al. 2007; MF08) where is the cumulative mass loss of cluster , is the rate of evaporative mass loss by two-body relaxation, is the elapsed time (taken to be 13 Gyr in this case), is a normalization constant for each cluster, is the cutoff mass of the Schechter (1976) function, and the sum is over all clusters in the population. Following Chandar et al. (2007), we first fitted a model with a single term (the median value of ) in equation (5) to the mass functions for the full sample of 212 blue clusters to produce a “median” mass function which is depicted as the dashed curves in Fig. 12. After finding the best-fitting values for and , we determined the value of the normalization constant in . Next, we fitted models for the two bins in and the two bins in using separate terms for each cluster in equation (5), using the values for and derived above. These models are shown by solid curves in Fig. 12. The peak mass corresponding to the turnover magnitude of GC luminosity functions is found from the values of and by solving
| (6) |
for , to which the solution is
| (7) |
Resulting values for , and for each bin in and are listed in Table 2. It turns out that scales with as with . This is consistent with the predicted scaling for two-body relaxation, given the exponential cutoff of the Schechter function at .
4.4.2 Mass Function of Red GCs
Fig. 13 shows that the mass function of the red GCs in NGC 1316 has much in common with the power-law mass functions of young massive clusters. In fact, the mass function of the full sample of 212 red GCs is very well fit by a power law with , consistent with those found in younger merger remnants and starburst galaxies (e.g., Meurer et al., 1995; Fall et al., 2009). However, splitting the cluster system into two bins of and two bins of reveals more information about the dynamical state of the red GC system. Performing power-law fits to the mass function of the four cluster subsamples shows that the value of differs systematically between the subsamples in the sense that the slope is steepest for the lowest-density clusters and flattest for the highest-density clusters, with the two bins in showing intermediate values of . This suggests that evaporation by two-body relaxation has already had a measurable impact on the clusters’ dynamical evolution. The apparent flattening of the mass function at log in the high-density subsample (i.e., panel [b] of Fig. 13) indicates this as well. To check whether this flattening is at all consistent with the expected shape of the cluster mass function at an age of 3 Gyr due to two-body relaxation, we adopt the mass density-dependent mass loss rate found above for the full system of blue GCs in NGC 1316, i.e.,
| (8) |
(see values of and for all blue GCs in Table 2). Inserting equation (8) into equation (5) and assuming = 3 Gyr for the red clusters, we fit equation (5) to the two bins in and the two bins in , using separate terms for each individual cluster as done in the previous section. Resulting values for for each subsample are listed in Table 2, and the resulting mass function fits are shown in Fig. 13 as dashed curves. Note that the fitted mass functions are consistent with the data, including the apparent flattening of the mass function at log in the high-density subsample.
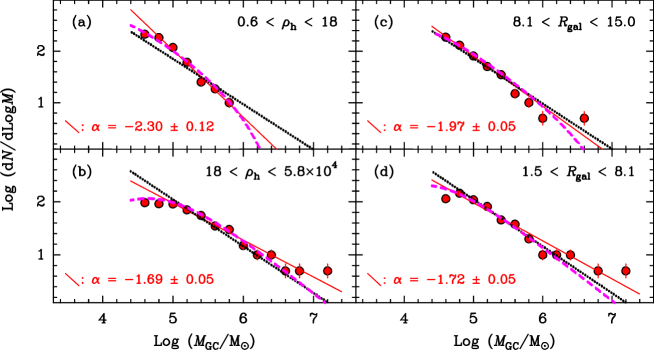
This result is consistent with our earlier claims in Goudfrooij et al. (2004), even though the latter study used incorrect aperture corrections for the large red clusters, which are mainly located in the outer regions. Furthermore, we can now quantify that the flattening of the mass function is stronger for clusters with high mass density than those with smaller galactocentric radii, as expected if two-body relaxation dominated the dynamical evolution (but see Section 5.2).
5. Dynamical Evolution of the Intermediate-Age Cluster Population
As mentioned in the Introduction, the population of red clusters in the 3-Gyr-old merger remnant NGC 1316 provides an important opportunity to test whether and how the power-law LFs seen in young merger remnant galaxies may evolve into the ubiquitous bell-shaped LFs of ancient GCs in “normal” galaxies. This topic is addressed in this Section by applying dynamical evolution model calculations from the recent literature to the observed current properties of the red clusters in NGC 1316. To compare the results with ancient GCs in “normal” galaxies, we let the red clusters evolve dynamically for another 10 Gyr. Mass loss by stellar evolution is also taken into account, using the BC03 SSP models at solar metallicity which yield a mass loss of 9% between ages of 3 and 13 Gyr.
5.1. Evaporation by Two-Body Relaxation
We use two independent models to evaluate the effect of evaporation by two-body relaxation to the red GCs in NGC 1316 over the next 10 Gyr.
(i) The McLaughlin & Fall (2008) model. We first use the aforementioned model of MF08 who argue that the change in shape of the globular cluster mass function (GCMF) from young to old systems is due mainly to evaporation by two-body relaxation (see also Fall & Zhang, 2001). Driven by their finding that the dependence of the peak mass of the Galactic GCMF on half-mass density is approximately , as predicted for evaporation by internal two-body relaxation, they suggest that evaporation by two-body relaxation is dominated by effects internal to the clusters and ignore the influence of the tidal field of the galaxy. We use equation (8) derived above for the blue GCs in NGC 1316 to estimate evaporation-driven mass loss for the red GCs according to the MF08 model. The resulting distribution of the surviving red GCs at an age of 13 Gyr in the mass-radius plane is shown in panel (b) of Fig. 14.
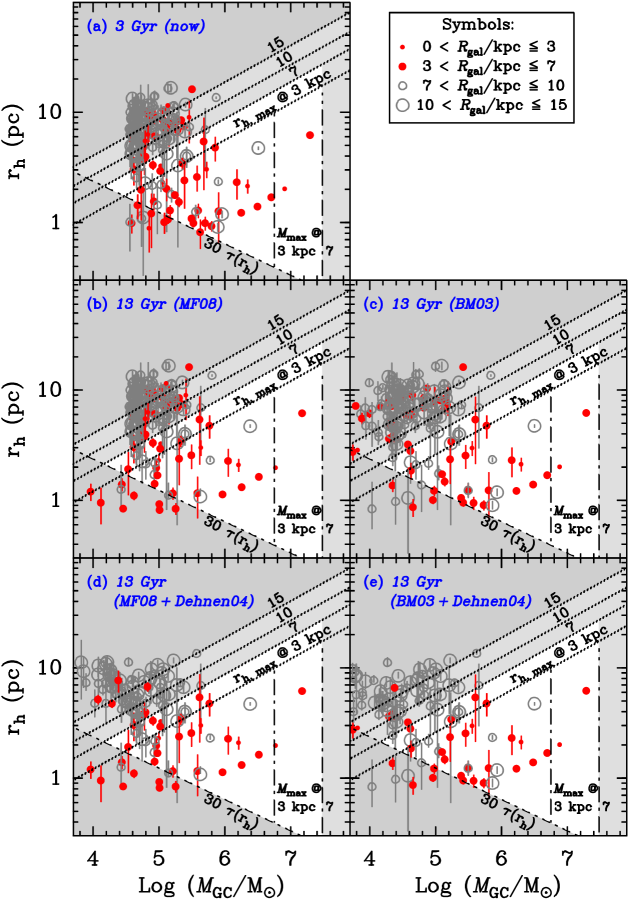
(ii) The Baumgardt & Makino (2003) model. Baumgardt & Makino (2003, hereafter BM03) performed extensive N-body simulations of star clusters, taking a (static) Galactic tidal field into account. Similar to MF08, they assume that GCs fill their Roche lobe in the tidal field. Adopting a King model with (i.e., ), we use their equation (7) to calculate dissolution times in Gyr for each red GC. In case Gyr, remaining GC masses at an age of 13 Gyr were approximated using where is the current cluster mass (see BM03). We employ circular GC orbits for this exercise, recognizing that dissolution times vary with orbit eccentricity approximately as (see BM03). Panel (c) of Fig. 14 shows the distribution of the surviving red GCs at an age of 13 Gyr in the mass-radius plane according to the BM03 model.
Comparing panels (b) and (c) of Fig. 14, one can see that the MF08 model yields higher mass loss for compact low-mass GCs while the BM03 model yields higher mass loss for larger GCs at a given initial mass. However, it is also clear that both models predict little mass loss for GCs with and pc, especially the MF08 model. Note that such diffuse, low-mass clusters are quite common in NGC 1316 even though they are rare in “normal” elliptical galaxies. This is further discussed below.
5.2. Diffuse Red Clusters and the Influence of Tidal Shocks
While diffuse, low-mass, red clusters such as those seen in NGC 1316 have hitherto not been identified in nearby “normal” elliptical galaxies, they are known to exist in about a dozen nearby lenticular (S0) galaxies (such clusters are sometimes called “faint fuzzies”; Larsen & Brodie, 2000; Brodie & Larsen, 2002; Peng et al., 2006b). Studies of the lenticular galaxies that host such clusters commonly found various signatures of past interactions with neighboring galaxies (Brodie & Larsen, 2002; Hwang & Lee, 2006, and references therein). The presence of several such clusters in the intermediate-age merger remnant NGC 1316 seems relevant in this context, also because its body’s dynamical ratio is consistent with an isotropic rotator (Arnaboldi et al., 1998), which is a typical signature of lenticular galaxies (e.g., Bender, 1988).
The population of such “diffuse” clusters in lenticular galaxies is typically fainter than the turnover of the GC luminosity function (of “normal” galaxies, i.e., , equivalent to M⊙), with colors similar to the brighter “red” clusters (Brodie & Larsen, 2002; Peng et al., 2006b). The situation for diffuse clusters in NGC 1316 is very similar, except that the mass range of the latter seem to extend to masses higher by a factor of 2 – 5 (viz. Fig. 11), which may in turn be due to such clusters having been exposed to dynamical evolution processes for a significantly shorter time in NGC 1316 than in “normal” galaxies. This raises the question: could the diffuse red clusters seen in the merger remnant NGC 1316 represent the precursors of their counterparts seen in “normal” lenticular galaxies? If so, what would their masses be at an age of 13 Gyr?
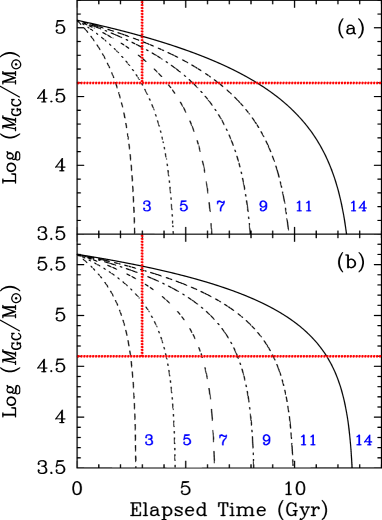
As discussed in the previous Section, evaporation by internal two-body relaxation is very ineffective for diffuse clusters with such low densities. In the absence of dynamical processes with higher mass loss efficacy for such clusters, the prevalence of such clusters in NGC 1316 would therefore seem at odds with the significantly lower frequency of such clusters in “normal” lenticular galaxies. However, a key feature of such clusters in NGC 1316 is that they typically have , i.e., their sizes are larger than the upper limit imposed by the tidal field of the host galaxy at their (see Sect. 4.3 and Fig. 11). This indicates that a significant fraction of the stars in such clusters is located outside the Roche lobe of the cluster, i.e., the outer limit of the “bound” part of such clusters that is in equilibrium with the tidal field of the host galaxy. Disruption of these diffuse clusters by tidal shocks is therefore expected to be significantly faster than for clusters that are tidally limited, i.e., clusters that do not extend beyond their Roche lobe. To our knowledge, the N-body simulation study of Dehnen et al. (2004) is the only one to date that addresses the dynamical evolution of this type of “supertidal”, low-density star cluster by galactic tides in detail. Dehnen et al. model the disruption of the diffuse Galactic cluster Palomar 5, for which pc and (see also Odenkirchen et al., 2003), similar to many diffuse clusters in NGC 1316. The simulations of Dehnen et al. (2004) suggest that clusters with that move along eccentric orbits never become tidally limited444This is unlike more “typical” surviving GCs, which feature higher and experience tidal shocks on time scales that are long relative to their dynamical time. For such clusters, tidal shocks are thought to cause significant mass loss only during their first few galactic orbits (Gnedin et al., 1999; Fall & Zhang, 2001) or during galaxy interactions (Kruijssen et al., 2011). At an assumed age of 3 Gyr, the red clusters in NGC 1316 already went through this era.. This would mean that their dynamical evolution would be mainly driven by tidal shocks rather than evaporation by two-body relaxation. For the case of Palomar 5 which has a current mass of M⊙, Dehnen et al. (2004) find that a cluster with an orbit-averaged mass loss M⊙ Gyr-1 yields the best fit. For an assumed age of 13 Gyr for Palomar 5, this implies a mass of M⊙ at an age of 3 Gyr assuming a constant Galactic tidal field strength. Note that this mass is just above the low-mass end of the diffuse clusters in NGC 1316 (with reliable size measurements). Using the values of as function of and from the simulations of Dehnen et al. (2004) (using polynomial interpolation), we estimate masses at an age of 13 Gyr for the clusters in NGC 1316 with for the case of . To do so, the values of from Dehnen et al. were scaled for a given cluster by considering that the mass loss timescale due to tidal shocks scales as (e.g., Gnedin et al., 1999). Here is the period of the cluster’s orbit, estimated as , where is the mass of NGC 1316 inside the galactocentric distance of the cluster in question. In this context we assume kpc for Palomar 5, which is the equivalent radius of its eccentric orbit (Odenkirchen et al., 2003). The results are shown in panels (d) and (e) of Fig. 14.
Note that the application of the Dehnen et al. (2004) calculations indeed predicts that many of the diffuse red clusters in NGC 1316 will end up in the area within the survival diagram known to be occupied by diffuse low-mass clusters in our Galaxy (several ‘Palomar’-type clusters; see panel (c) of Fig. 10). Hence, this yields a low-mass tail to the cluster mass function that is lacking when only applying cluster disruption due to two-body relaxation (especially for the MF08 model).

An interesting side consequence of the results of the Dehnen et al. (2004) simulations is that they would explain why the supertidal clusters with masses close to the low-mass cutoff implied by the constraint of avoiding biases related to varying incompleteness (i.e., mag) are only found in the outer regions of NGC 1316. To illustrate this, we plot versus the ratio in Figure 15 for all red clusters with mag, corresponding to . This plot shows clearly that diffuse clusters with are only found at kpc. Taking the median value of for clusters with and as a proxy ( = 9.0 kpc), we obtain a typical value of = 0.12 Gyr-1 from the Dehnen et al. simulations for the case of and . For a 3-Gyr-old cluster with , we then obtain at an age of yr (i.e., after the bulk of mass loss due to stellar evolution has already occurred). Figure 16a shows versus time for such a cluster for six values of assuming = 0.12 Gyr-1 at kpc. The low-mass cutoff of is indicated by a dotted horizontal line. Note that the Dehnen et al. simulations predict that such a cluster would only remain in a magnitude-limited sample with mag at an age of 3 Gyr for kpc, consistent with what we see. This suggests that the absence of such low-mass “supertidal” clusters in the inner regions of NGC 1316 is caused by tidal shocking rather than due to (e.g.) completeness-related issues. Incidently, this could also be the reason why Larsen & Brodie (2000) find a deficit of “faint fuzzies” in the central regions of the lenticular galaxy NGC 1023. For comparison purposes, Figure 16b shows the same as Figure 16a but for , which yields a cluster with a mass at age = 3 Gyr that is similar to the maximum mass attained by diffuse red clusters in NGC 1316. Note that such clusters are predicted to stay detectable in the outer regions of NGC 1316 for 10-12 Gyr, which is consistent with them having been detected in the outskirts of some nearby “normal” S0 galaxies.
We note that the simulations of Dehnen et al. (2004) only covered a limited parameter space in , and , and they used a gravitational potential model for our Galaxy. Hence, these results should be used with caution in a quantitative sense. Unfortunately, other N-body simulations of tidal stripping of clusters that extend beyond their Roche lobe are still lacking in the literature to our knowledge. Given the results shown here, it seems quite useful to perform such simulations for clusters with a range of properties encompassing those found for the diffuse red clusters in NGC 1316 as well as a more appropriate galactic potential (e.g., using a more massive bulge component). Such calculations would yield relevant (more quantitative) insights into the important question whether these clusters may indeed evolve into the “extended clusters” or “faint fuzzies” found in older lenticular galaxies which often show lingering evidence of interactions with other galaxies (e.g., nearby neighbors, see Brodie & Larsen 2002; Peng et al. 2006b). The nature of diffuse red clusters is further discussed in Sect. 6.3.
5.3. Resulting Mass Functions of Red GCs
In the context of building mass functions for the red clusters at an age of 13 Gyr from the dynamical evolution calculations mentioned above, we recall that so far, we only considered clusters with mag in order to avoid biases related to varying incompleteness for fainter clusters (see Section 4.1). However, it is likely that the assumed magnitude limit has an impact on the resulting mass function at low masses. To evaluate this impact, we build mass functions for two magnitude limits: mag (as before) and mag. For reference, the completeness fraction in the latter (fainter) cluster sample is as opposed to , and the minimum S/N returned by the ishape fits is 22 as opposed to 50.
The completeness-corrected cluster mass functions resulting from the calculations mentioned above are shown in Figs. 17 and 18 (using two-body relaxation prescriptions from MF08 and BM03, respectively). Mass functions are again shown for two bins of in the left-hand panels, and two bins of in the right-hand panels. The curves drawn in Figs. 17 and 18 represent fits of equation (5) to the cluster masses evolved to an age of 13 Gyr using cluster disruption due to both two-body relaxation and tidal shocks (i.e., the filled symbols), performed in a manner identical to that described in Section 4.4 and shown in Fig. 12. Resulting values for , and for each bin in and are again listed in Table 2.
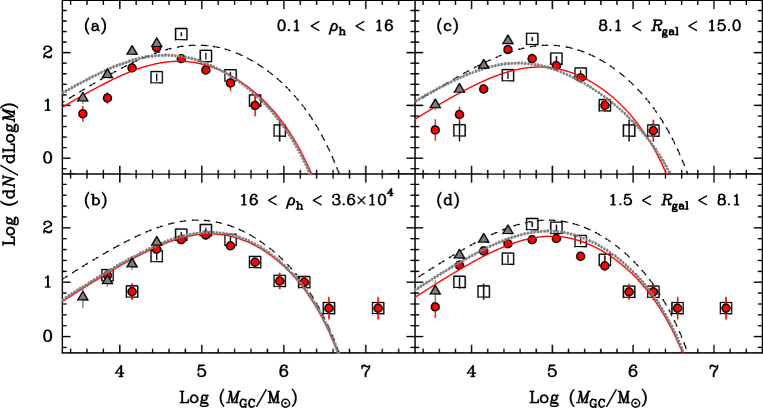
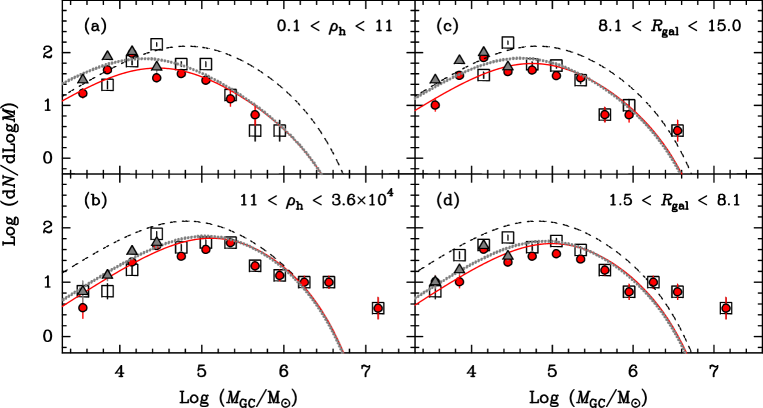
Figs. 17 and 18 show several items of interest. First of all, the estimated mass functions for an age of 13 Gyr appear roughly similar to the familiar shape of luminosity or mass functions of GCs in “normal” early-type galaxies. Secondly, Figs. 17 and 18 both show that exhibits a clear dependence on , whereas it depends less strongly on . This statement is reinforced by the fact that the dependence on is stronger for the sample with mag than for that with mag. Quantitatively, the mass function fits to the red clusters with mag imply that with when applying the MF08 prescriptions for two-body relaxation, and when applying the BM03 prescriptions. This is again consistent with the situation for cluster mass functions in our Galaxy and the Sombrero galaxy (Chandar et al. 2007; MF08) as well as with our findings for the “blue” metal-poor GCs in NGC 1316 (see Sect. 4.4 and Fig. 12), and hence with the notion that dynamical evolution by two-body relaxation is an important mechanism in shaping cluster mass functions after the early era of rapid mass loss by stellar evolution and gas expulsion (e.g., MF08). However, the shapes of the estimated mass functions are significantly better matched to those of the overplotted model fits (evolved Schechter functions) for the calculations that take into account disruption of the diffuse “supertidal” clusters due to tidal shocks than those that do not. This effect is illustrated most clearly in Fig. 17a where the calculations that use the MF08 model of mass loss by two-body relaxation (i.e., the open squares) are poorly fit by evolved Schechter functions (Eq. 5) at masses M⊙. This suggests that the observed functional dependence of on among ancient cluster systems is not necessarily due to evaporation by two-body relaxation alone. Our analysis suggests that it may be due in part to disruption of very low-density “supertidal” clusters by tidal shocks. The reason why the effect of disruption of supertidal clusters by tidal shocks can “masquerade” as that of two-body relaxation in mass function plots is that both mechanisms are characterized by mass loss rates that are highly linear with time (see Dehnen et al. 2004; Jordán et al. 2007).
Finally, we comment on the impact of the possibility that a small fraction of the fainter red GCs in NGC 1316 are in fact “old” ( 13 Gyr rather than 3 Gyr old; cf. Section 2) on the mass functions shown in Figures 17 and 18. Since ancient red GCs in “normal” early-type galaxies typically have radii of 1 – 4 pc (e.g., Jordán et al., 2005; Paolillo et al., 2011), Figure 14 shows that the impact of a small fraction of red GCs being old is predicted to be insignificant. Specifically, the dynamical evolution from 3 Gyr to 10 Gyr performed in this Section would have moved of order 7 – 10 of the red GCs with pc incorrectly to lower mass bins, but the mass function at those lower masses is entirely dominated by the GCs with pc since the tidal shocks in the Dehnen et al. (2004) model are only effective for the latter GCs.
6. Summary and Discussion
Using HST/ACS images, we have conducted size measurements of GCs in the giant 3-Gyr-old merger remnant galaxy NGC 1316 to obtain insights on the dynamical status of its “blue” (metal-poor) and “red” (metal-rich) GC subpopulations. Using simulations and calculations of cluster disruption from the recent literature, we make predictions on the effect of 10 Gyr of dynamical evolution of the red GCs which are assumed to have an age of 3 Gyr based on earlier work. These results are used in the context of evaluating the scenario that the “red” GCs in “normal” giant early-type galaxies (along with their bulge component) were formed in a way similar to that observed in gas-rich galaxy mergers today.
6.1. Dynamical Status of the Blue GCs
For the blue GCs, we find that their properties are consistent with those typically found for blue GCs in “normal” giant early-type galaxies. The GC mass function (MF) is consistent with an lognormal distribution, similar to the MF of ancient GCs in normal giant galaxies. The peak mass of the MF of the blue GCs increases with half-mass density as whereas it stays approximately constant with . As found recently for ancient GCs in the Milky Way and the Sombrero galaxy (Chandar et al., 2007; McLaughlin & Fall, 2008), the mass functions of the blue GCs are consistent with a simple scenario in which the clusters formed with a Schechter initial mass function and evolved subsequently by disruption driven mainly by internal two-body relaxation (but see the last paragraph of Section 6.2 below).
6.2. Dynamical Status of the Red GCs
For the intermediate-age metal-rich (red) GCs, we find that the faint end of the previously reported luminosity function of the clusters outside a galactocentric radius of 9 kpc (which showed a power-law, Goudfrooij et al., 2004) is due to those low-mass clusters having half-light radii large enough for disruption by two-body relaxation to be ineffective. This is especially the case when considering the MF08 prescriptions for mass loss due to two-body relaxation. Moreover, we find that the radii of many of these diffuse red GCs are larger than the theoretical maximum value imposed by the tidal field of NGC 1316 at their . We therefore suggest that the diffuse “supertidal” clusters in NGC 1316 lose a large fraction of their mass due to tidal shocks in a way similar to that described by the simulations of Dehnen et al. (2004) which were performed to understand the properties of the extended cluster Palomar 5 in our Galaxy. Application and scaling of the Dehnen et al. simulations to these “supertidal” clusters in NGC 1316 in addition to the application of cluster disruption by two-body relaxation yields several findings relevant to the nature of the red GCs:
-
1.
Clusters larger than twice the maximum radius imposed by the tidal field of NGC 1316 with at an age of 108 yr (i.e., after the era of strong mass loss due to stellar evolution) would not survive to an age of 3 Gyr in NGC 1316 if located within kpc, which is consistent with the observations. Note that such clusters with would be detectable there according to our completeness calculations.
-
2.
Another 10 Gyr of simulated dynamical evolution of the red GCs yields a MF whose shape is similar to the lognormal shape of MFs of ancient GCs in normal galaxies throughout the range of galactocentric distances covered by the observations. The peak mass of the simulated MF of the red GCs at an age of 13 Gyr increases with as or when using the prescriptions for mass loss due to two-body relaxation by MF08 or BM03, respectively. While this dependence of on is consistent with that found for the (old) blue GCs in NGC 1316 as well as for the GC systems of the Milky Way and the Sombrero galaxy as mentioned above, we emphasize that it is not only due to internal two-body relaxation for the red GCs in NGC 1316. With this in mind, we suggest that disruption of low-density “supertidal” GCs by tidal shocks may be partly responsible for this scaling relation among MFs of ancient GC systems.
6.3. The Nature of Diffuse Red Clusters
Finally, we comment on the nature and demography of the class of diffuse red clusters, which are quite prevalent in NGC 1316. Diffuse clusters with properties (luminosities, colors, sizes) similar to those found here in NGC 1316 were first introduced as “faint fuzzies” by Larsen & Brodie (2000) and are also sometimes referred to as “extended clusters” (Huxor et al., 2008). While extended clusters are also found in halos of nearby spiral galaxies and in dwarf galaxies, the great majority of the latter are metal-poor (Chandar et al., 2004; Huxor et al., 2008; Georgiev et al., 2009, and references therein), whereas diffuse clusters found in NGC 1316 and younger merger remnants are metal-rich. We therefore constrain the following discussion to the case of metal-rich diffuse GCs, i.e., diffuse GCs with or , similar to the “faint fuzzies” originally introduced by Larsen & Brodie (2000) and the “diffuse star clusters” discussed by Peng et al. (2006b). Here we adopt the acronym DRC (“diffuse red clusters”) to describe this class of objects.
As shown by Larsen et al. (2001) and Peng et al. (2006b), “normal” giant early-type galaxies that are known to host significant numbers of DRCs share a number of properties that seem relevant to the nature of DRCs: (i) Their morphological type is virtually always S0 rather than E; (ii) They exhibit various signatures of ongoing or past interactions with neighboring galaxies such as strong fine structure, disturbed morphology, the presence of companion spiral galaxies, or their location as the dominant galaxy of a small galaxy group. In contrast, giant S0 galaxies in the samples of Larsen et al. (2001) and Peng et al. (2006b) that do not show such signatures of past interactions do not possess any significant number of DRCs. This observation is consistent with the suggestion by Brüns et al. (2009, 2011, and references therein) that such diffuse clusters may be formed by merging of star cluster complexes such as those commonly found in starburst regions within galaxy mergers or in the disks of giant spiral galaxies (e.g. Bastian et al., 2005). The fact that NGC 1316 possesses a large number of DRCs also corroborates this idea, given its nature as an obvious merger remnant and its dynamical nature as a rotationally supported galaxy (similar to S0 galaxies).
Several properties of DRCs are consistent with their denser counterparts (i.e., red GCs of “normal” size, ), which may help further our understanding of their nature. The spatial distribution of DRCs in S0 galaxies typically follows that of the galaxy light: It is very elongated for “late-type” S0s such as NGC 1023 and NGC 3384 (Larsen & Brodie, 2000), and more spherical for bulge-dominated S0s such as M85 (Peng et al., 2006b) as well as NGC 1316 (see Sect. 5.2). Apart from their apparent absence in the innermost regions of galaxies, the DRCs seem to be similar in this respect to “normal” red GCs, which are typically closely associated with the bulge component of their host galaxy as well (e.g., Kissler-Patig et al., 1997; Goudfrooij et al., 2001a, 2007; Peng et al., 2006a). In the scenario where the red GCs and the bulges of early-type galaxies are formed during dissipative galaxy mergers, this physical association indicates that the progenitors of the red GCs underwent the same violent relaxation as did the stars of the progenitor galaxies.
The main difference between DRCs and “normal” red GCs within a given normal galaxy (apart from their sizes) is that DRCs typically have masses lower than the mass associated with the typical turnover magnitude of the GCLF of “normal” red GCs (Brodie & Larsen, 2002; Peng et al., 2006b). This is the case in NGC 1316 as well, although the DRCs in NGC 1316 reach slightly higher masses, perhaps due to their younger age which renders their masses to be closer to their initial masses. This difference in mass ranges is relevant because the formation efficiency of young massive clusters in a certain region has been shown to scale with the star formation rate (SFR) in that region (Larsen & Richtler, 2000). This correlation is likely a consequence of the correlations between SFR and gas density (Kennicutt, 1998) and between gas density and the star formation efficiency in high-mass clouds (Efremov, 1994; Elmegreen & Efremov, 1997). Hence, the number of GCs of a certain class above a certain mass threshold should be proportional to the SFR at the time those GCs were formed (see also Larsen, 2002; Weidner et al., 2004; Bastian, 2008; Georgiev et al., 2012). Since it is hard to preferentially destroy massive GCs while preserving low-mass ones, we suggest that the typically lower masses of DRCs with respect to “normal” red GCs reflects that the DRCs were formed in sites with lower SFR than in the formation sites of the “normal” GCs. Perhaps DRCs are formed in gas clouds with relatively low density with respect to the clouds that produce normal GCs. This is consistent with the suggestion by Elmegreen (2008) that DRCs are formed in clouds that are at or near the low-density limit for cluster boundedness in regions with high turbulence (Mach numbers). Such circumstances can likely occur in galaxy mergers by means of shocked clouds or direct ISM impacts between components of the progenitor galaxies, perhaps mainly outside the inner, dynamically most violent region of the interaction.
Incidently, such a scenario of environment-driven formation of DRCs may also explain why DRCs seem to be largely absent in giant E galaxies (as opposed to S0 galaxies). According to the extensive N-body/hydro simulations of Mihos & Hernquist (1996), mergers of two early-type disk galaxies (i.e., galaxies with significant bulge components) typically experience peak SFRs that are factors 2 – 5 higher than do mergers of two late-type disk galaxies (without bulges), with the value of the factor depending on the geometry of the galaxy encounters. Perhaps the assembly histories of giant E galaxies with their pressure-supported stellar dynamics were dominated by interactions involving progenitor galaxies with pre-existing bulge components, while rotation-supported giant S0 galaxies may have been assembled mainly (or more predominantly) by means of interactions involving bulgeless disk galaxies. The lower gas densities achieved in the latter interactions may have triggered the formation of several DRCs whereas the high-SFR interactions between galaxies with pre-existing bulges may not have.
In the context of this scenario, the absence of DRCs in many giant S0 galaxies may be due to gradual disruption of DRCs by tidal shocks as discussed above for NGC 1316. The DRCs seen in some S0 galaxies may have been formed during relatively recent dissipative interactions of galaxies that did not host significant bulges. Looking at Figure 16b, “relatively recent” in this context would mean less than roughly 7 – 9 Gyr ago for a galaxy with a mass similar to NGC 1316, and possibly longer ago for less massive galaxies. For most giant early-type galaxies however, such interactions have likely happened long enough ago for the DRCs to have suffered enough mass loss to be rendered undetectable (or too faint to obtain reliable size information) at the present day, at least in their inner regions which were typically targeted by the HST observations. Time will tell whether DRCs can (still) be detected and identified in the tidally benign outer regions of giant early-type galaxies.
Acknowledgments.
The author thanks François Schweizer for kindly providing useful feedback on an early version of this paper. PG also acknowledges useful discussions with Rupali Chandar, Iskren Georgiev, Mark Gieles, and Thomas Puzia. The referee is acknowledged for insightful comments that improved the paper. Support for HST programs GO-9409 and GO-11691 was provided by NASA through grants from the Space Telescope Science Institute, which is operated by the Association of Universities for Research in Astronomy, Inc., under NASA contract NAS5–26555. STSDAS and PyRAF are products of the Space Telescope Science Institute, which is operated by AURA for NASA. The SAO/NASA Astrophysics Data System was used heavily while this paper was written.
Facility: HST (ACS)
References
- Anderson & King (2006) Anderson, J., & King, I. R. 2006, “PSFs, Photometry, and Astrometry for the ACS/WFC”, ACS Instrument Science Report 2006-01 (Baltimore:STScI)
- Arnaboldi et al. (1998) Arnaboldi, M., Freeman, K. C., Gerhard, O., et al. 1998, ApJ, 507, 759
- Ashman & Zepf (1992) Ashman, K. M., & Zepf, S. E. 1992, ApJ, 384, 50
- Bastian (2008) Bastian, N. 2008, MNRAS, 390, 759
- Bastian et al. (2005) Bastian, N., Gieles, M., Efremov, Yu. N., & Lamers, H. J. G. L. M. 2005, A&A, 443, 79
- Bastian et al. (2006) Bastian, N., Saglia, R. P., Goudfrooij, P., et al. 2006, A&A, 448, 881
- Bastian et al. (2008) Bastian, N., Gieles, M., Goodwin, S. P., et al. 2008, MNRAS, 389, 223
- Bastian et al. (2009) Bastian, N., Trancho, G., Konstantopoulos, I. S., & Miller, B. W. 2009, ApJ, 701, 607
- Baugh et al. (1996) Baugh, C. M., Cole, S., & Frenk, C. S. 1996, MNRAS, 283, 1361
- Baumgardt & Makino (2003) Baumgardt, H., & Makino, J. 2003, MNRAS, 340, 227 (BM03)
- Baumgardt & Kroupa (2007) Baumgardt, H., & Kroupa, P. 2007, MNRAS, 380, 1589
- Baumgardt et al. (2008) Baumgardt, H., Kroupa, P., & Parmetier, G. 2008, MNRAS, 384, 1231
- Bender (1988) Bender, R. 1988, A&A, 193, L7
- Binney & Tremaine (1987) Binney, J., & Tremaine, S. 1987, Galactic Dynamics (Princeton, NJ: Princeton University Press)
- Brodie & Larsen (2002) Brodie, J. P., & Larsen, S. S. 2002, AJ, 124, 1410
- Brodie et al. (1998) Brodie, J. P., Schroder, L. L., Huchra, J. P., Phillips, A. C., Kissler-Patig, M., & Forbes, D. A. 1998, AJ, 116, 691
- Brüns et al. (2009) Brüns, R. C., Kroupa, P., & Fellhauer, M. 2009, ApJ, 702, 1268
- Brüns et al. (2011) Brüns, R. C., Kroupa, P., Fellhauer, M., Metz, M., & Assmann, P. 2011, A&A, 529, A138
- Bruzual & Charlot (2003) Bruzual, G. A., & Charlot, S. 2003, MNRAS, 344, 1000 (BC03)
- Burkert & Smith (2000) Burkert, A., & Smith, G. H. 2000, ApJ, 542, L95
- Caon et al. (1994) Caon, N., Capaccioli, M., & D’Onofrio, M., 1994, A&AS, 106, 199
- Carlson & Holtzman (2001) Carlson, M. N., & Holtzman, J. A. 2001, PASP, 113, 1522
- Chabrier (2003) Chabrier, G. 2003, PASP, 115, 763
- Chandar et al. (2004) Chandar, R., Whitmore, B. C., & Lee, M. G. 2004, ApJ, 611, 220
- Chandar et al. (2007) Chandar, R., Fall, S. M., & McLaughlin, D. E. 2007, ApJ, 668, L119
- Cole et al. (2000) Cole, S., Lacey, C. G., Baugh, C. M., & Frenk, C. S. 2000, MNRAS, 319, 168
- Dehnen et al. (2004) Dehnen, W., Odenkirchen, M., Grebel, E. K., & Rix, H.-W. 2004, AJ, 127, 2753
- de Vaucouleurs et al. (1991) de Vaucouleurs, G. et al., 1991, “Third Reference Catalog of Bright Galaxies” (New York: Springer)
- Efremov (1994) Efremov, Yu. N. 1994, in Violent Star Formation from 30 Dor to QSOs, ed. G. Tenorio-Tagle (Cambridge: Cambridge University Press), 61
- Elmegreen (2008) Elmegreen, B. G. 2008, ApJ, 672, 1006
- Elmegreen & Efremov (1997) Elmegreen, B. G., & Efremov, Yu. N. 1997, ApJ, 480, 235
- Fall & Rees (1977) Fall, S. M., & Rees, M. J. 1977, MNRAS, 181, 37P
- Fall & Zhang (2001) Fall, S. M., & Zhang, Q. 2001, ApJ, 561, 751
- Fall et al. (2009) Fall, S. M., Chandar, R., & Whitmore, B. C. 2009, ApJ, 704, 453
- Forbes et al. (1997) Forbes, D. A., Brodie, J. P., & Grillmair, C. J. 1997, AJ, 113, 1652
- Forbes et al. (2001) Forbes, D. A., Beasley, M. A., Brodie, J. P., & Kissler-Patig, M. 2001, ApJ, 563, L143
- Geisler et al. (1996) Geisler, D., Lee, M. G., & Kim, E. 1996, AJ, 111, 1529
- Georgiev et al. (2009) Georgiev, I. Y., Puzia, T. H., Hilker, M., & Goudfrooij, P. 2009, MNRAS, 392, 879
- Georgiev et al. (2012) Georgiev, I. Y., Goudfrooij, P., & Puzia, T. H. 2012, MNRAS, 420, 1317
- Gieles & Baumgardt (2008) Gieles, M., & Baumgardt, H. 2008, MNRAS, 389, L28
- Gieles et al. (2006) Gieles, M., Larsen, S. S., Bastian, N., & Stein, I. T. 2006, A&A, 450, 129
- Giersz & Heggie (1996) Giersz, M., & Heggie, D. C. 1996, MNRAS, 279, 1037
- Gnedin & Ostriker (1997) Gnedin, O. Y., & Ostriker, J. P. 1997, ApJ, 474, 223
- Gnedin et al. (1999) Gnedin, O. Y., Lee, H. M., & Ostriker, J. P. 1999, ApJ, 522, 935
- Goudfrooij et al. (2001a) Goudfrooij, P., Alonso, M. V., Maraston, C., & Minniti, D. 2001a, MNRAS, 328, 237
- Goudfrooij et al. (2001b) Goudfrooij, P., Mack, J., Kissler-Patig, M., Meylan, G., & Minniti, D. 2001b, MNRAS, 322, 643
- Goudfrooij et al. (2004) Goudfrooij, P., Gilmore, D., Whitmore, B. C., & Schweizer, F. 2004, ApJ, 613, L121
- Goudfrooij et al. (2007) Goudfrooij, P., Schweizer, F., Gilmore, D., & Whitmore, B. C., 2007, AJ, 133, 2737
- Harris (1996) Harris, W. E. 1996, AJ, 112, 1487
- Harris (2001) Harris, W. E. 2001, in Star Clusters, ed. L. Labhardt & B. Binggeli (Berlin:Springer), 223
- Harris (2009) Harris, W. E. 2009, ApJ, 699, 254
- Heggie & Giersz (2008) Heggie, D. C., & Giersz, M. 2008, MNRAS, 389, 1858
- Holtzman et al. (1992) Holtzman, J. A., Faber, S. M., Shaya, E. J., et al. 1992, AJ, 103, 691
- Huxor et al. (2008) Huxor, A. P., Tanvir, N. R., Ferguson, A. M. N., Irwin, M. J., Ibata, R., Bridges, T., & Lewis, G. F. 2008, MNRAS, 385, 1989
- Hwang & Lee (2006) Hwang, N., & Lee, M. G. 2006, ApJ, 638, L79
- Jordán et al. (2004) Jordán, A., Côté, P., West, M. J., Marzke, R. O., Minniti, D., & Rejkuba, M. 2004, AJ, 127, 24
- Jordán et al. (2005) Jordán, A., et al. 2005, ApJ, 634, 1002
- Jordán et al. (2007) Jordán, A., et al. 2007, ApJS, 171, 101
- Kennicutt (1998) Kennicutt Jr., R. C. 1998, ApJ, 498, 541
- King (1962) King, I. R. 1962, AJ, 67, 471
- Kissler-Patig et al. (1997) Kissler-Patig, M., Richtler, T., Storm, J., & della Valle, M. 1997, A&A, 327, 503
- Krist & Hook (2004) Krist, J., & Hook, R. 2004, The Tiny Tim Manual (http://www.stsci.edu/software/tinytim/tinytim.html)
- Kroupa (2001) Kroupa, P. 2001, MNRAS, 322, 231
- Kruijssen et al. (2011) Kruijssen, J. M. D., Pelupessy, F. I., Lamers, H. J. G. L. M., Portegies Zwart, S. F., Bastian, N., & Icke, V. 2011, MNRAS, 414, 1339
- Kundu (2008) Kundu, A. 2008, AJ, 136, 1013
- Kundu & Whitmore (1998) Kundu, A., & Whitmore, B. C. 1998, AJ, 116, 2841
- Kundu & Whitmore (2001) Kundu, A., & Whitmore, B. C. 2001, AJ, 121, 1888
- Lada & Lada (2003) Lada, C. J., & Lada, E. A. 2003, ARA&A, 41, 57
- Larsen (1999) Larsen, S. S. 1999, A&AS, 139, 393
- Larsen (2002) Larsen, S. S. 2002, AJ, 124, 1393
- Larsen & Brodie (2000) Larsen, S. S., & Brodie, J. P. 2000, AJ, 120, 2938
- Larsen & Richtler (2000) Larsen, S. S., & Richtler, T. 2000, A&A, 354, 836
- Larsen et al. (2001) Larsen, S. S., Brodie, J. P., Huchra, J. P., Forbes, D. A., & Grillmair, C. J. 2001, AJ, 121, 2974
- Mackey et al. (2008) Mackey, A. D., Wilkinson, M. I., Davies, M. B., & Gilmore, G. F. 2008, MNRAS, 386, 65
- Madrid et al. (2009) Madrid, J. P., Harris, W. E., Blakeslee, J. P., & Gómez, M. 2009, ApJ, 705, 237
- Marín-Franch et al. (2009) Marín-Franch, A., et al. 2009, ApJ, 694, 1498
- Masters et al. (2010) Masters, K. L., Jordán, A., Côté, P., et al. 2010, ApJ, 715, 1419
- Maraston (2005) Maraston, C. 2005, MNRAS, 362, 799
- Maraston et al. (2001) Maraston, C., Kissler-Patig, M., Brodie, J. P., Barmby, P., & Huchra, J. P., 2001, A&A, 370, 176
- Maraston et al. (2004) Maraston, C., Bastian, N., Saglia, R. P., Kissler-Patig, M., Schweizer, F., & Goudfrooij, P. 2004, A&A, 416, 467
- McLaughlin (2000) McLaughlin, D. E. 2000, ApJ, 539, 618
- McLaughlin & Fall (2008) McLaughlin, D. E., & Fall, S. M. 2008, ApJ, 679, 1272 (MF08)
- McLaughlin & Pudritz (1996) McLaughlin, D. E., & Pudritz, R. E. 1996, ApJ, 469, 194
- McLaughlin & van der Marel (2005) McLaughlin, D. E., & van der Marel, R. P. 2005, ApJS, 161, 304
- Meurer et al. (1995) Meurer, G. R., Heckman, T. M., Leitherer, C., Kinney, A., Robert, C., & Garnett, D. R. 1995, AJ, 110, 2665
- Mihos & Hernquist (1996) Mihos, J., & Hernquist, L. 1996, ApJ, 464, 641
- Miller et al. (1997) Miller, B. W., Whitmore, B. C., Schweizer, F., & Fall, S. M. 1997, AJ, 114, 2381
- Odenkirchen et al. (2003) Odenkirchen, M., et al. 2003, AJ, 126, 2385
- Paolillo et al. (2011) Paolillo, M., Puzia, T. H., Goudfrooij, P., et al. 2011, ApJ, 736, 90
- Peng et al. (2006a) Peng, E. W., Jordán, A., Côté, P., et al. 2006, ApJ, 639, 95
- Peng et al. (2006b) Peng, E. W., Côté, P., Jordán, A., et al. 2006, ApJ, 639, 838
- Portegies Zwart et al. (2010) Portegies Zwart, S. F., McMillan, S. L. W., & Gieles, M. 2010, ARA&A, 48, 431
- Prieto & Gnedin (2008) Prieto, J. L., & Gnedin, O. Y. 2008, ApJ, 689, 919
- Puzia et al. (1999) Puzia, T. H., Kissler-Patig, M., Brodie, J. P., & Huchra, J. P. 1999, AJ, 118, 2734
- Puzia et al. (2005) Puzia, T. H., Kissler-Patig, M., Thomas, D., Maraston, C., Saglia, R. P., Bender, R., Goudfrooij, P., & Hempel, M. 2005, A&A, 439, 997
- Puzia et al. (2006) Puzia, T. H., Kissler-Patig, M., & Goudfrooij, P. 2006, ApJ, 648, 383
- T. H. Puzia et al. (2012) Puzia, T. H., Paolillo, M., Goudfrooij, P., et al. 2012, in preparation
- Rhode & Zepf (2001) Rhode, K. L., & Zepf, S. E. 2001, AJ, 121, 210
- Salpeter (1955) Salpeter, E. E. 1955, ApJ, 121, 161
- Sandage & Tammann (1987) Sandage, A. R., & Tammann, G. A. 1987, “A Revised Shapley-Ames Catalog of Bright Galaxies” (Washington: Carnegie Institution of Washington)
- Schechter (1976) Schechter, P. 1976, ApJ, 203, 297
- Schweizer (1980) Schweizer, F. 1980, ApJ, 237, 303
- Schweizer (1981) Schweizer, F. 1981, ApJ, 246, 722
- Schweizer (1987) Schweizer, F. 1987, in: “Nearly Normal Galaxies”, ed. S. M. Faber (Springer: New York), 18
- Schweizer & Seitzer (1998) Schweizer, F., & Seitzer, P. 1998, AJ, 116, 2206
- Schweizer et al. (1996) Schweizer, F., Miller, B. W., Whitmore, B. C., & Fall, S. M. 1996, AJ, 112, 1839
- Sirianni et al. (2005) Sirianni, M. et al. 2005, PASP, 117, 1049
- Somerville et al. (2001) Somerville, R. S., Primack, J. R., & Faber, S. M. 2001, MNRAS, 320, 504
- Spitler et al. (2006) Spitler, L. R., Larsen, S. S., Strader, J., et al. 2006, AJ, 132, 1593
- Spitzer (1987) Spitzer, L. 1987, Dynamical Evolution of Globular Clusters (Princeton: Princeton University Press)
- Toomre (1977) Toomre, A. 1977, in The Evolution of Galaxies and Stellar Populations, ed. B. Tinsley & R. Larson (New Haven: Yale University Press), 401
- Trancho et al. (2007) Trancho, G., Bastian, N., Schweizer, F., & Miller, B. W. 2007, ApJ, 658, 993
- Venables & Ripley (2002) Venables, W. N., & Ripley, B. D. 2002, Modern Applied Statistics with S (New York: Springer)
- Vesperini (2000) Vesperini, E. 2000, MNRAS, 318, 841
- Vesperini (2001) Vesperini, E. 2001, MNRAS, 322, 247
- Vesperini et al. (2009) Vesperini, E., McMillan, S. L. W., & Portegies Zwart, S. 2009, ApJ, 698, 615
- Weidner et al. (2004) Weidner, C., Kroupa, P., & Larsen, S. S. 2004, MNRAS, 350, 1503
- White & Frenk (1991) White, S. D. M., & Frenk, C. S. 1991, ApJ, 379, 52
- Whitmore et al. (1999) Whitmore, B. C., Zhang, Q., Leitherer, C., Fall, S. M., Schweizer, F., & Miller, B. W. 1999, AJ, 118, 1551
- Whitmore et al. (2002) Whitmore, B. C., Schweizer, F., Kundu, A., & Miller, B. W. 2002, AJ, 124, 147
- Whitmore et al. (2010) Whitmore, B. C., Chandar, R., Schweizer, F., et al. 2010, AJ, 140, 75
- Woodley et al. (2009) Woodley, K. A., Harris, W. E., Puzia, T. H., Gómez, M., Harris, G. L. H., & Geisler, D. 2010, ApJ, 708, 1335
- Zepf et al. (1995) Zepf, S. E., Carter, D., Sharples, R. M., Ashman, K. M. 1995, ApJ, 445, L19
- Zepf et al. (1999) Zepf, S. E., Ashman, K. M., English, J., Freeman, K. C., & Sharples, R. M. 1999, AJ, 118, 752
- Zhang & Fall (1999) Zhang, Q., & Fall, S. M. 1999, ApJ, 527, L81
| Sample | Subsample | |||
|---|---|---|---|---|
| (1) | (2) | (3) | (4) | (5) |
| Blue, | all | 164 | ||
| low- bin | 36 | |||
| high- bin | 1317 | |||
| inner bin | 229 | |||
| outer bin | 120 | |||
| Red (now), | low- bin | 6 | ||
| high- bin | 274 | |||
| inner bin | 42 | |||
| outer bin | 10 | |||
| Red (13 Gyr, MF08), | all | 16 | ||
| low- bin | 4 | |||
| high- bin | 213 | |||
| inner bin | 115 | |||
| outer bin | 9 | |||
| Red (13 Gyr, BM03), | all | 11 | ||
| low- bin | 3 | |||
| high- bin | 283 | |||
| inner bin | 97 | |||
| outer bin | 6 | |||
| Red (13 Gyr, MF08), | low- bin | 3 | ||
| high- bin | 115 | |||
| inner bin | 35 | |||
| outer bin | 7 | |||
| Red (13 Gyr, BM03), | low- bin | 2 | ||
| high- bin | 125 | |||
| inner bin | 26 | |||
| outer bin | 5 |