High field magnetospectroscopy to probe the eV Ni color center in diamond
Abstract
A magneto-optical study of the eV Ni color center in boron-free synthetic diamond, grown at high pressure and high temperature, has been performed in magnetic fields up to T. The data is interpreted using the effective spin Hamiltonian of Nazaré, Nevers and Davies [Phys. Rev. B 43, 14196 (1991)] for interstitial Ni+ with the electronic configuration and effective spin . Our results unequivocally demonstrate the trigonal symmetry of the defect which preferentially aligns along the [111] growth direction on the (111) face, but reveal the shortcomings of the crystal field model for this particular defect.
pacs:
71.55.-i, 78.55.-mI Introduction
Diamond, as a material, has attracted a lot of attention due to its unique physical properties; it is the hardest known material with high thermal conductivity and a eV wide electronic band gap. The large Debye temperature of diamond reduces the interaction between impurities and the lattice leading to almost atomic like optical emission spectra of defects with extremely narrow lines. The so-called color centers, various transition metal-nitrogen/vacancy complexes in diamond, can act as single photon sources, capable of photostable operation at room temperature, Aharonovich et al. (2009a, b); Simpson et al. (2009); Castelletto et al. (2010) with possible applications in quantum information processing Morton (2006). Moreover, the nitrogen/vacancy (NV) center in diamond has been used to image a single electronic spin using nanoscale magnetometry. Maze et al. (2008); Balasubramanian et al. (2008) The NV center has also been used to produce diamond based light emitting diodes. Lohrmann et al. (2011) These developments have led to a renewed interest in the optical properties of color centers in diamond.
Macroscopic synthetic diamond crystals are mainly grown by chemical-vapor deposition (CVD) methods or by the high-pressure high-temperature (HPHT) method, the latter giving mm3 size bulk crystals. In both growth techniques there are only a few impurities which can enter into the diamond structure. Using the HPHT method, the incorporation of cobalt (Co) Lawson et al. (1996) or nickel (Ni) Collins and Spear (1982); Zaitsev (2000) has been achieved in significant amounts. Incorporating transition metals into diamond is of interest for applications such as single photon emitters Aharonovich et al. (2009a, b); Simpson et al. (2009); Castelletto et al. (2010) or spintronics in analogy to diluted magnetic semiconductors (DMS). The Curie temperature of DMS has been predicted to scale with the inverse cube of the lattice constant of the host matrix Dietl et al. (2001). Diamond has the smallest lattice constant of all semiconductors, making it an excellent candidate for ferromagnetic ordering above room temperature. For all these reasons, a thorough understanding of transition metal complexes in diamond has become essential to further develop diamond related technologies.
Despite the numerous potential applications of the nickel color center in diamond, its exact crystallographic site and electronic properties are still under debate. The NIRIM-2 electron spin resonance (ESR) line,Isoya et al. (1990a) has been identified with the eV doublet of zero phonon lines (ZPLs) seen in optical studies,Davies et al. (1989); Nazaré et al. (1991); Iakoubovskii and Davies (2004); Mason et al. (1999); Maes et al. (2004) and unambiguously attributed to a nickel containing center.Davies et al. (1989); Nazaré et al. (1991) The ESR results suggested that the nickel is incorporated interstitially in a single positively charge state , effective spin with trigonal symmetry and a strong trigonal distortion due to the presence of an additional impurity or vacancy near by Isoya et al. (1990a). The trigonal symmetry was confirmed by optical studies Nazaré et al. (1991) under uniaxial stress and magnetic fields up to T. The agreement between the ESR and magneto-optical data has lead some authors to propose that the Zeeman splitting of the eV line be used as a pulsed magnetic field calibration probe. Maes et al. (2004) However, recent studies suggested an alternative complex of nickel with boron, Baker (2003) or even isolated interstitial Ni. Larico et al. (2004) Recent theoretical work also contradicts the hypothesis of either isolated interstitial Ni or interstitial Ni complex with either a vacancy or an impurity; the calculations predict that interstitial Ni with trigonal symmetry is unstable. Larico et al. (2009)
In order to further elucidate the nature of this defect, we have performed a magneto-optical study of the Ni color center in synthetic diamond which is characterized by two zero-phonon lines (ZPLs) at and eV. Measurements in high magnetic fields unequivocally demonstrate the trigonal symmetry of the defect which is mostly incorporated on the (111) faces with its trigonal axis preferentially aligned along the growth direction. For incorporation on the (001) face there is no preferential alignment of the defect axis along one of the four directions. These results are extremely well described by the effective spin Hamiltonian for a trigonal defect proposed in the seminal paper of Nazaré, Nevers and Davies Nazaré et al. (1991) (hereafter referred to as NND) using a single parameter set for both the (111) and (001) faces. However, in certain regions of the (111) face the trigonal axis of the defect is not preferentially aligned. Under such conditions, the correct parameters of the effective spin Hamiltonian are significantly different.
II Sample characterization
Two diamond crystals containing nickel and nitrogen have been studied. The crystals were grown in nickel solvent in similar high pressure and high temperature conditions, except that for one of the crystals a nitrogen getter (Ti) was added to the solvent in order to reduce the nitrogen incorporation. Crystal KA1970 (Sample A), grown with the nitrogen getter has a light green color, and, KA1153 (Sample B) grown without the nitrogen getter has a yellow/brown color. As there was no specific boron contamination of the growth environment, the concentration of this impurity is expected to be negligible in the grown crystals. Both single crystals have mainly wide (111) growth sectors, with smaller (001) growth sectors terminated by square faces. The type Ib diamond seed crystals were not removed. According to the growth conditions, the nickel concentration is expected to be around cm-3 in both crystals, and the nitrogen concentration around cm-3 in Sample A and cm-3 in Sample B. Due to the dependence of the impurity incorporation rate on the crystallographic orientation during growth, the impurity concentration is expected to depend on the growth sector. Crystals were characterized by cathodoluminescence at K with a kV e-beam and magnetometry using a SQUID magnetometer in the temperature range to K and in a to T magnetic field.
II.1 Cathodoluminescence
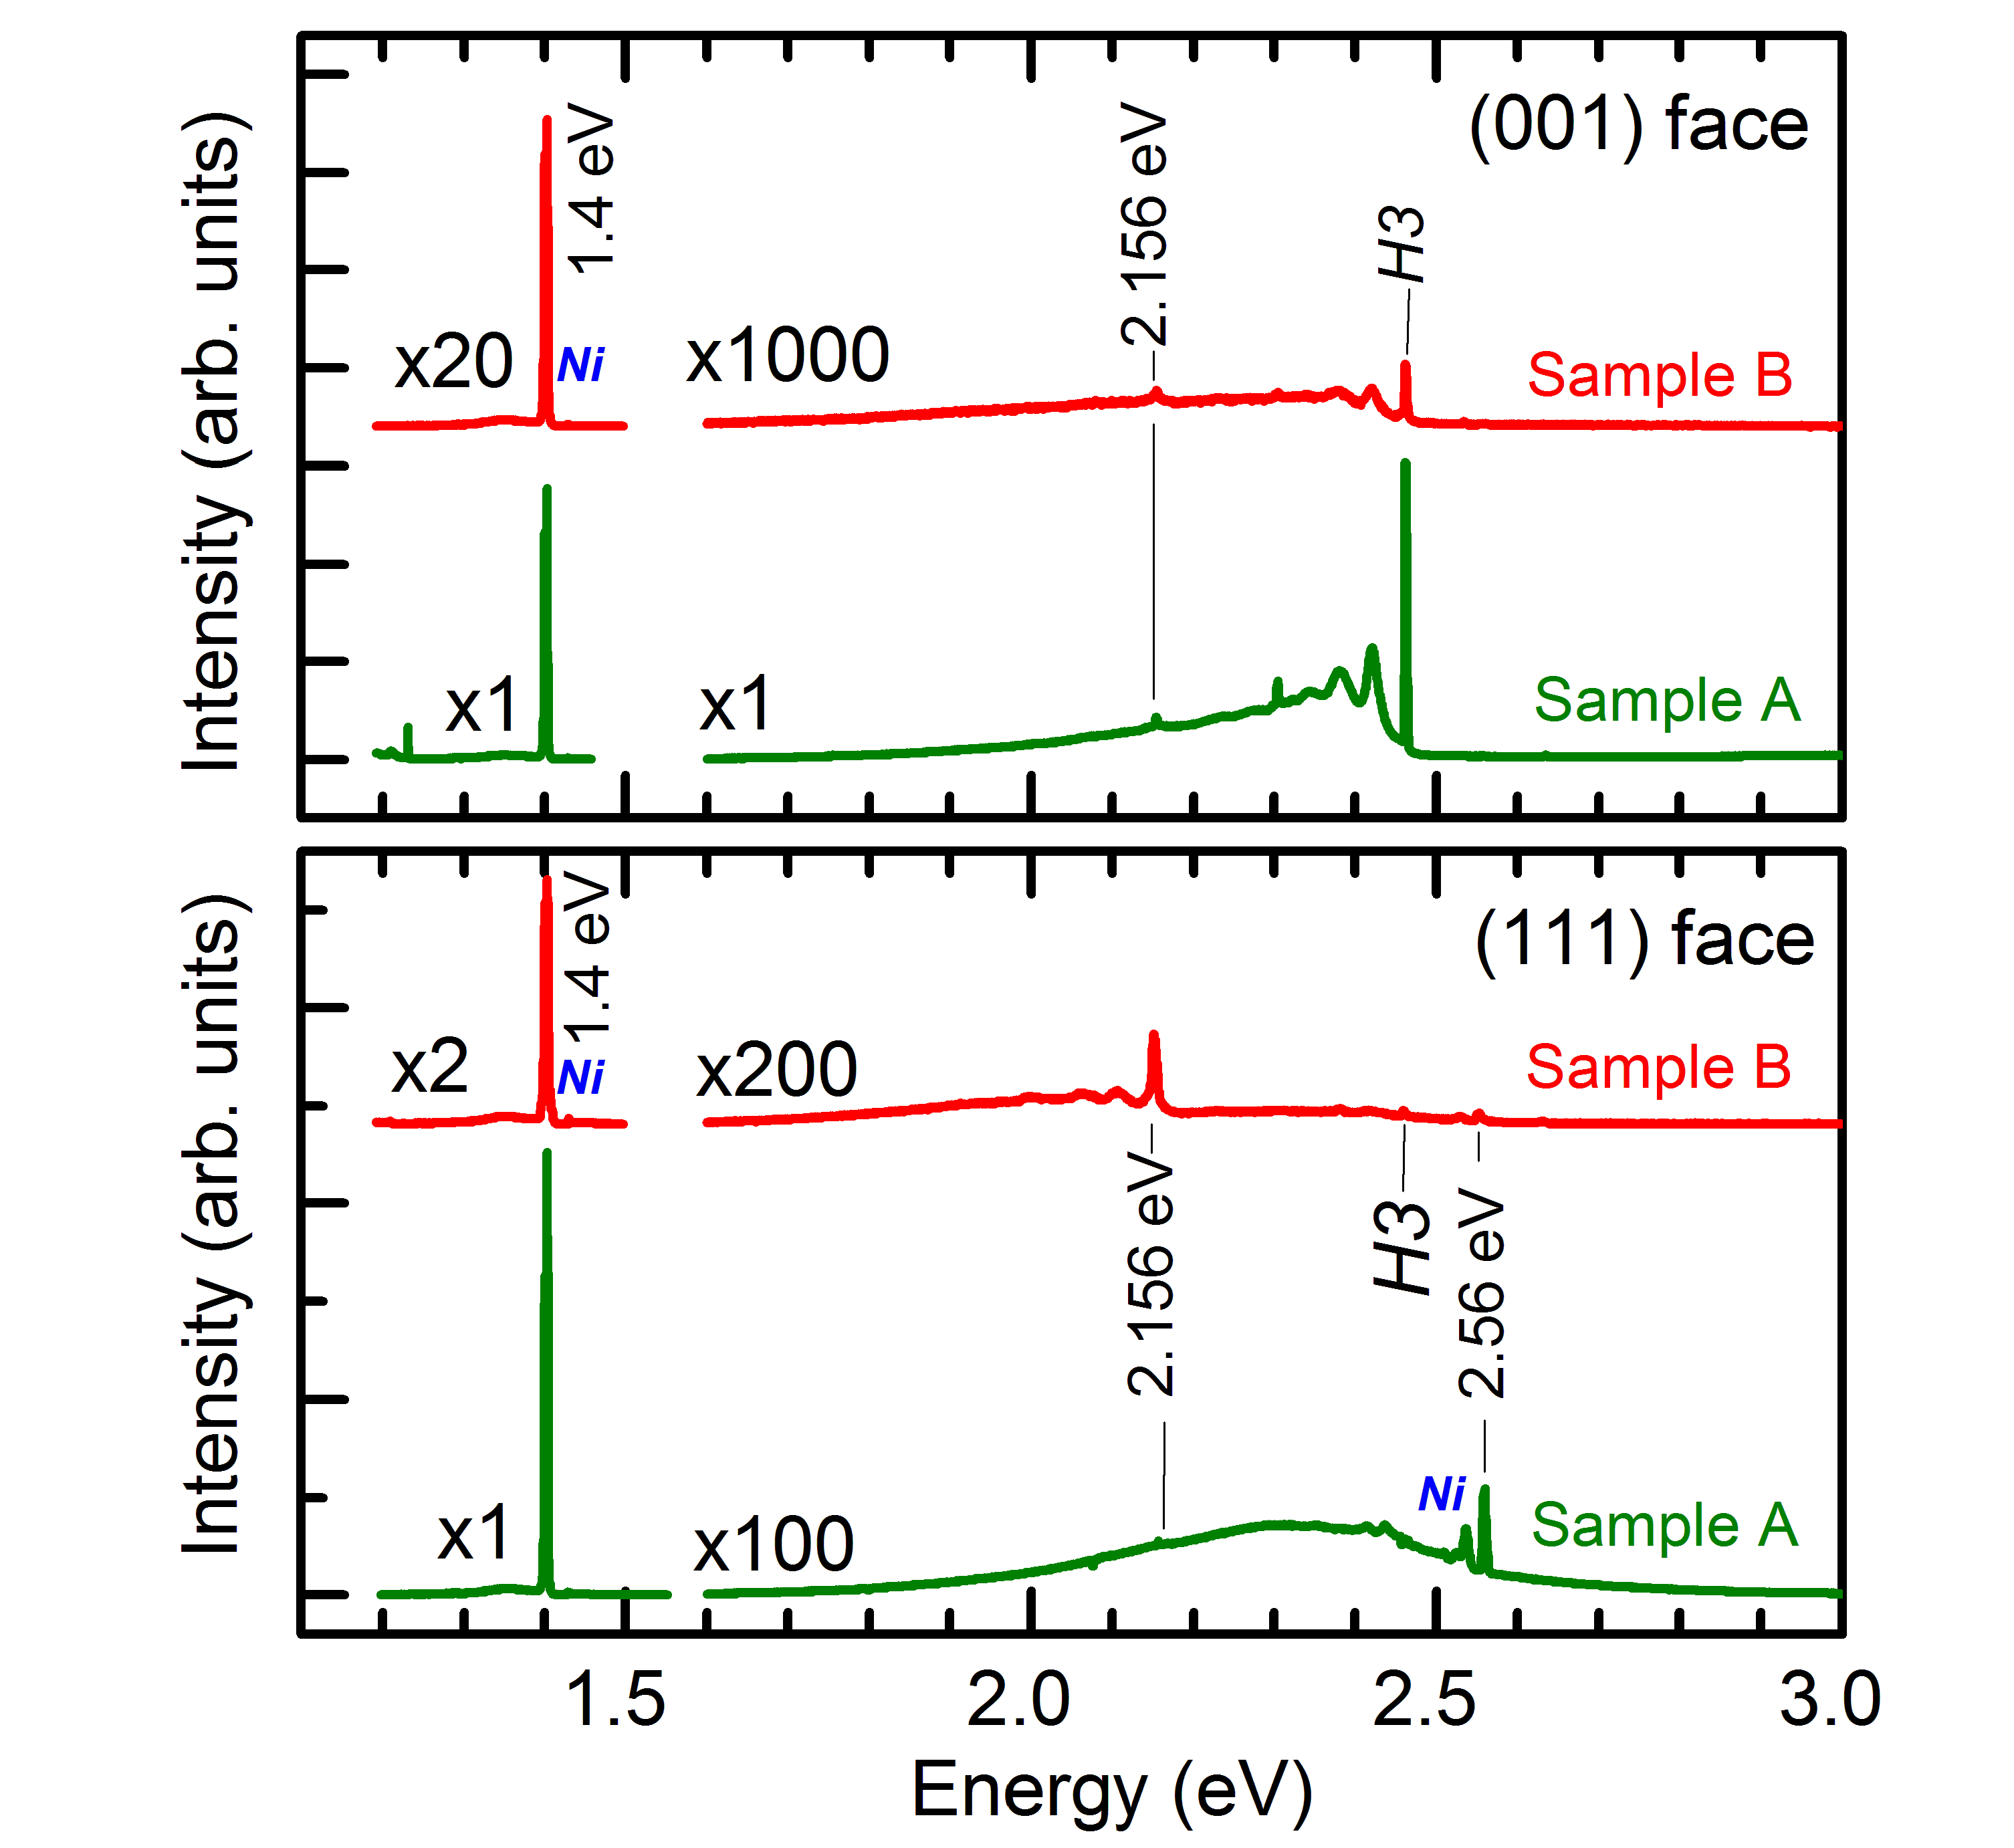
For Sample B, grown without the nitrogen getter, the cathodoluminescence spectra recorded on (100) and (111) growth sectors exhibits mainly the eV center (Fig. 1), which can be attributed unambiguously to a defect containing a single nickel atom Davies et al. (1989). Nitrogen related centers H3 ( eV, attributed to nitrogen VNV complex) and eV (attributed to neutral NV complex) also appeared, but with stronger H3 signal on the (100) sectors and stronger eV signal on sectors. A nickel related peak at eV was also observed on the (111) growth sector, suggesting a stronger incorporation of Ni in the (111) growth sectors, in agreement with previous studies. Note that no signal corresponding to W8 centers, related to substitutional Ni were observed.Isoya et al. (1990b); Nazaré et al. (2001) For Sample A, grown with the nitrogen getter, the intensity of the eV lines is significantly larger compared to Sample B. Spectra recorded on the growth sector reveal the eV Ni related center, with very weak N related signals. This suggests a much stronger incorporation of Ni in growth sectors compared to .
II.2 Magnetization
Information concerning the incorporation of Ni can also be obtained from magnetization measurements. Between room temperature and K, the magnetic moment of Sample B is proportional to field (Fig. 2(a)) with a negative slope, i.e. negative susceptibility of . This is close to the diamagnetic susceptibility of diamond () and as expected shows no temperature dependence. Below K an additional contribution appears, increasing in intensity as the temperature decreases. This contribution is attributed to a paramagnetic component. This assignment is confirmed by the good agreement (see Fig.2(a)) with a Brillouin function approach,
| (1) |
with
| (2) |
The total magnetic moment being
| (3) |
where is the Ni quantum number, the Landé factor, the Bohr magneton, the Boltzmann constant, the temperature, the concentration of paramagnetic centers and the applied magnetic field. The fit was performed assuming and leaving as the only free parameter. A value of corresponds to isolated nickel in the Ni oxidation state (), assuming and . A concentration of paramagnetic centers cm-3 was deduced. Note, a value of () or lower value () would reduce or increase accordingly. Nevertheless, this concentration is in the order of magnitude of the expected incorporated Ni concentration. Such a value corresponds to a Ni relative concentration of i.e. a very diluted magnetic system in which weak interactions between magnetic ions and a paramagnetic behavior are expected. We deduce that nickel is incorporated as isolated, non interacting paramagnetic centers.
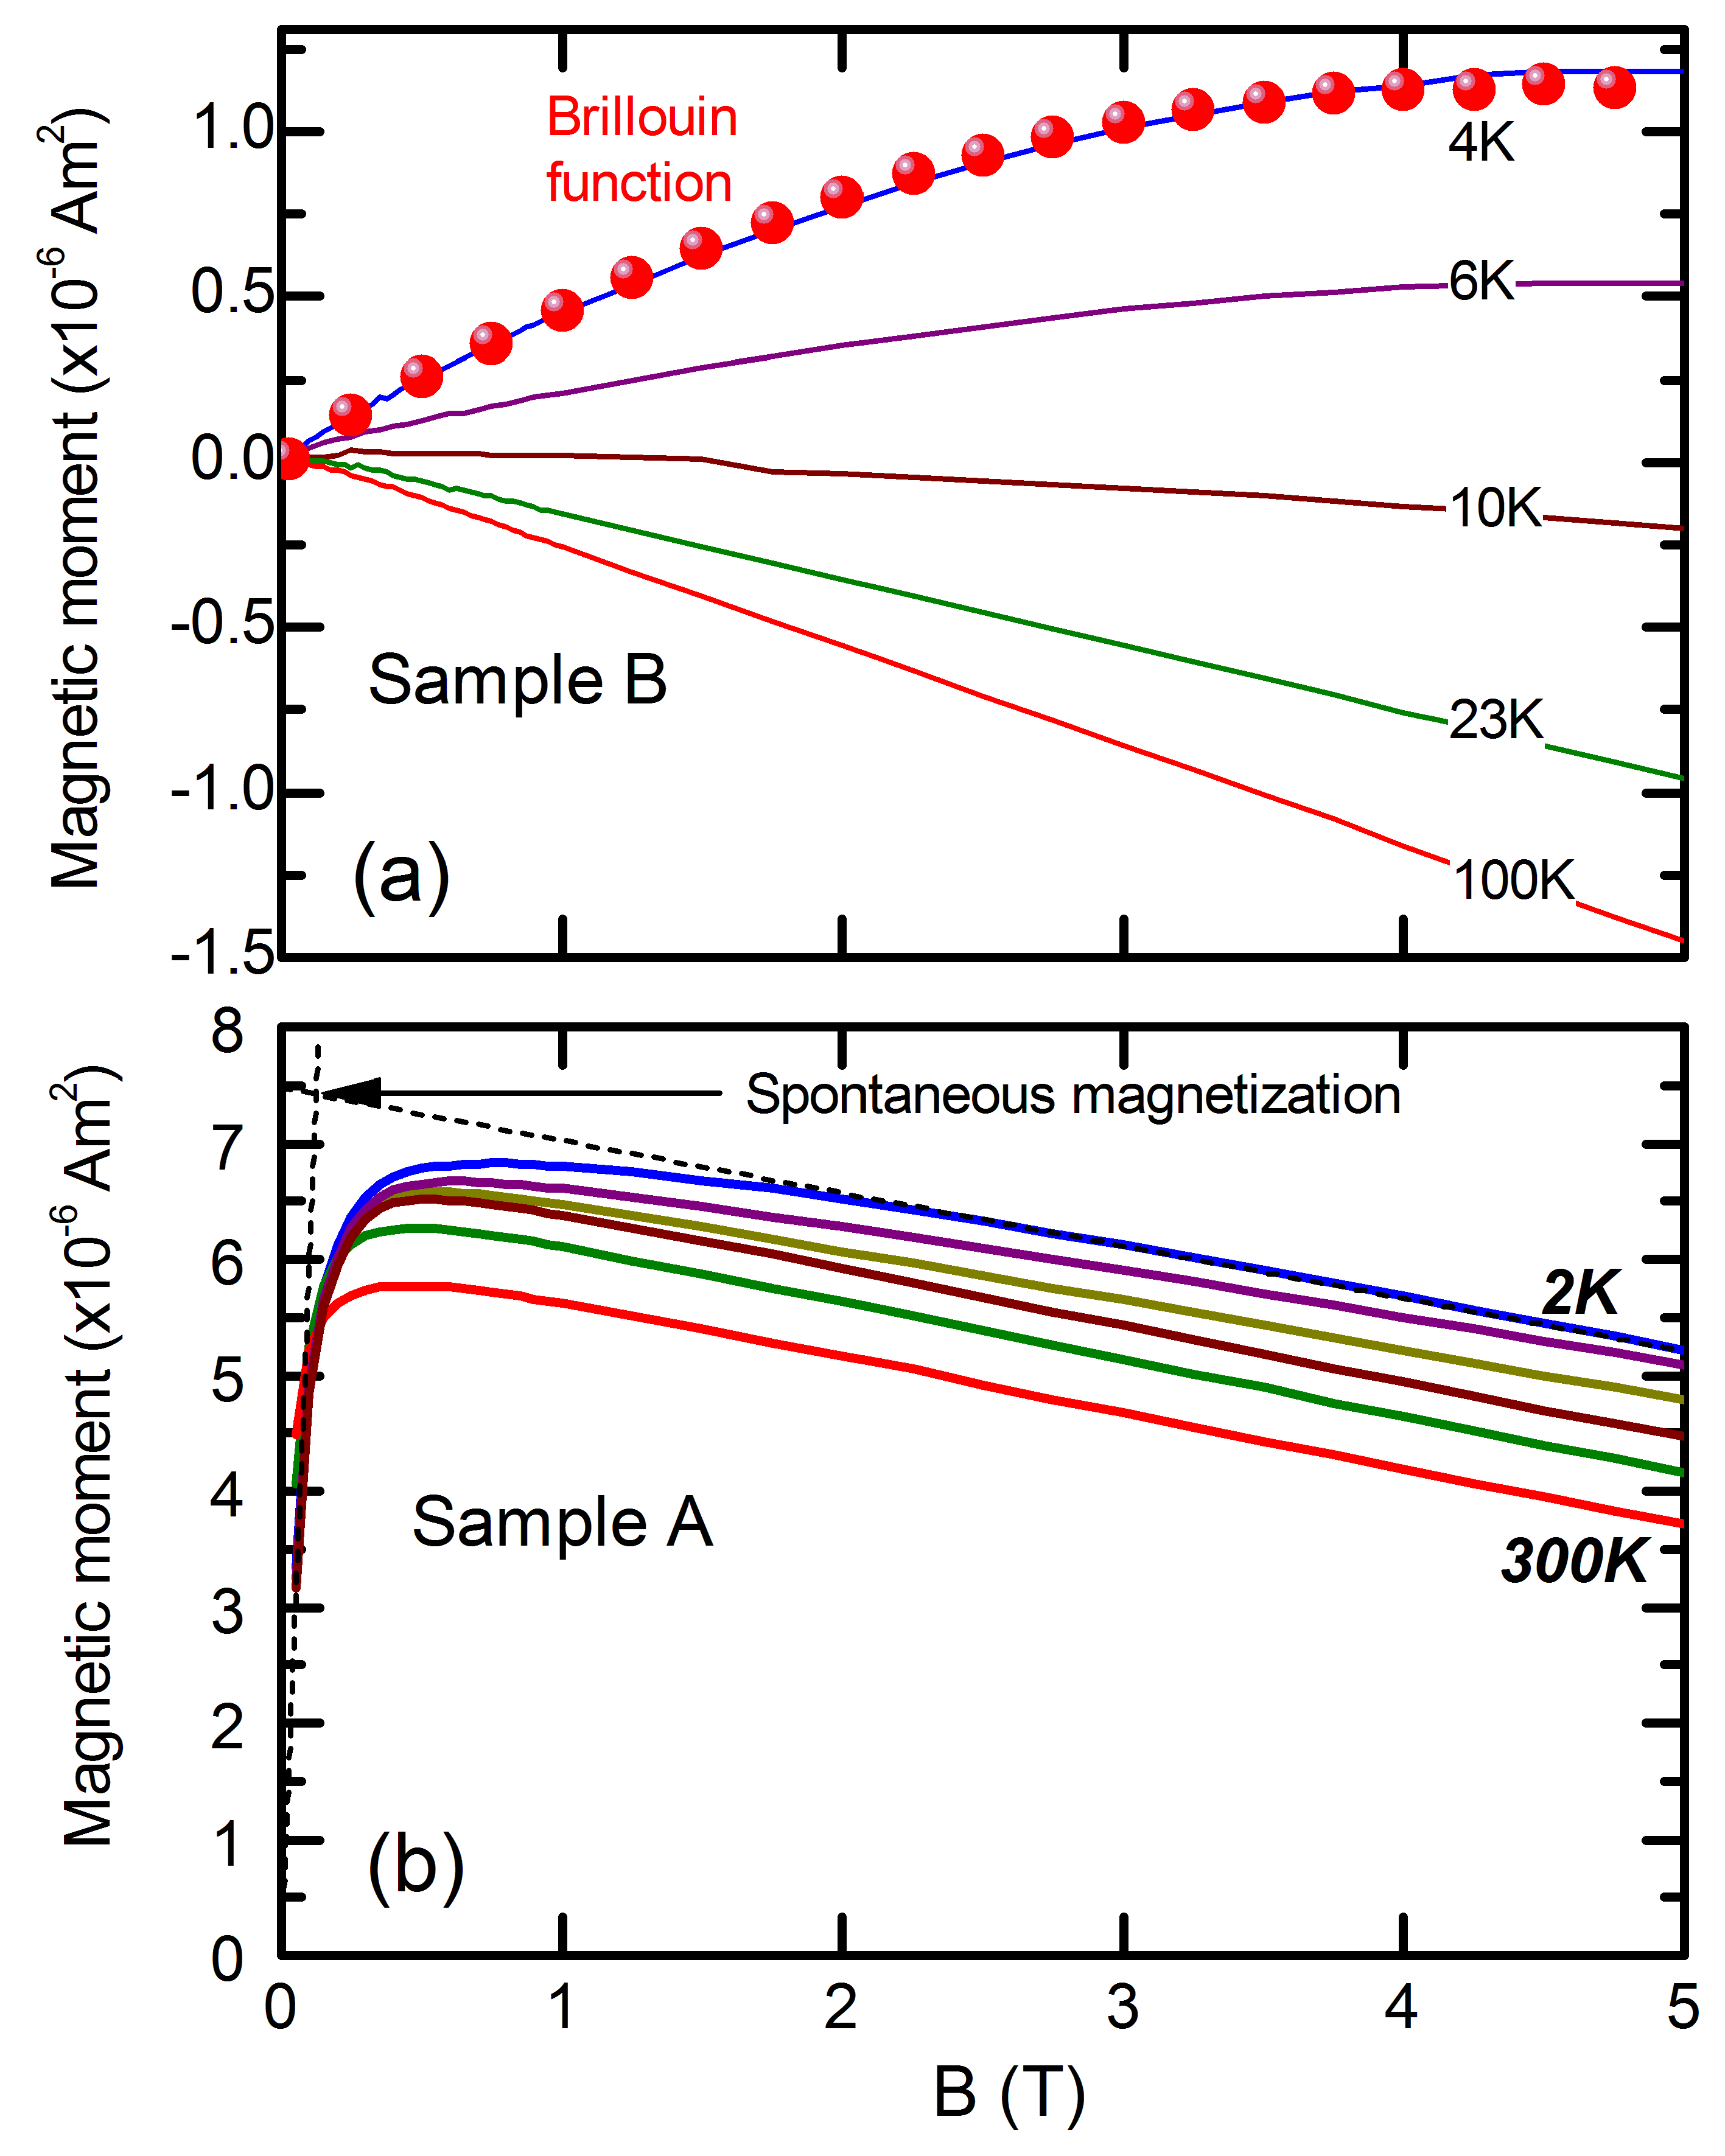
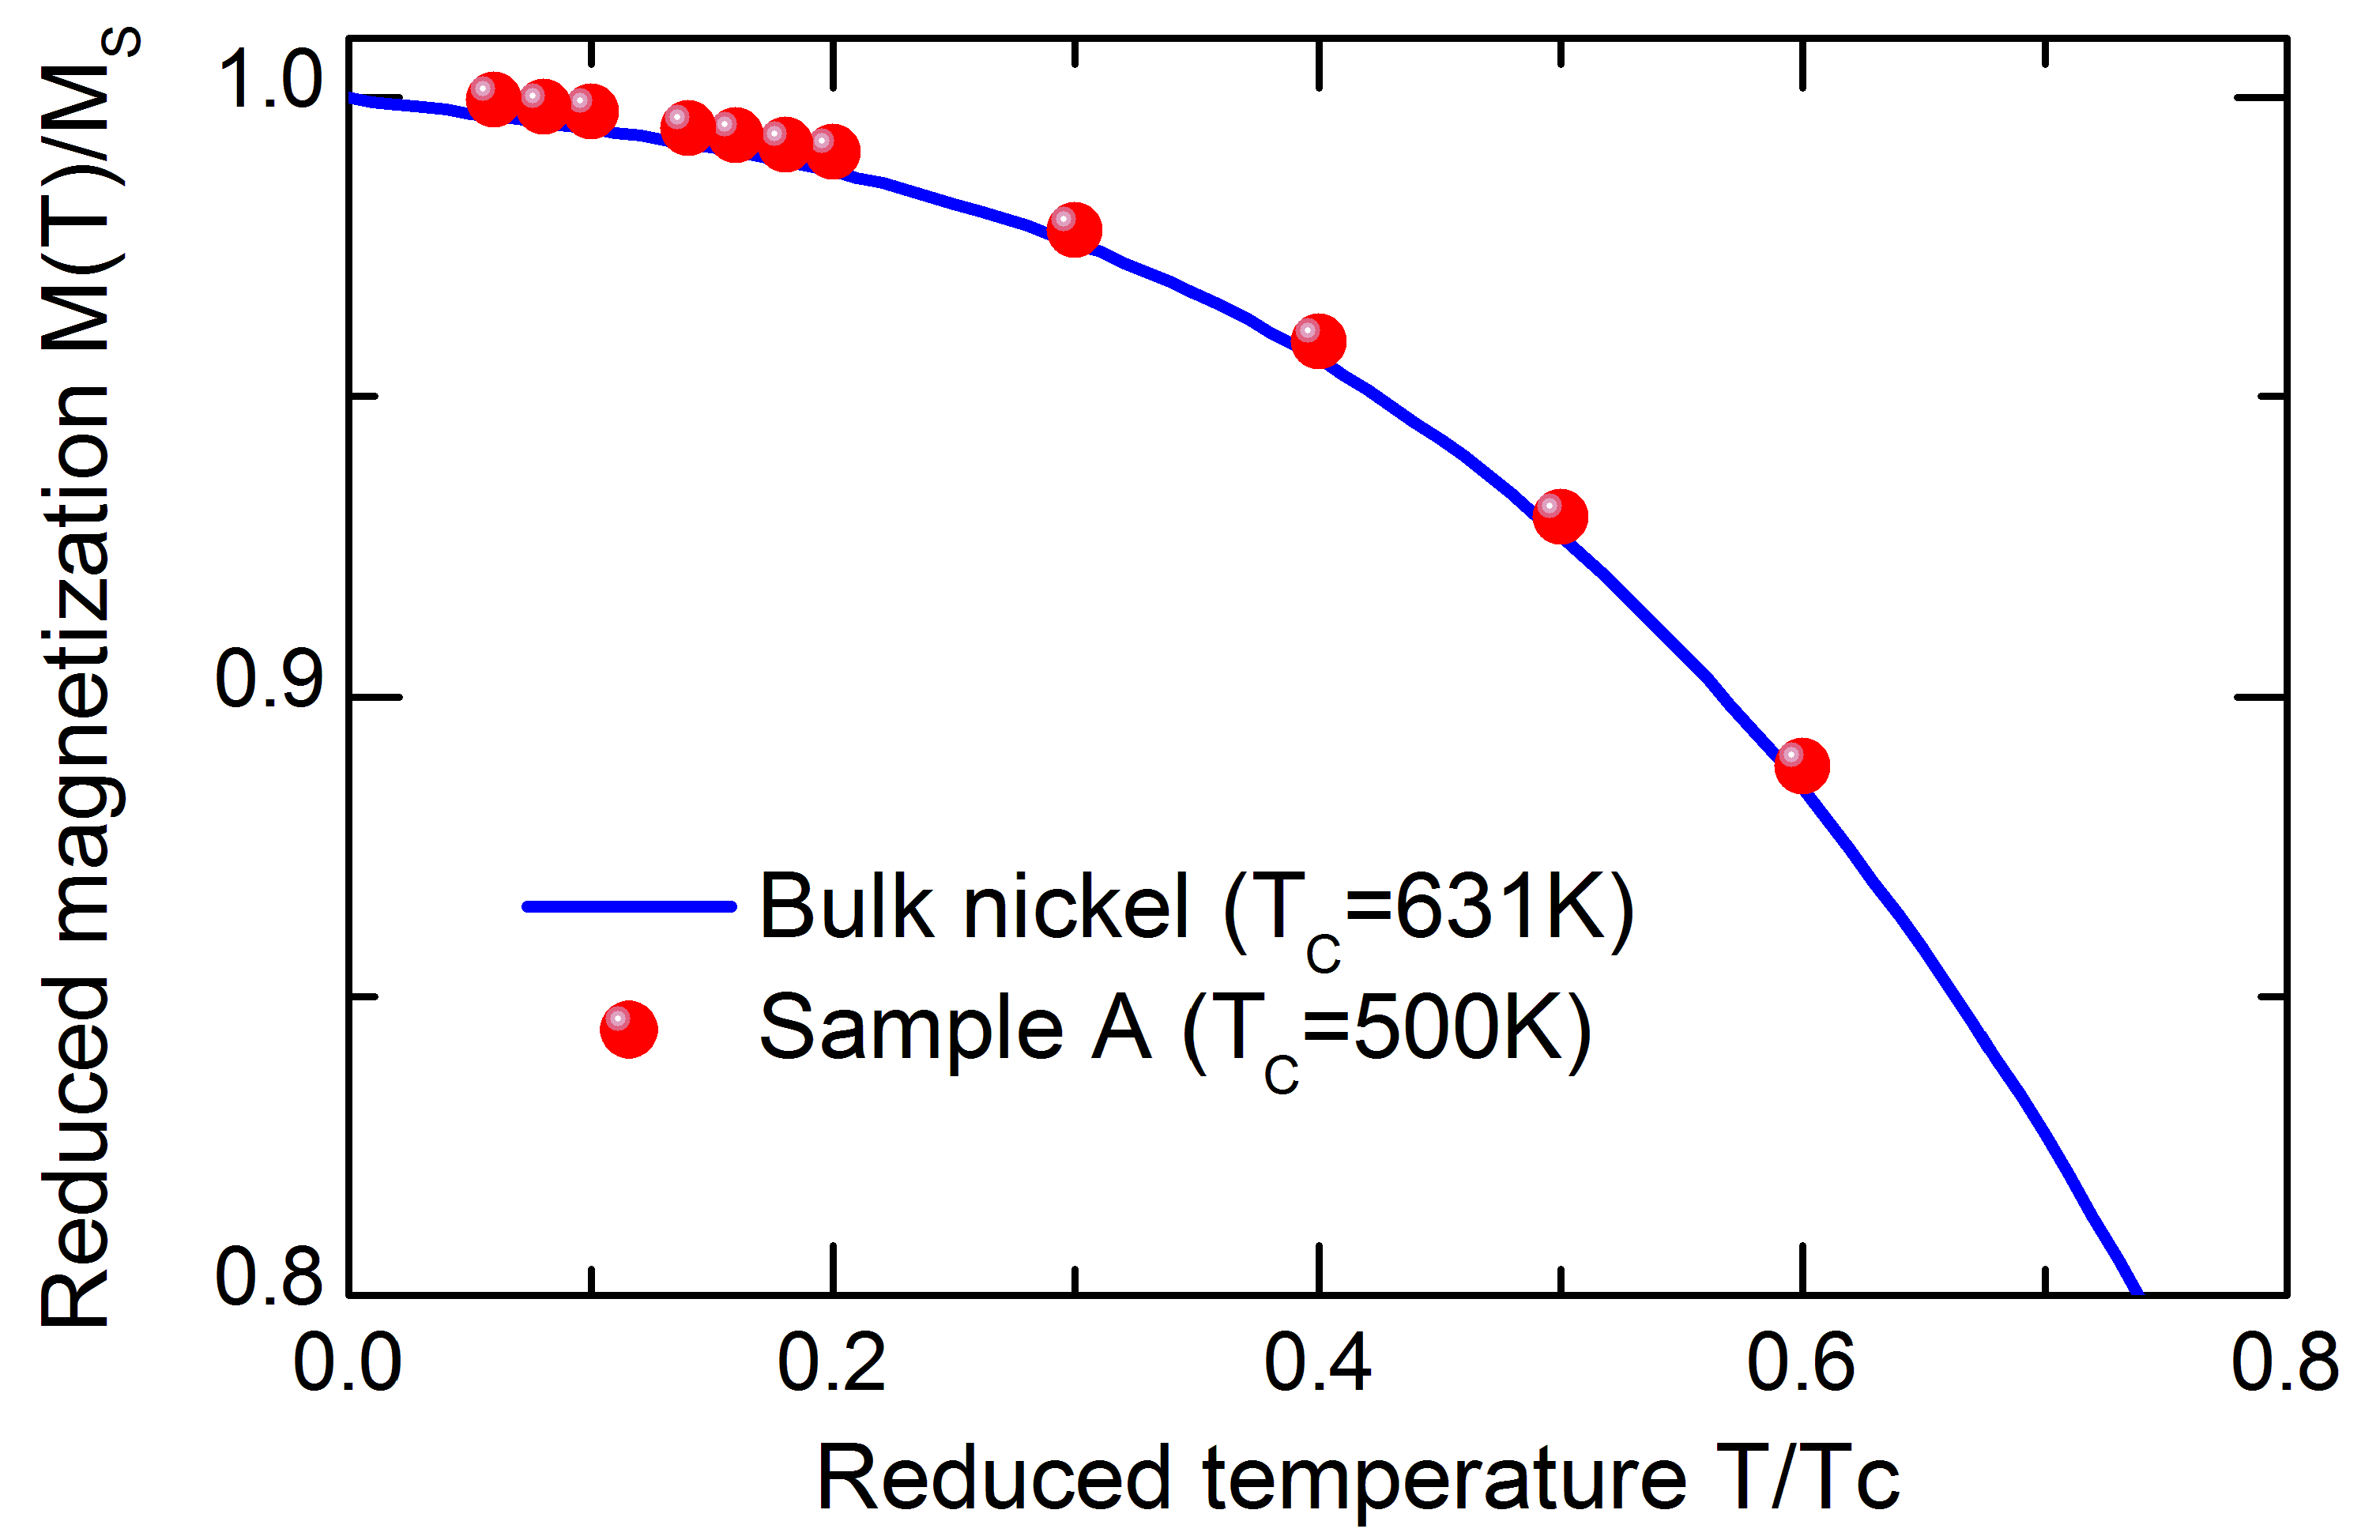
For Sample A the magnetic moment has a very different behavior, as seen in Fig.2(b). A magnetic field as low as T is already sufficient to saturate the magnetic moment even at K, suggesting a ferromagnetic behavior. The linear decrease observed for higher fields is attributed, as before, to the diamagnetic contribution of the diamond matrix. Plots representing the reduced magnetization as a function of the reduced temperature should be similar for bulk nickel and for this ferromagnetic sample. Under such an assumption, the temperature dependence of the experimental magnetization (Fig. 3) corresponds to a K Curie temperature, 20% smaller than the one of bulk nickel ( K). This suggests the presence of nickel clusters, with a reduced Curie temperature due to size-effects. The low temperature spontaneous magnetic moment of Am2 gives a nickel concentration of cm-3, assuming a , which has the same order of magnitude as for Sample B.
The strikingly different magnetic behavior of both samples indicates the strong influence of nitrogen on the incorporation of Ni in diamond. Without nitrogen (i.e. with a much lower N concentration than Ni concentration), as in Sample A, Ni tends to form clusters, reducing the concentration of isolated nickel and the crystal is ferromagnetic. With nitrogen, no ferromagnetic behavior is observed, the nickel atoms are diluted into the crystal as paramagnetic centers. This suggests a lower formation energy for Ni-N complexes compared to Ni defects such as interstitial Ni, substitutional Ni and NiV. This is in agreement with first principles theoretical investigation of nickel related complexes in diamondLarico et al. (2009).
III Effective spin Hamiltonian
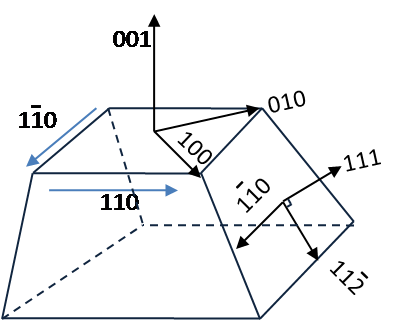
Before presenting the magneto-photoluminescence results we briefly outline NND effective spin Hamiltonian, Nazaré et al. (1991) for trigonal interstitial Ni+ with the electronic configuration and effective spin , which is required to understand the data. The principle crystallographic orientations of the HPHT diamond crystals investigated here are presented schematically in Fig 4. It is possible to define four sets of local axes (see Table 1) corresponding to the four different possible orientations of the trigonal axis of the defect. The quantization axis is parallel to the axis. The perturbation of the magnetic field is given by the following Hamiltonian,
| (4) |
where is the Bohr magneton and the quantization axis is the trigonal axis of the center.
The energy separation of the excited and ground state is large enough to ignore any interaction between them. The secular matrix describing the perturbation of the magnetic field on the ground state doublet is,
| (5) |
where meV is the spin orbit splitting of the ground state and the various terms are the effective Landé -factors. The secular matrix describing the excited state in a magnetic field is given by,
| (6) |
The secular matrixes can easily be diagonalized either numerically or analytically. We have done both and verified that the results are identical. The analytic expressions for the ground and excited states are,
| (7) |
The magnetic field lifts the degeneracy of the ground and excited states which split into four and two levels respectively. The energy of the possible optical transitions is simply the energy difference between all levels in the 2A excited state and all levels in the 2E ground state. Thus, taking into account the four possible orientations of the defect axis (see Table 1), we expect a maximum of lines in the spectrum depending upon the orientation of the magnetic field. When the magnetic field is aligned along a symmetry axis the number of transitions with different energies is greatly reduced.
| Label | Z | X | Y |
|---|---|---|---|
IV Magneto-photoluminescence
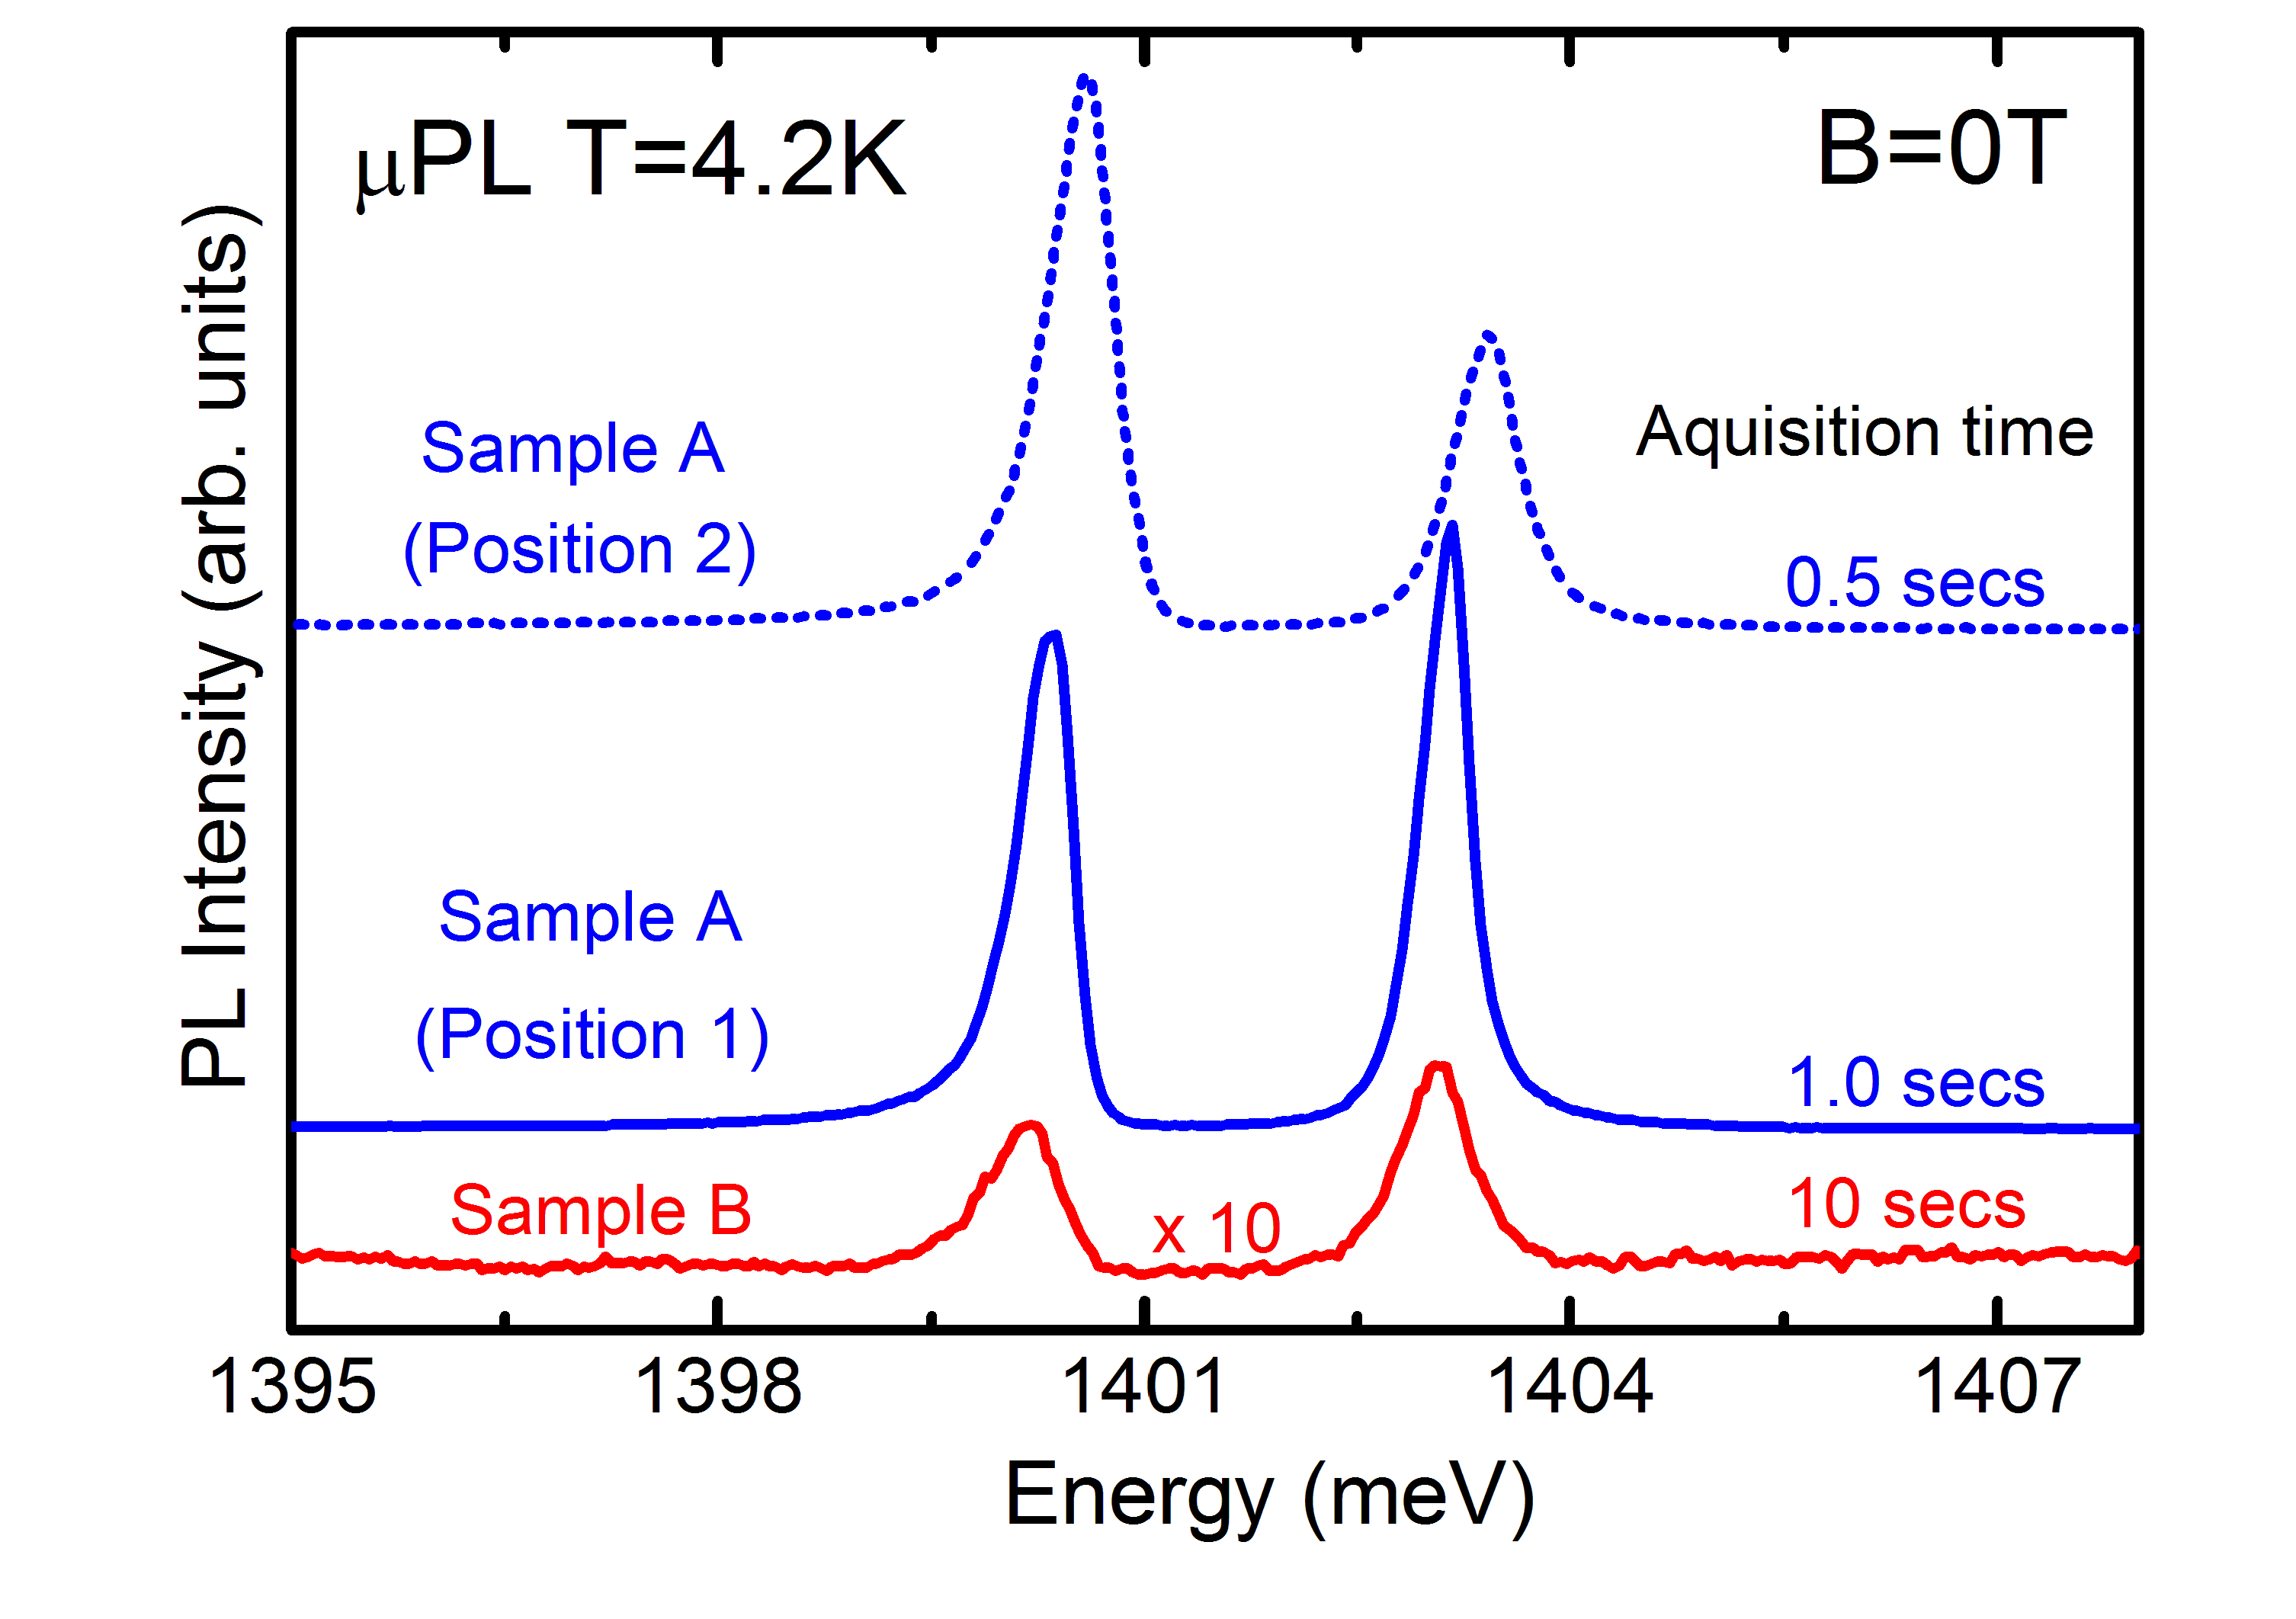
Micro photoluminescence (PL) in dc magnetic fields up to T and macro photoluminescence (PL) in pulsed magnetic field up to T have been performed. For both experiments an optical fiber was used for the excitation and collection of the emission from the sample. A CW Ti:Sapphire laser tuned to nm or a CW solid state laser at nm was used for the excitation. The emission spectra have been measured using a spectrometer equipped with a CCD camera. For the macro PL the sample was placed at the end of the fiber with a diameter of 50 m2. In PL measurements light was focused on the sample using a microscope objective coupled with a mono-mode fiber. The size of the laser spot on the sample was around m2. The sample was mounted on piezo translation stages which allows spectrally resolved spatial mapping in magnetic field. The measurements were performed at K with the magnetic field applied parallel to (Faraday configuration) and normal to (Voigt configuration) the direction of propagation of the light. A number of different orientations of the crystal with respect to magnetic field have been measured on the (111) and (001) faces. Typical optical spectra, for both samples, measured at low temperature and at zero magnetic field are presented in Fig 5. A characteristic zero-phonon doublet is observed at and eV. The doublet structure originates from the meV splitting of the ground state due to a combination of spin orbit interaction and trigonal distortion. The asymmetric line shape is the result of unresolved Ni isotopic splitting. Nazaré et al. (1991) For sample A representative spectra recorded at two different locations are shown. The small shift of the energetic position and the slightly different doublet splitting observed in the spectra probably indicates indicates a different local strain. Nazaré et al. (1991)
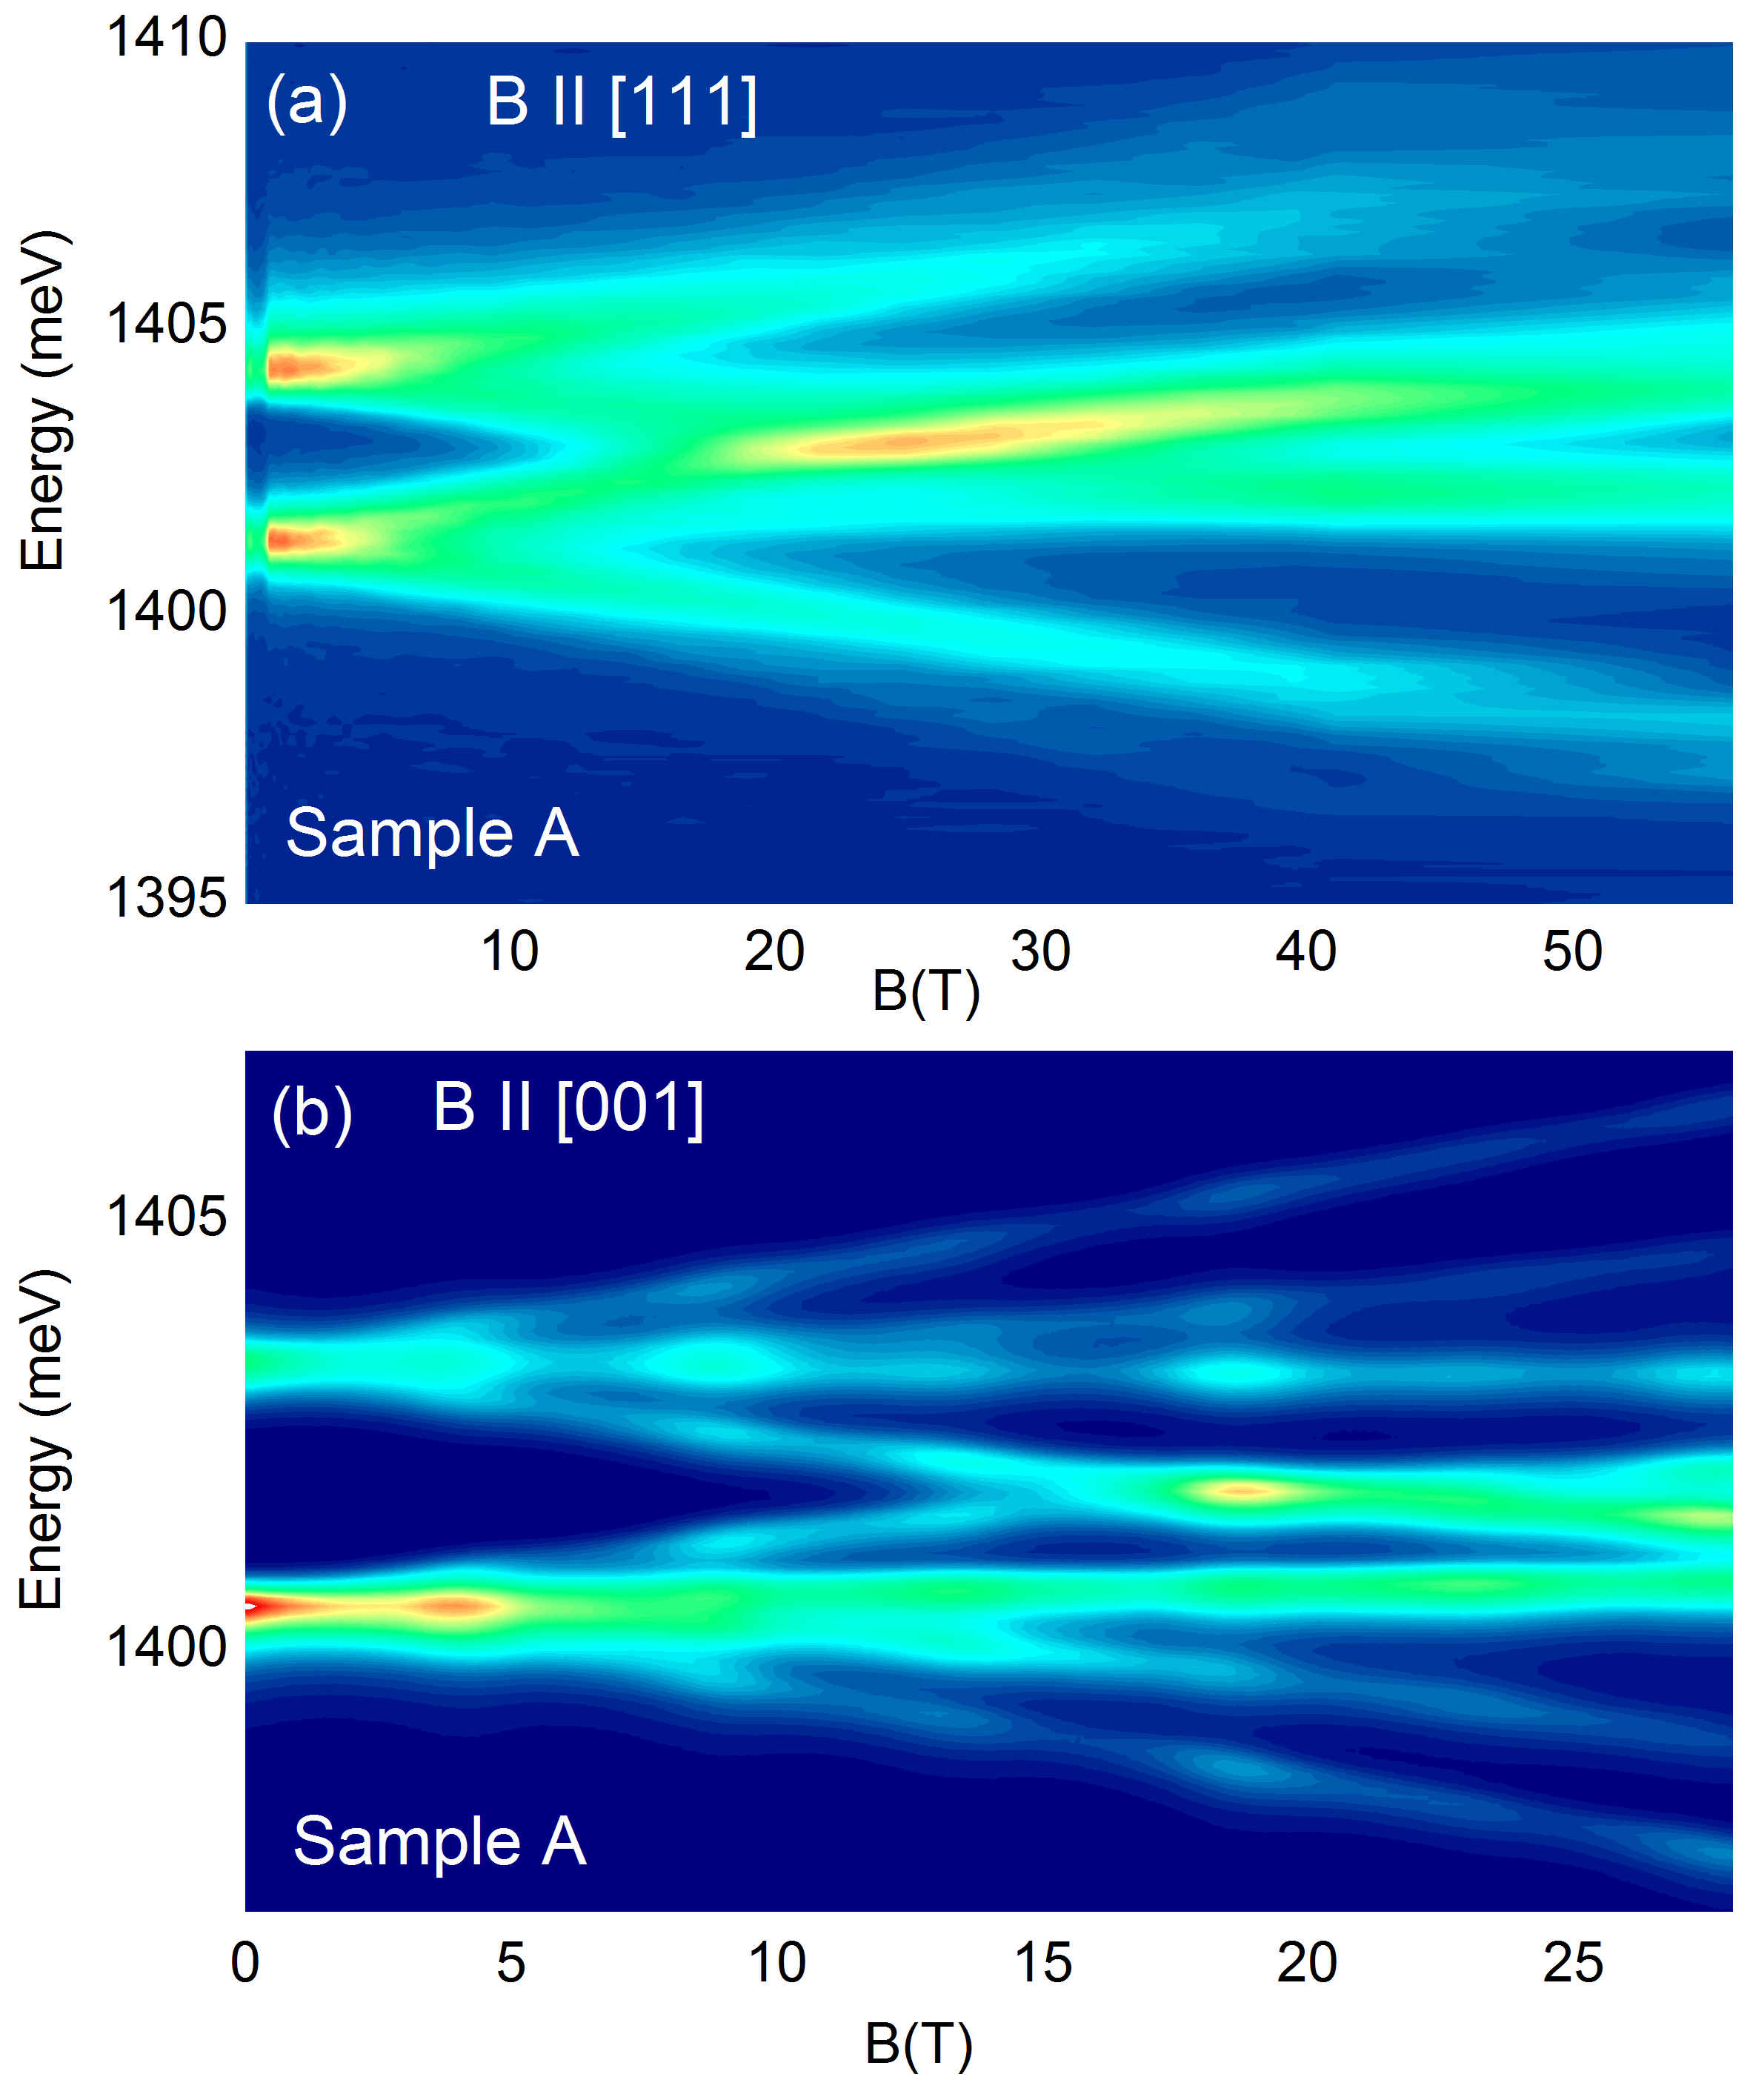
The intensity of the eV emission from sample B was too weak to be measured in pulsed magnetic field, where typical integration time is of the order is ms. Both samples were measured using -PL in dc magnetic field up to T. Selected representative macro and micro magneto-photoluminescence spectra for sample A are presented in Fig 6(a-b) respectively. The spectra were taken in the Faraday configuration on the (111) face with (Fig 6(a)) and on the (001) face with (Fig 6 (b)). For both experimental configuration we observe a splitting on the zero phonon doublet into multiple lines due to the Zeeman effect. In order to compare the experimental results with the predictions of the effective spin Hamiltonian the energy of each transition was extracted from the PL spectra by fitting a Gaussian function.
IV.1 Macro-photoluminescence on the (111) face
Using both Faraday and Voigt configurations as appropriate, the macro-photoluminescence has been collected on the (111) face with the magnetic field aligned along the experimentally available symmetry axes of the defect (i.e. perpendicular to the face or parallel or perpendicular to certain edges of the face - see Fig.4). The energy of the observed optical transitions for , and is plotted as symbols in Fig.7(a-c). Only a few transitions are observed with most spectra showing only four lines. The simplicity of the observed spectra immediately suggests that the defect axis is preferentially aligned along the growth direction of the face. NND already reported a preferential alignment of the defect axis along one of the directions.
Making this assumption we fit the transitions energies calculated with the effective spin Hamiltonian. The configuration for a defect aligned along , i.e. the axis, is a particularly easy case to fit since all the off diagonal terms in the secular matrices are zero and only the parameters and play a role ( which controls the splitting of the excited state which is not resolved here is determined later from the high resolution -PL measurements). Using the NND parameters in Ref.[Nazaré et al., 1991] as a starting point we have fitted the data. Subsequently, the other orientations, and were simulated to extract and . The results of such a fit are shown by the solid red lines in Fig.7(a-c). The agreement is extremely good apparently confirming the trigonal symmetry and preferential orientation of the defect axis along the growth direction. For the aligned defect there is no difference between the and orientations since these directions represent the local and axes which are equivalent. This is confirmed by the almost identical evolution of the observed transition energies for the two directions (Fig.7(b-c)).
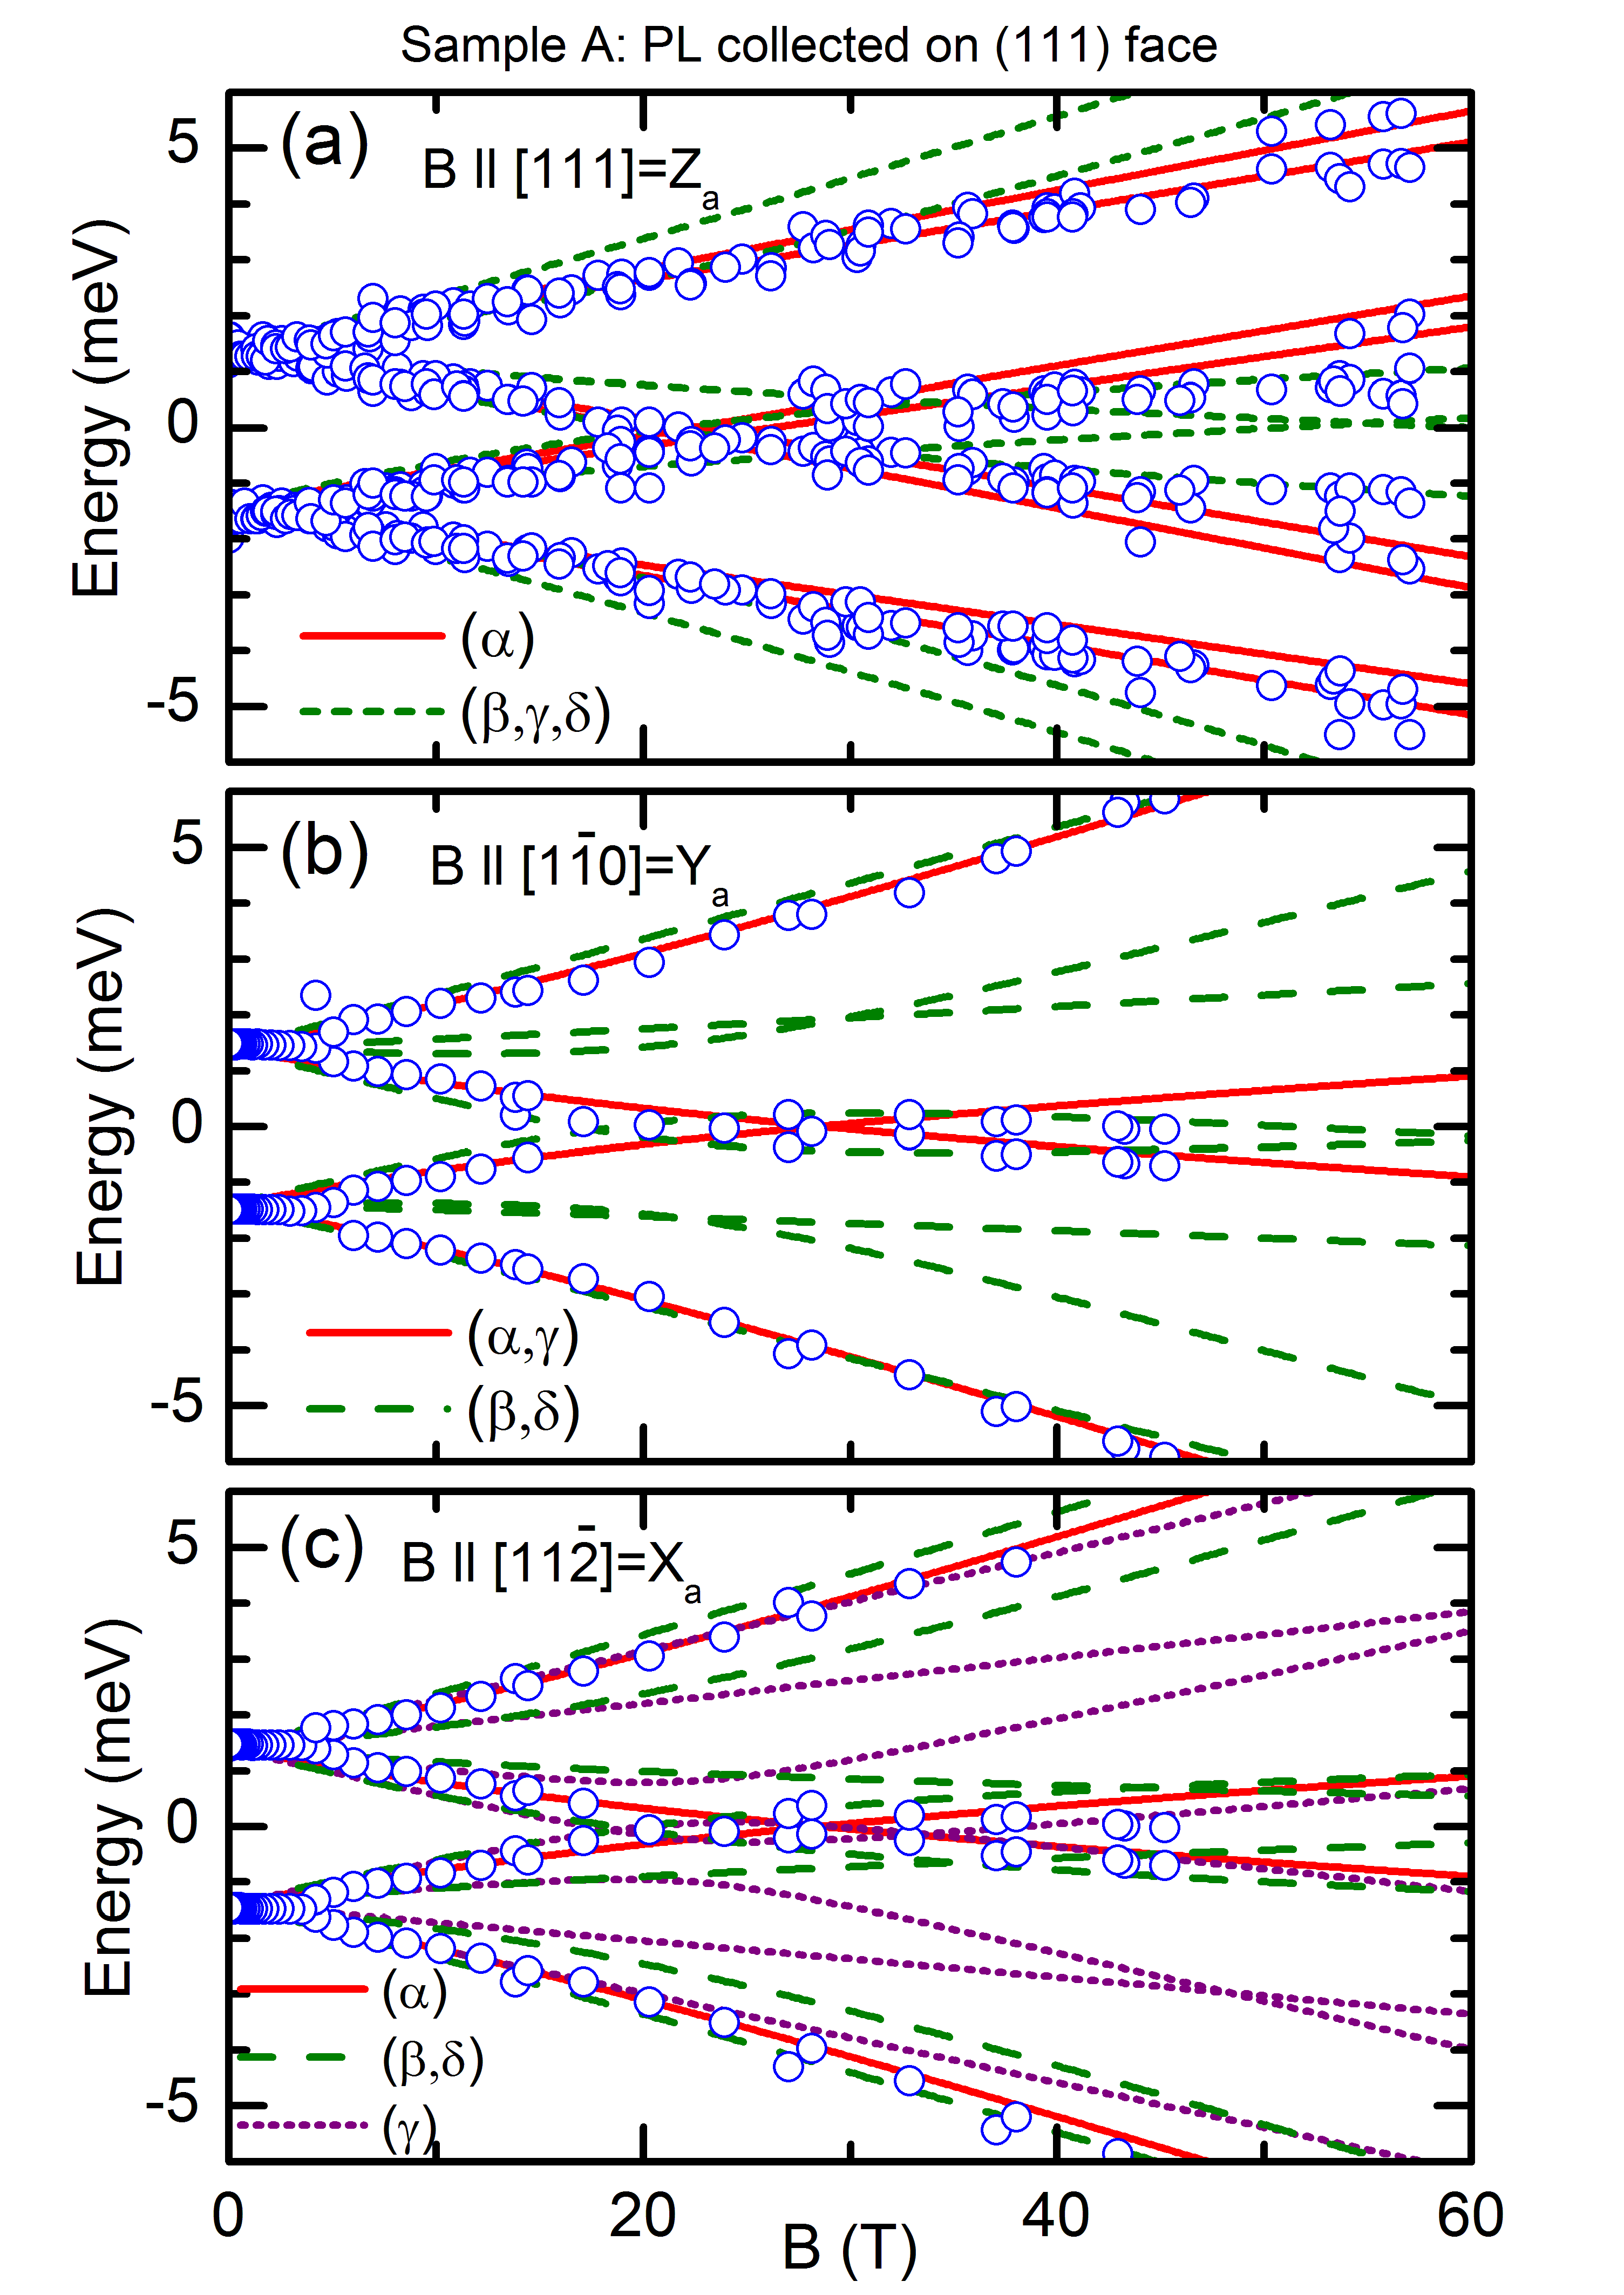
For the green broken lines are the calculated transition energies for defects with their axis aligned along the and directions. Clearly these transitions are not reproduced in the data. However, from this orientation we can only say that the defect is either aligned along the or the directions for which the projection of the magnetic field onto the local axis have the same magnitude so that the transitions are degenerate (red solid lines). It is the data which tells us definitively that the defect is aligned along ; the projection of the magnetic field is different for all the other directions and the calculated transitions for the (purple dotted lines) defect orientation are clearly not observed.
IV.2 Macro-photoluminescence on the (001) face
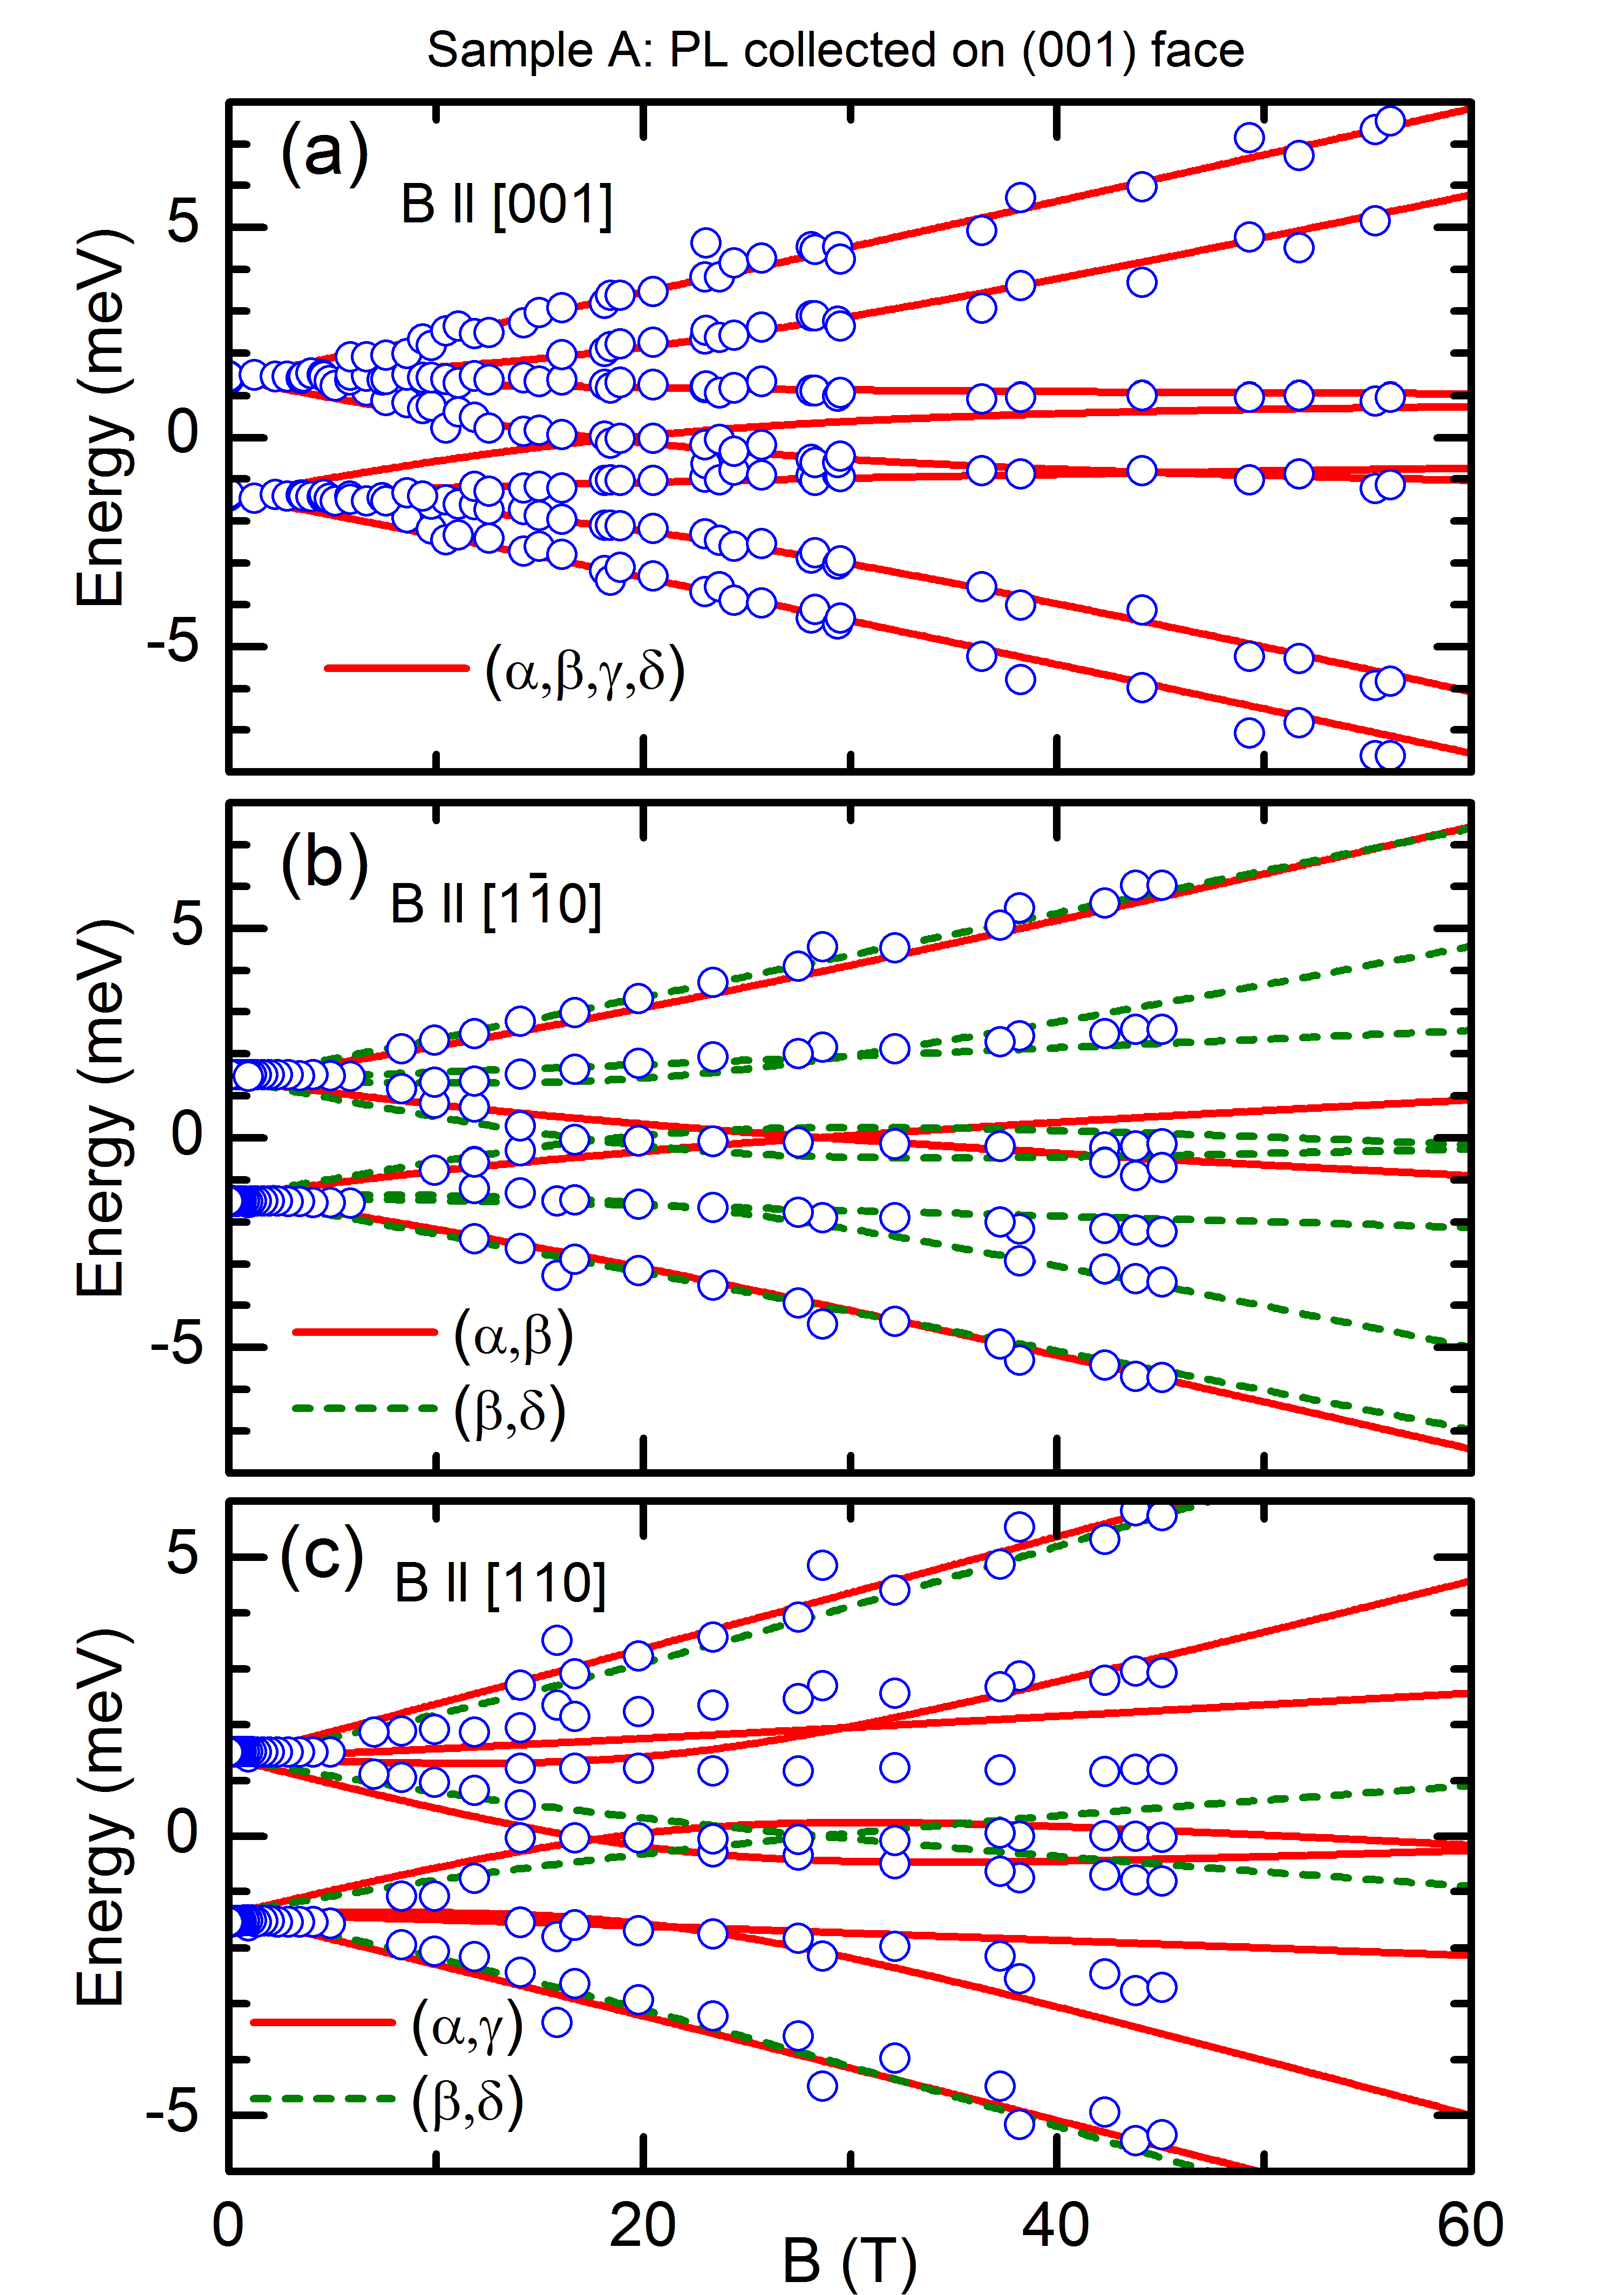
As before, using both Faraday and Voigt configurations, macro-photoluminescence has been collected on the face with the magnetic field aligned along the experimentally available symmetry axes of the defect. The energy of the observed optical transitions for , and is plotted as symbols in Fig.8(a-c). In contrast to the (111) face, we find that there is no preferential orientation of the defect axis. The observed transitions have been simulated using the NND effective spin Hamiltonian. This fit was performed simultaneously with the fit to the data on the (111) face, allowing a global optimization of the parameters. The parameters found are summarized in Table 2.
For the all the possible defect alignments are equivalent so that no information concerning a preferential orientation can be obtained form this data. Nevertheless, the predictions of the effective spin Hamiltonian (solid red lines) fit the data very nicely. More information can be gained from the and orientations. In Fig.8(b-c), the red solid lines correspond to defects aligned along or and the green dashed lines to defects oriented along or directions. In the case of a preferential alignment one of the two or orientations would have an extremely simple spectrum composed of only four lines. This is clearly not the case; all predicted transitions are observed for both directions. Thus, at least one of the or directions and at least one of the or directions are occupied. The results on the (001) face suggest that the preferential alignment along the [111] direction on the (111) face may be linked to the growth process.
IV.3 -PL measurements
The -PL technique is not as useful for determining the symmetry of the defect since only the Faraday configuration can be used so that the only orientation available is with the magnetic field perpendicular to the face under investigation. It does however have certain advantages; (i) excitation and collection is very efficient which allows the investigation of samples with a low emission intensity and (ii) spectrally resolved maps with a spatial resolution m can be made given information concerning the homogeneity of the diamond crystal. The -PL measurements have been performed at K using a resistive magnet in static fields up to T.
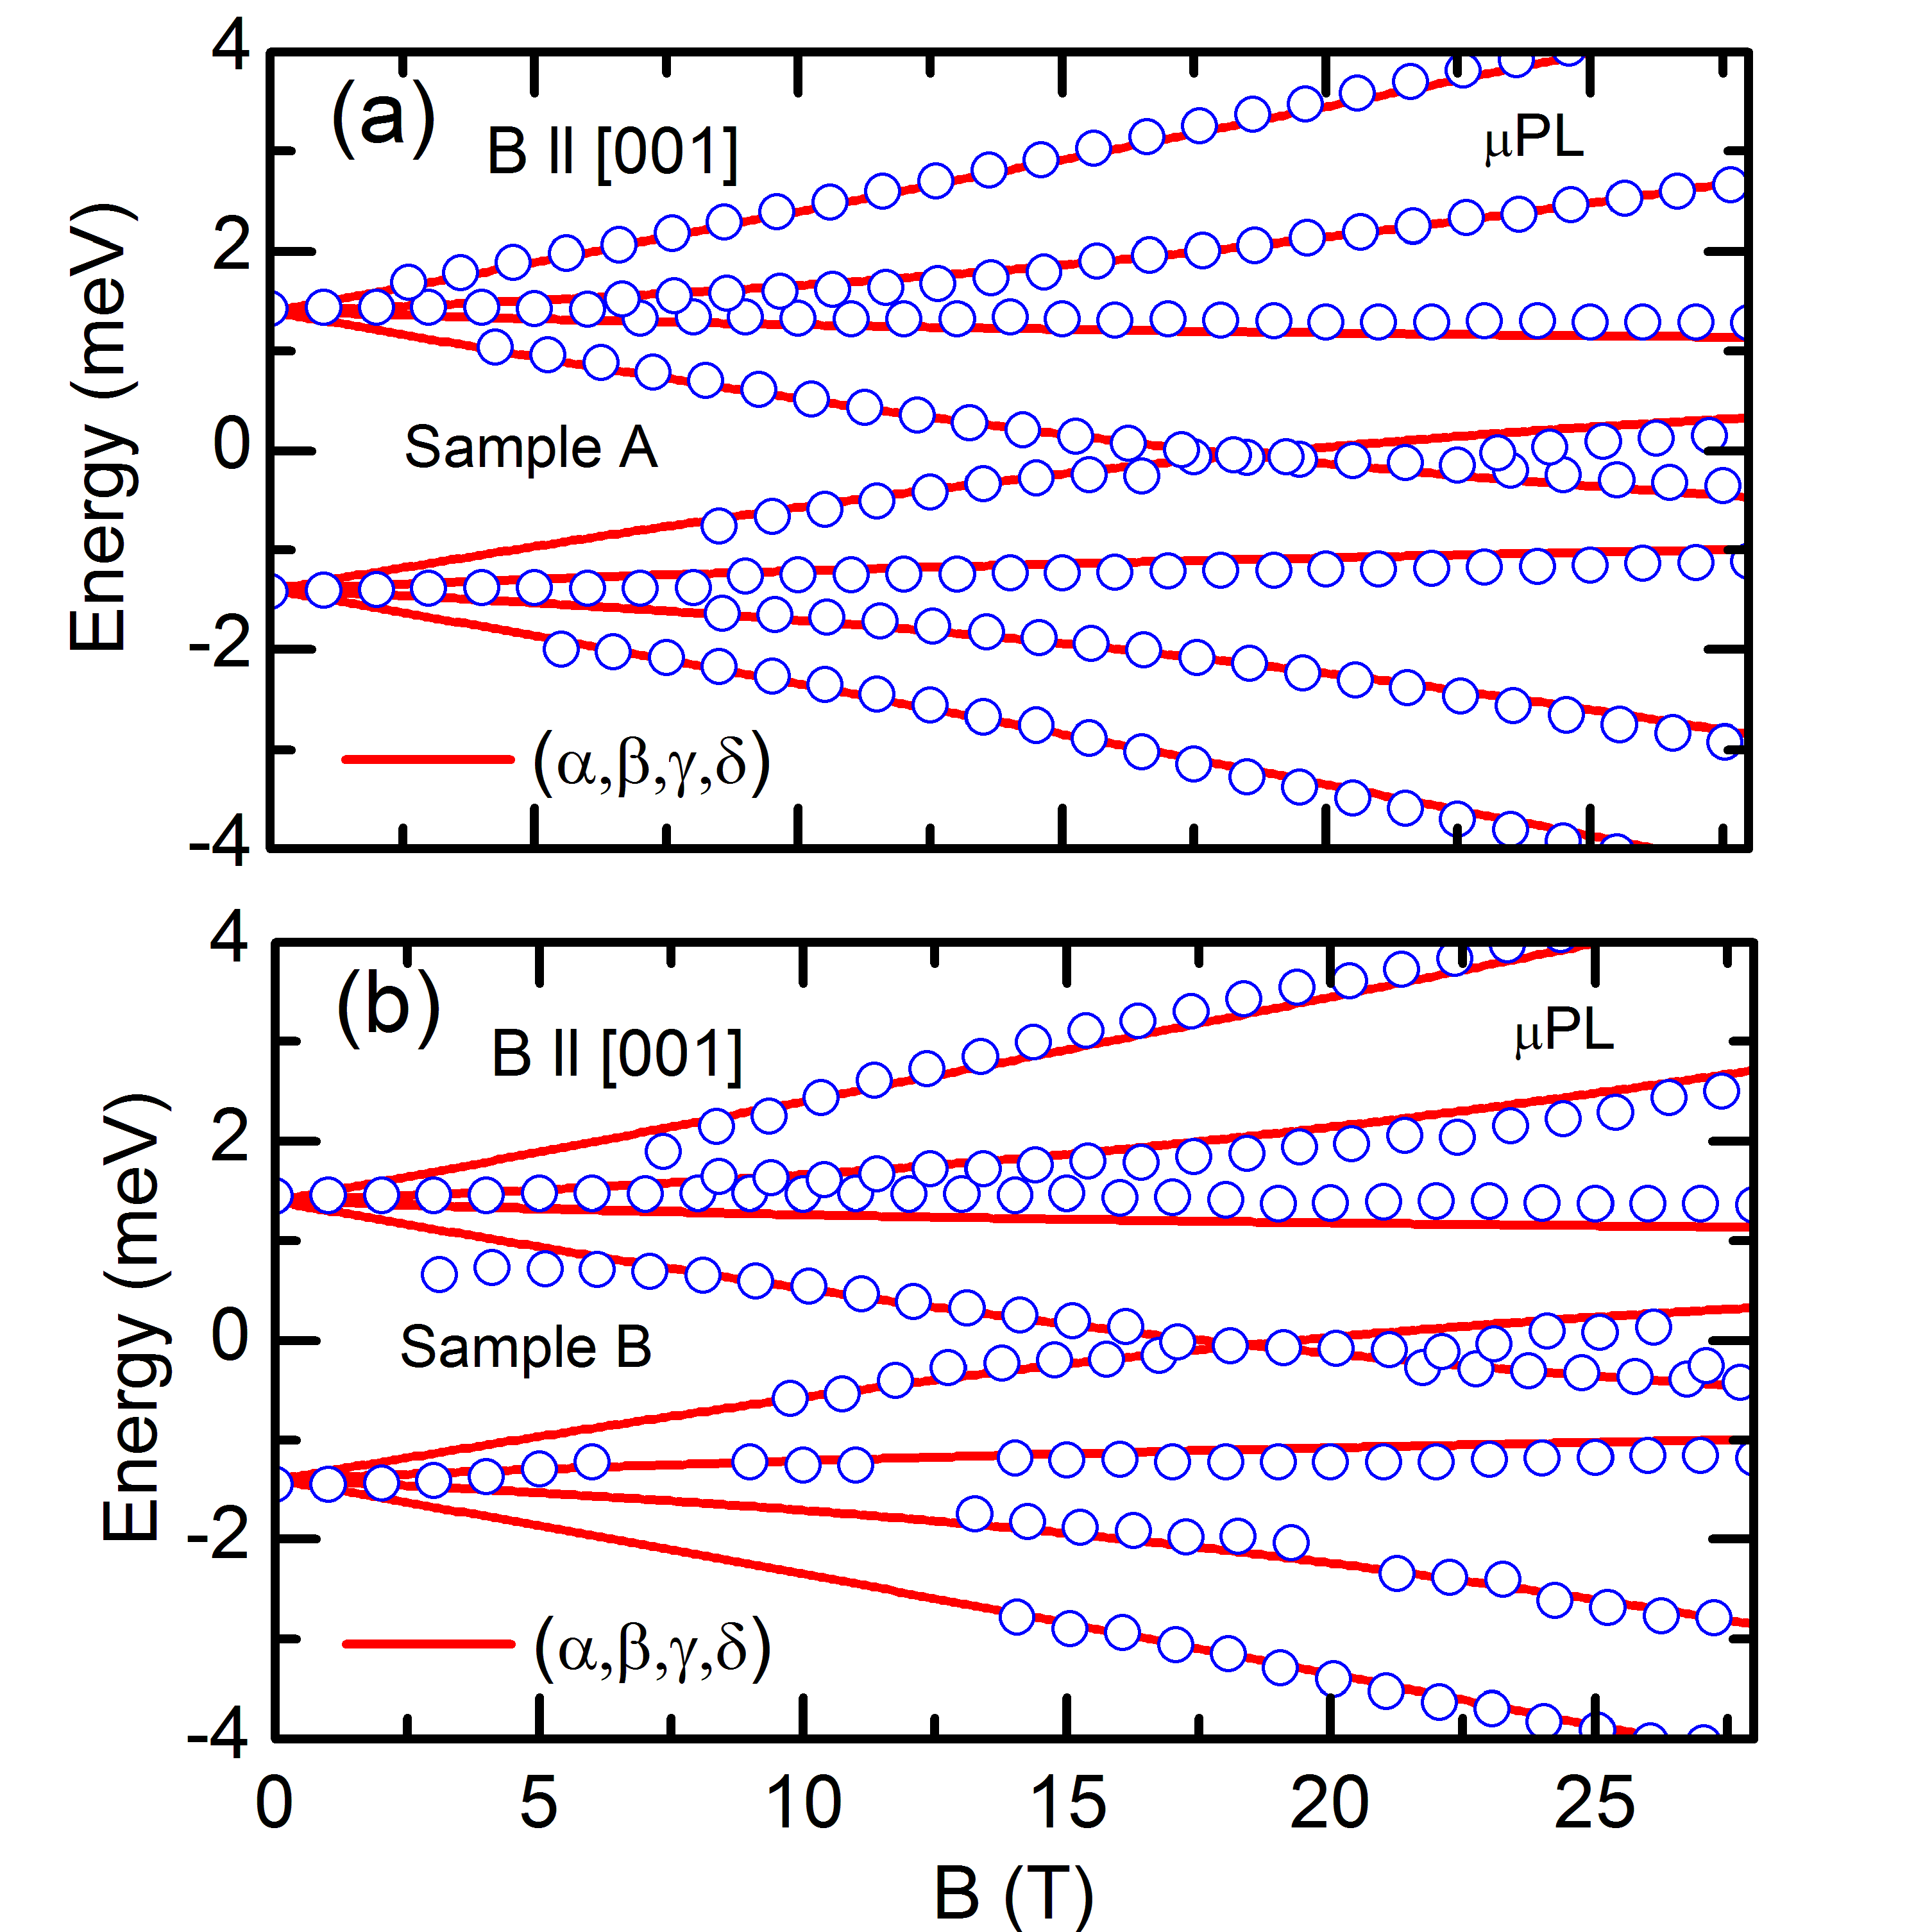
In Fig. 9(a-b) emission obtained from the (001) face of samples A and B is presented (symbols). The results for the two different samples are almost identical despite the approximately two orders of magnitude larger nitrogen concentration of sample B. As the emission intensity from sample B was very weak, fewer transitions are resolved at low magnetic field. The solid red lines are the predictions of the effective spin Hamiltonian using exactly the same parameters as before. As for the macro-PL measurements, the fits are very good for a data set of much higher quality further confirming the trigonal symmetry of the defect. For the (001) face with all the defect orientations are equivalent so that no information concerning defect alignment can be extracted. The nickel concentration in the two samples is approximately equal so that the results suggest that while excess nitrogen reduces considerably the intensity of the PL emission, presumably by forming other complexes with Ni, some of the Ni nevertheless enters the host lattice as eV Ni color centers.
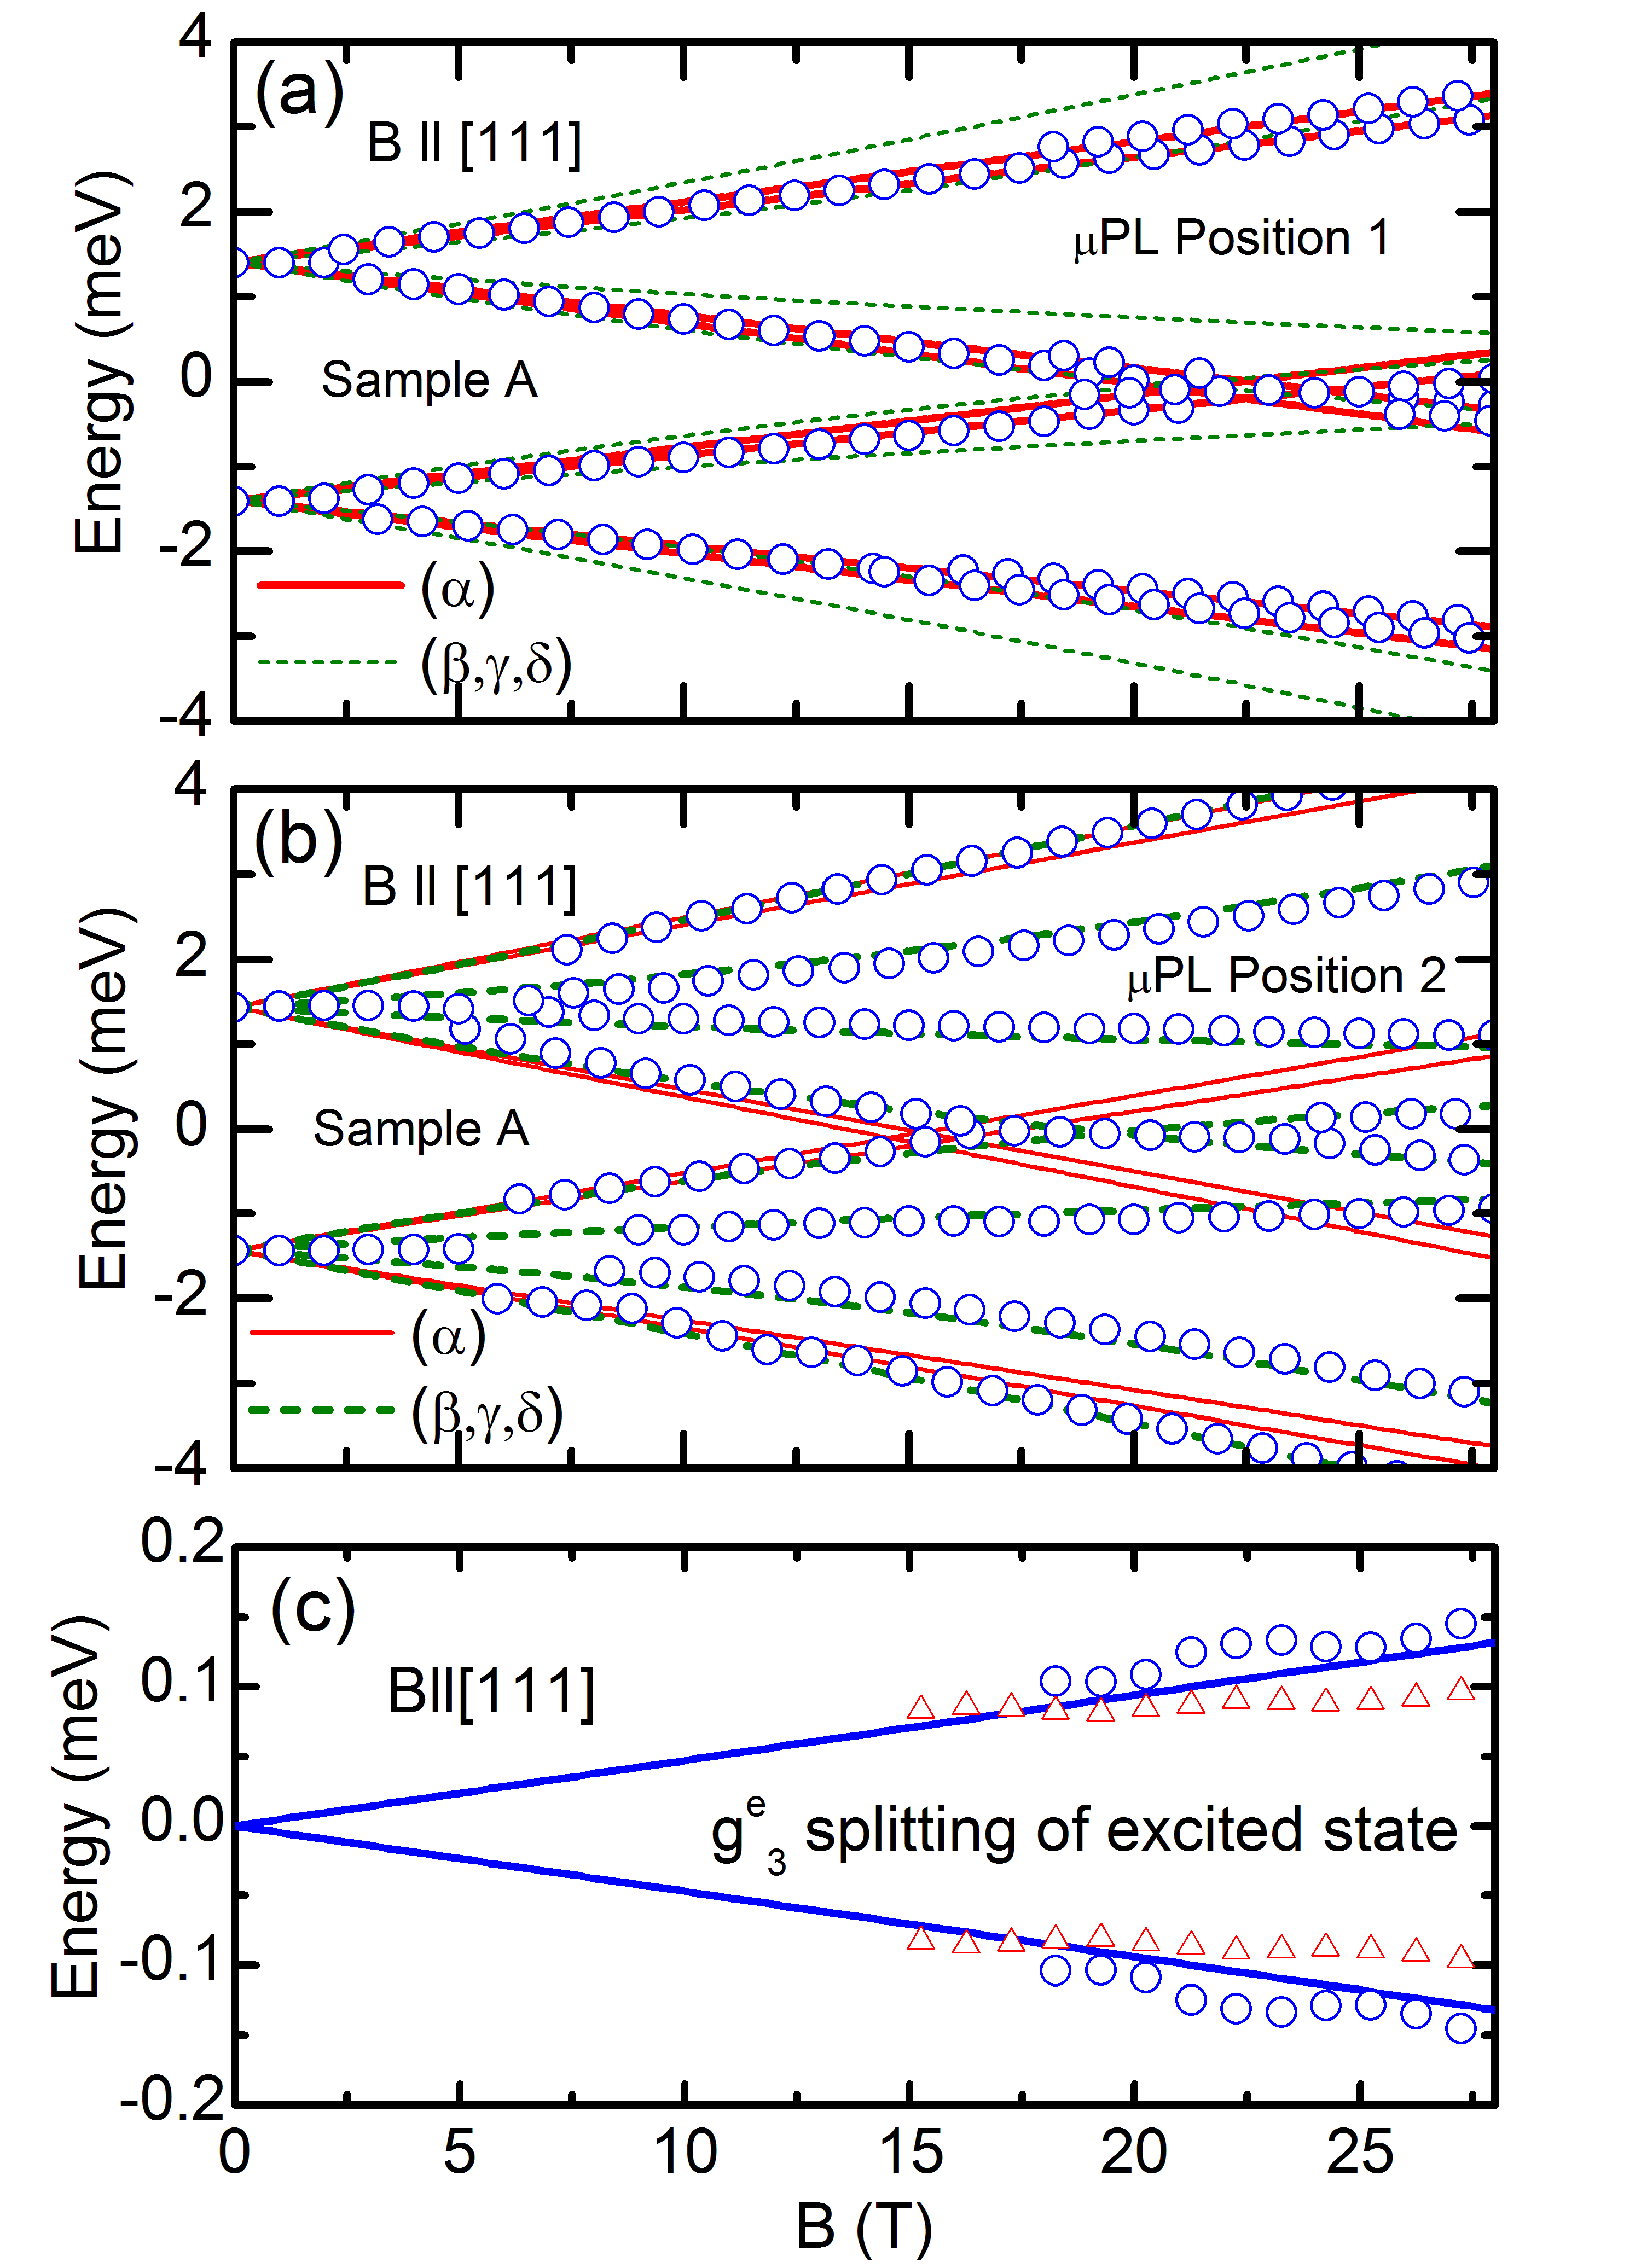
Fig. 10(a-b) shows -PL measurements obtained at two different positions on the (111) face of sample A with . We have performed a full map of the face and position in Fig. 10(a) is representative of most of the (111) face. The behavior is identical to that observed in macro-PL. The predictions of the effective spin Hamiltonian for a defect preferentially aligned along the direction are shown by the red solid lines and the other orientations by the green broken lines. The data is well fitted by the preferentially aligned defect scenario. As emission from position is representative of the (111) face this allows us to conclude that the defect is preferentially aligned along growth direction over most of the (111) face. The splitting of the excited state is also clearly seen in this high resolution low noise data taken in static magnetic fields. See e.g. the splitting of the lowest and highest energy transition in Fig. 10(a) above T. Fitting the Hamiltonian to this splitting it is possible to extract a refined value of which describes the small spin splitting of the excited state with the field applied along the quantization axis. In Fig. 10(c) the excited state splitting is shown; we plot the energy of the split transitions after subtracting the average energy to remove the background. A least squares fit to both data sets (solid lines) gives . The complete set of parameters for the effective spin Hamiltonian is given in Table 2. The values proposed by NND are shown for comparison. The differences are small showing both the reproducibility of the results between different samples and the remarkable job performed by NND from limited PL data in relatively low magnetic fields T.
It is however possible, towards the bottom of the face i.e when going far away from the top edge (see Fig.4), to find very different spectra as shown in Fig.10(b).
| (meV) | ||||||
| Isoya ESR Ref.[Isoya et al., 1990a] | 2.329 | – | – | – | – | – |
| NND PL Ref.[Nazaré et al., 1991] | 2.42 | 1.62 | 1.28 | 0.18 | 2.5 | 2.8 |
| Mason MCDA Ref.[Mason et al., 1999] | 2.32 | – | – | 2.445 | – | |
| Maes PL Ref.[Maes et al., 2004] | (2.329) | 1.93 | – | – | – | – |
| Standard parameters (this work) | 2.800 | |||||
| Defect misaligned on face | (0.16) | 2.874 |
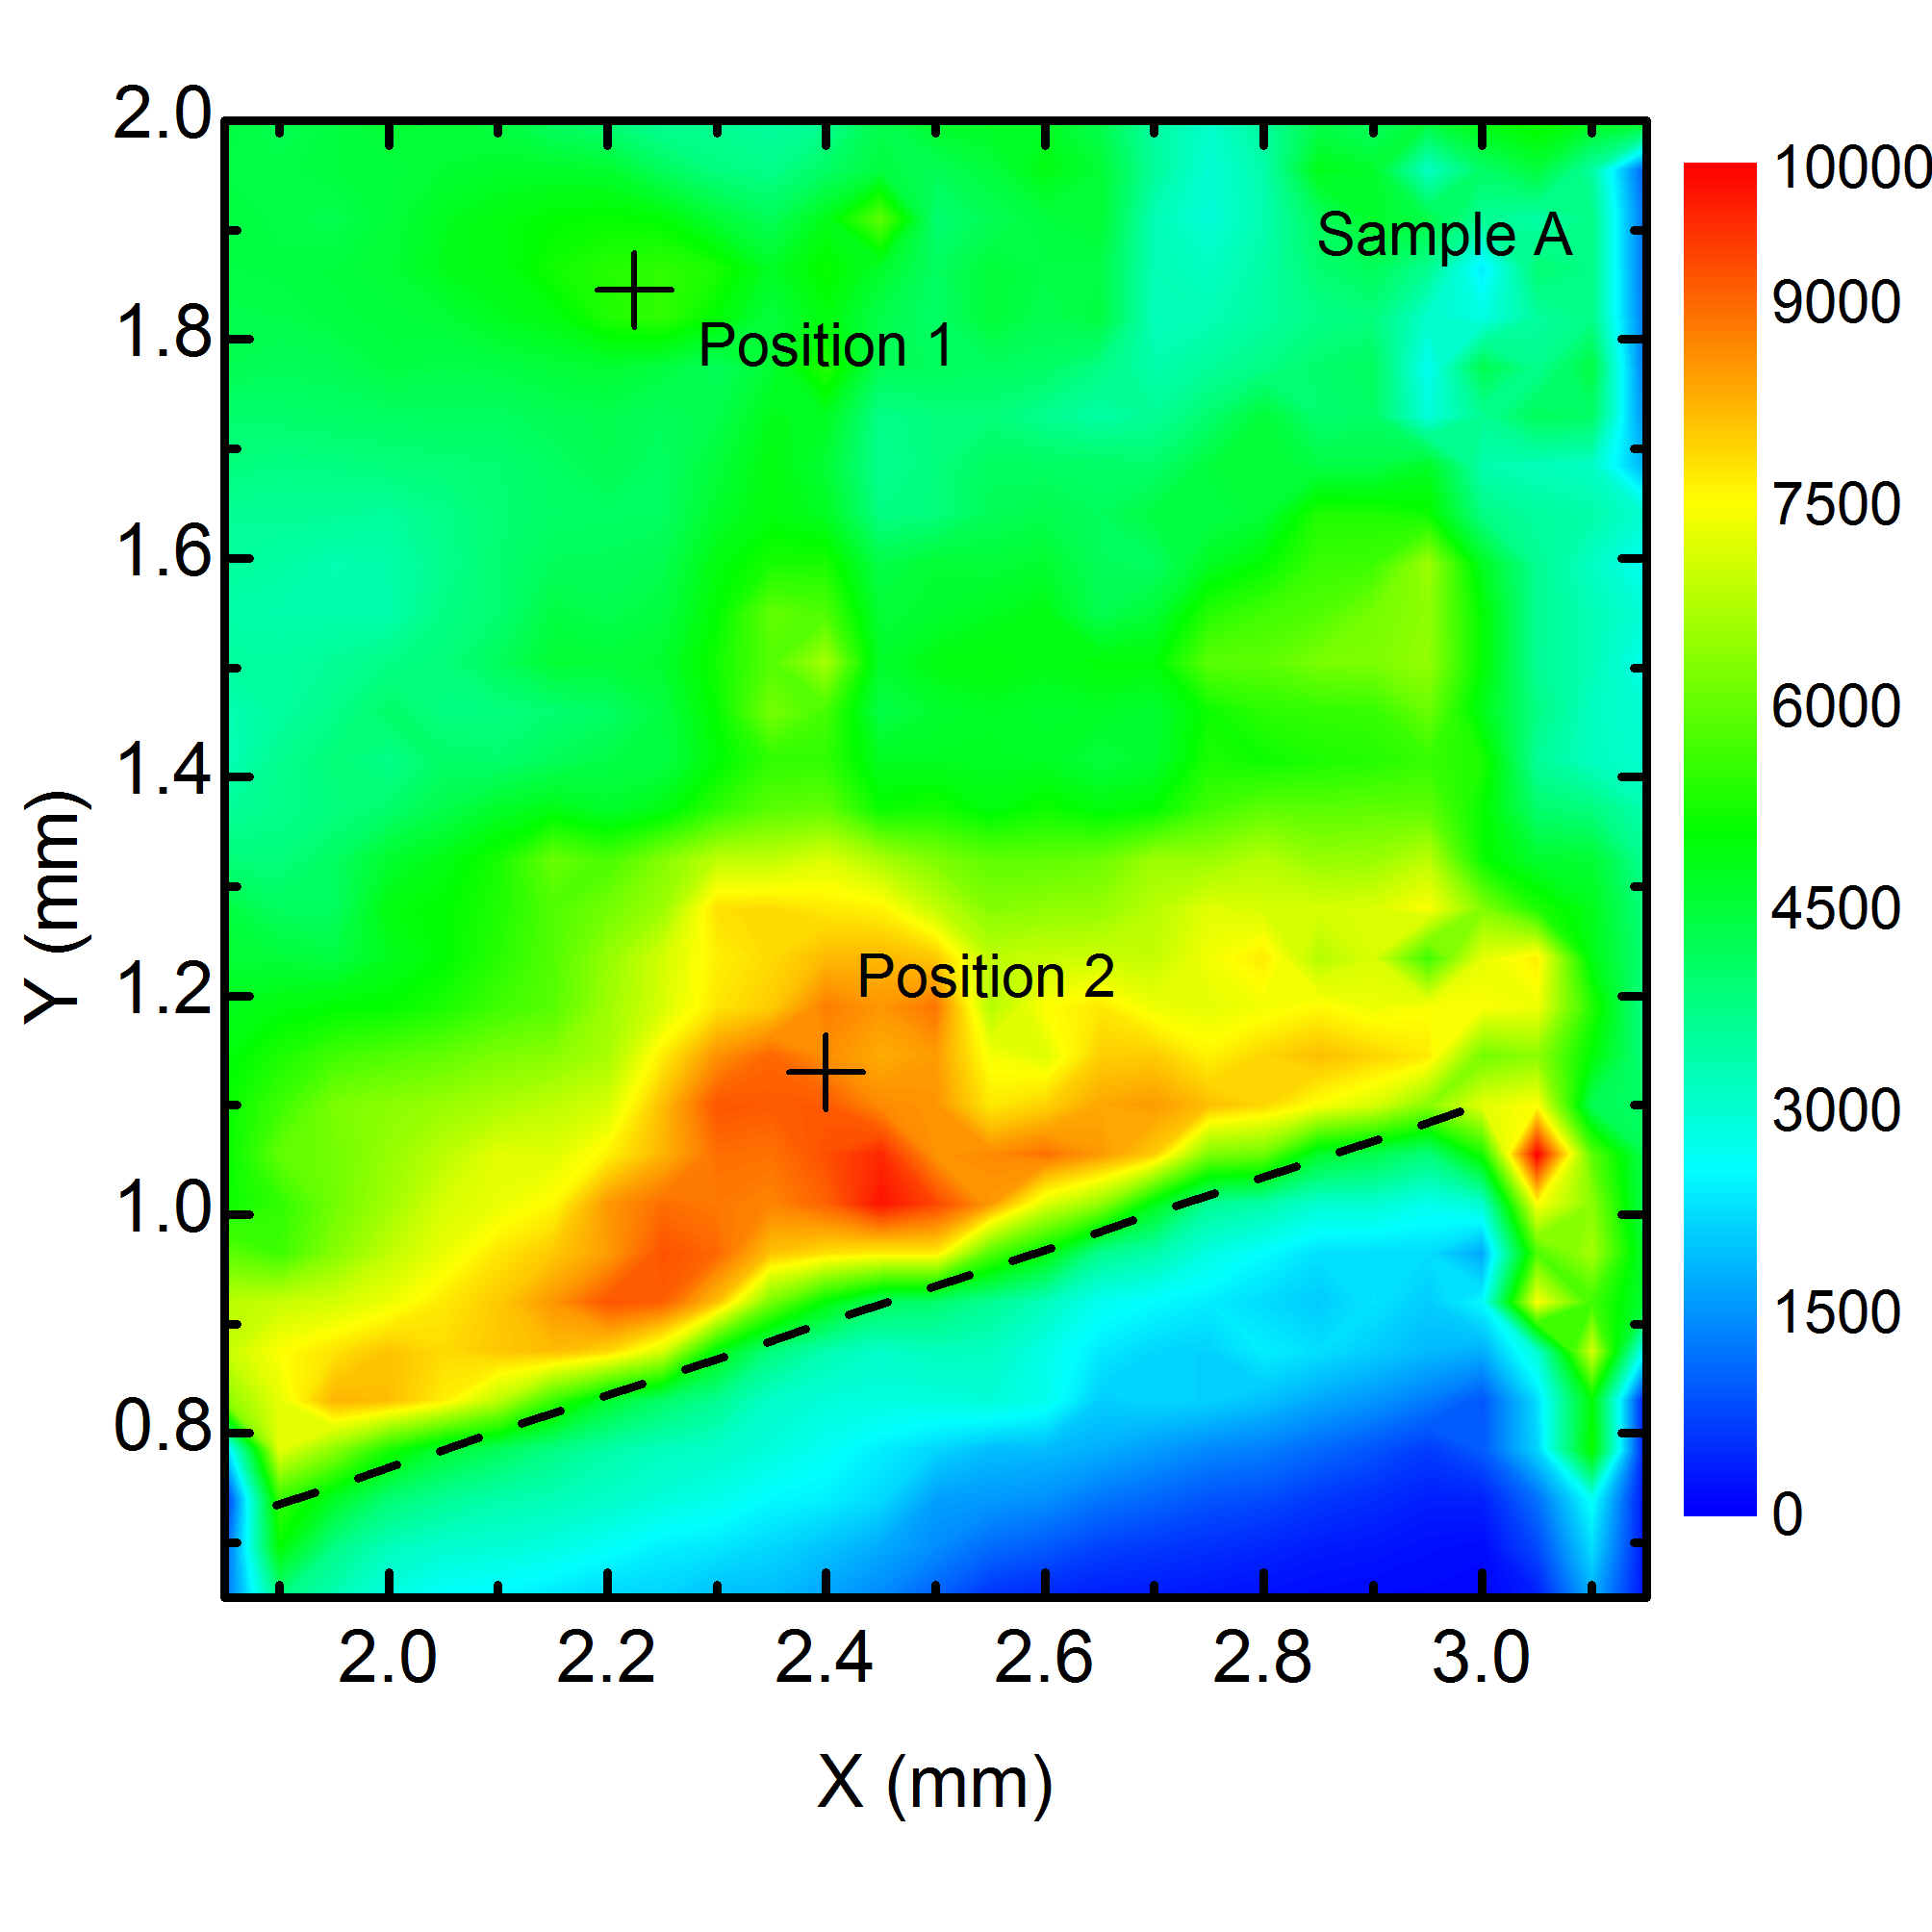
The spectra measured at position contain many more lines indicating that the defect is not preferentially aligned along the growth direction. Such spectra occur in areas of the with increased intensity of emission in zero magnetic field (see Fig.11). In addition a radically different parameter set for the effective spin Hamiltonian is required to fit the data. We have fitted the data assuming that the defect orientation is not along the growth direction (green broken lines). For the three “misaligned” defect orientations are all equivalent. The extracted parameters are given in Table 2. The fit is almost perfect confirming the trigonal symmetry. The red solid lines are the prediction for a defect aligned along the growth direction. From the data above T it appears that these transitions are completely absent from the spectra. This suggests that the defect may even be preferentially “not aligned” with the growth direction in this region of the face which is close to the seed crystal. Moreover, the parameters required to fit are considerably different from those obtained previously. In particular, the values of and are % larger reflecting the much larger Zeeman splitting of the ground state even though the magnetic field is not aligned along the quantization axis. This suggests that the local environment (trigonal distortion) of the Ni center is significantly different in regions of the face where it does not preferentially align along the growth direction.
V Discussion
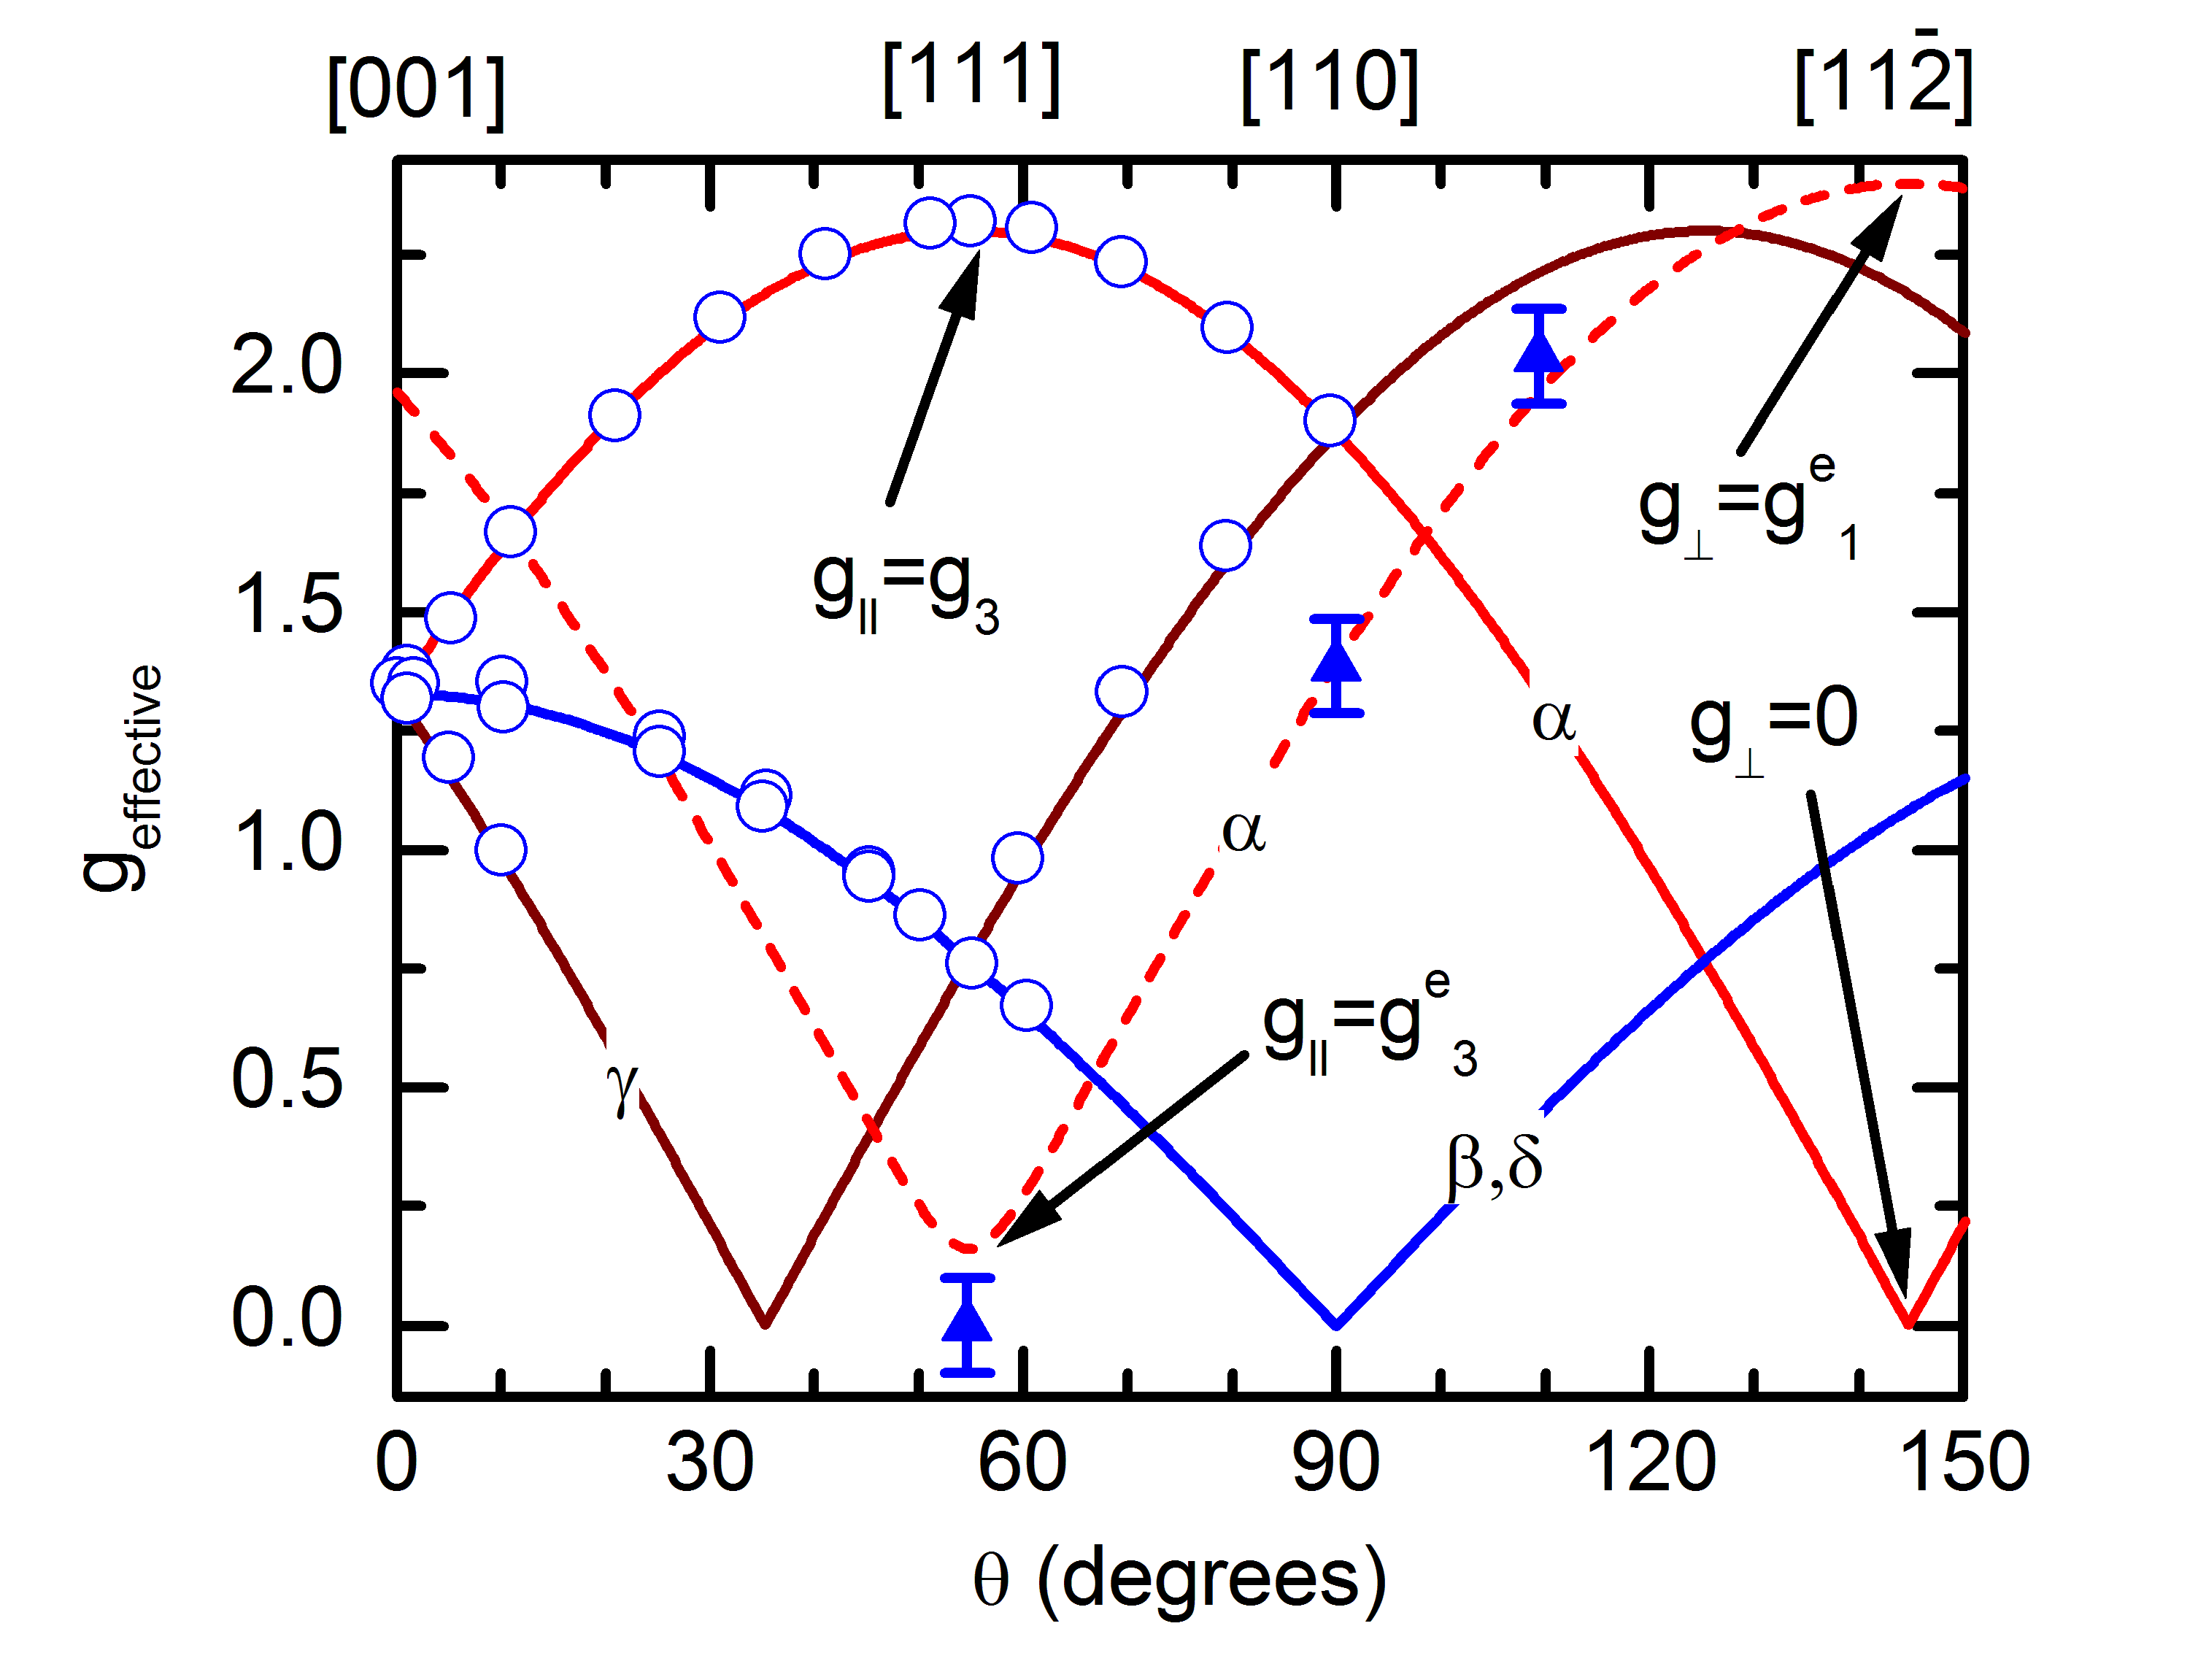
The eV Ni center investigated here has been unambiguously identified with the NIRIM-2 ESR line in HPHT diamond. Davies et al. (1989); Nazaré et al. (1991) NIRIM-2 has a large angular dependence of the magnetic field position of the ESR lines which is consistent with the center having trigonal symmetry.Isoya et al. (1990a) ESR gives very precise values for the g-factors but probes only the splitting of the ground state. While magnetic circular dichroism (MCDA) is a less precise technique, it is extremely useful since it gives access to the -factors of the excited state. Mason et al. (1999) The measured anisotropy of the -factor can provide a crucial test for a given microscopic model. In Fig. 12 we show the ground state splitting (effective -factor) obtained from the ESR data of Isoya et al. Isoya et al. (1990a) together with the MCDA results of Mason et al. Mason et al. (1999) for the excited state splitting. The expected angular dependence of the ground state splitting using the effective spin Hamiltonian is also plotted for the ground (solid lines) and excited state (broken line) as a function of angle when the magnetic field is rotated around the direction, e.g. from to . The predictions of the effective spin Hamiltonian are in excellent agreement with the ESR and MCDA results for both the ground and excited states.
In order to compare the -factors of the effective spin Hamiltonian with the ESR and MCDA results, it is convenient to define effective -factors, and corresponding to a magnetic field aligned parallel and perpendicular to the quantization axis of the defect. For the ground state we have a large and . The magnetic field component which is not along does not generate a Zeeman splitting of the ground state. The and components only change the splitting of the zero field doublet as can be seen from Eq. 7. The situation for the excited state is very different with a small and a large . As pointed out by Mason et al., the very small value of is a most unexpected result for an orbital singlet state.Mason et al. (1999) The high magnetic field PL results presented here have allowed a rather precise determination of the -factors which motivates us to revisit Mason et al.’s quantitative comparison with the -factors derived from the crystal field theory of interstitial 3d9 Ni+.
V.1 Crystal field model
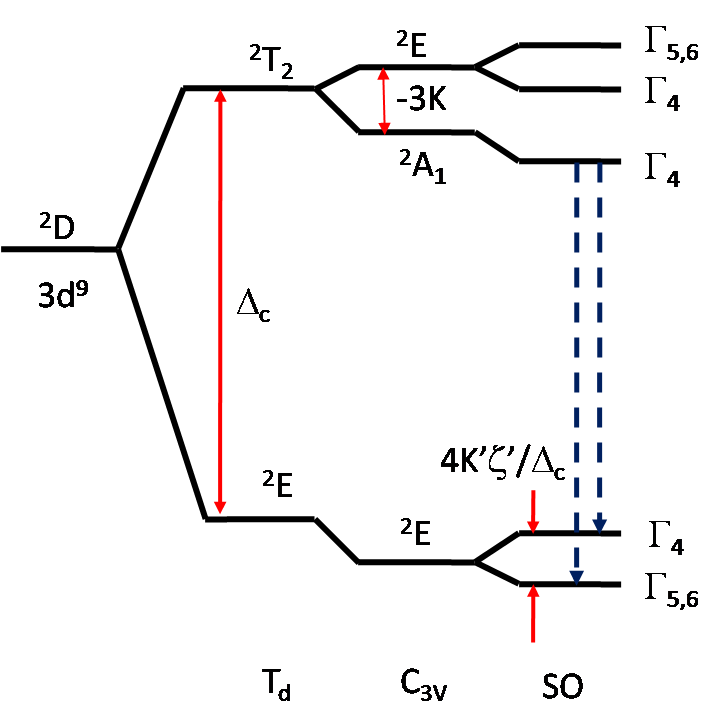
It has been proposed that the Hamiltonian used for neutral substitutional vanadium in SiCKaufmann et al. (1997) can also be applied to the case of interstitial Ni+,Mason et al. (1999)
| (8) |
where contains the cubic crystal field term, the trigonal crystal field, the spin-orbit interaction and finally includes the Zeeman interaction. The resulting level structure is shown in Fig. 13. The parameters , , , and are the cubic crystal-field splitting, one-third of the trigonal crystal-field splitting within the state, the spin-orbit parameter, and an orbital reduction factor, respectively (, , and are the corresponding quantities for the state). The sign of the trigonal crystal field parameter, , is chosen so that the level of the excited state is lowest in agreement with the uniaxial stress measurements Nazaré et al. (1991) and the spin-orbit parameters and are both negative for the single hole.
The ground state is split into two Kramers doublets by a combination of spin-orbit coupling and trigonal distortion.
| (9) |
where the cubic crystal field term eV. From the measured splitting meV we obtain the product eV2.
The -factors of the ground state doublet are for the state, Mason et al. (1999)
| (10) |
and for the state
| (11) |
As the state has so that the effective spin Hamiltonian (in which de facto ) is a reasonable approximation. Using the values of and found in this work, solving Eqs.(10-11) immediately gives so that . Although small, the splitting of the upper doublet state should be experimentally observable at magnetic fields above T with applied perpendicular to the defect axis on the face. The high resolution -PL measurements, with its narrower line widths and better signal/noise in static magnetic fields, clearly resolved the similarly small splitting of the excited state with . Unfortunately, only the Faraday configuration is possible when using the -PL system so that such a measurement is excluded for the present. Making the approximation that the orbital reduction factor gives eV. As pointed out by Mason et al., while such values of and are reasonable, the product eV2 is too large to be compatible with the eV2 obtained from Eq.(9) knowing the spin-orbit splitting meV of the zero field doublet. Using an orbital reduction factor only makes the situation worse.
The and terms give an additional constraint that , so that the orbital reduction factor cannot be freely chosen. Using the values of and found in this work, a solution to Eq.(12) exists with , and . From Eq.(13) this implies that . Neglecting covalency effects, which are expected to be small in diamond, giving eV.
Thus the only apparent short coming of the crystal field model is its inability to correctly predict the zero magnetic field doublet splitting. It has been suggested that this might be explained by corrections to the splitting of the state which can arise due to a mixing with the states of the Ni+. Paslovsky and Lowther (1992) Such a mechanism has also been proposed for Cu2+ in II-VI compounds. Scherz (1969); Telahun et al. (1996)
A crucial test of the crystal field model is provided by defects with a quantization axis which is not preferentially aligned: In the -PL data it is possible to find regions of the face, towards the bottom of the sample, i.e. near the seed crystal, where the defects are not preferentially aligned along the growth direction. Such defects have an almost identical emission energy (see Fig. 5) and an almost identical splitting ( meV) of the zero magnetic field doublet. Surprisingly, the -factors for the trigonal axis of such defects are markedly different (see Table. 2). Using the values found in experiment, and in Eqs.(10-11), gives and so that . Assuming , the spin-orbit coupling term eV and trigonal crystal field term eV. The value of is an unreasonable times larger that the value of eV for a free Ni+ ion.Mason et al. (1999); Moore Moreover, the product eV2 overestimates the zero field doublet splitting (Eq.(9)) by over an order of magnitude. At the same time experiment indicates that the splitting of the zero field doublet is almost unchanged. This forces us to conclude that the crystal field model does not provide a correct quantitative description of the eV Ni color center in diamond.
VI Conclusion
We have investigated two different boron-free HTHP synthetic diamond crystals. Our high magnetic field photoluminescence results are perfectly described by the NND effective spin Hamiltonian, unequivocally demonstrating the trigonal symmetry of the eV Ni color center in diamond. Both samples investigated have a similar Ni content ( cm-3) but radically different concentrations of N. Sample B has a similar concentrations of Ni and N, while sample A has roughly two orders of magnitude less nitrogen. Magnetization measurements show that Ni is predominantly incorporated into Sample B as isolated Ni complexes and into Sample A as nm size Ni clusters. Nevertheless, both samples exhibit the characteristic eV emission doublet associated with an isolated Ni complex. Despite the significantly lower concentration of isolated Ni, Sample A shows much stronger eV emission. This suggests that the presence of N does not necessarily favor the formation of the eV Ni color center; the concentration of isolated Ni-N complexes is almost certainly higher in Sample B, while the eV PL signal is much weaker, suggesting that the presence of N may actually impede the formation of this particular Ni color center. As nitrogen is usually a donor in diamond, a possible mechanism could be the transfer of a donor electron to the Ni+ ion reducing the number of optically active centers.Paslovsky and Lowther (1992); Collins et al. (1990)
The magneto-PL presented here, together with previously published magneto-PL and PL under uniaxial stress,Nazaré et al. (1991); Maes et al. (2004) ESR Isoya et al. (1990a) and MCDAMason et al. (1999) are all consistent with an interstitial Ni+ with spin and a large trigonal distortion ( symmetry) due to a displacement of the Ni along a direction. The exact nature of the complex nevertheless remains unknown. A complex involving an additional, transition metal impurity, dopants such as nitrogen or boron, or a vacancy or divacancy, is required to produce the trigonal distortion. On the basis of the ESR results Isoya et al. suggested an interstitial -vacancy complex. However, this configuration has been shown to be unstable Larico et al. (2004) with the interstitial Ni moving towards vacancy i.e. to the substitutional site. First principles calculations suggests that that a complex involving boron and substitutional nickel fulfills all the necessary requirements.Larico et al. (2009) However, this assignment seems to be unlikely here as there was no boron present in the melt during the growth of our samples. Moreover, recent density functional theory (DFT) calculations coupled with X-ray absorption spectroscopy measurements performed on Sample B, suggest the incorporation of nickel as a divacancy complex, in which interstitial Ni is placed at the midpoint between two vacancies.Gheeraert et al. (2012) However, the first principles calculations of Larico et al. Larico et al. (2009) suggest that the (VNiV)+ complex has symmetry with the Ni related electronic states resonant and inert inside the valence band. First principles calculations of defects in diamond are in general complicated due to the need to take into account possible relaxations of neighboring carbon atoms which can alter both the energy and the symmetry of the center. Under such conditions the microscopic model for the eV Ni color center in diamond should still be considered as an open question.
Acknowledgements.
The help of Fabrice Donatini with the cathodoluminescence measurements is gratefully acknowledged. We thank Laurence Eaves and Bernard Clerjaud for their interest in this work and stimulating discussions. This work was partially supported by EuroMagNET II under the EU contract 228043.References
- Aharonovich et al. (2009a) I. Aharonovich, S. Castelletto, D. A. Simpson, A. Stacey, J. McCallum, A. D. Greentree, and S. Prawer, Nano Letters 9, 3191 (2009a).
- Aharonovich et al. (2009b) I. Aharonovich, C. Zhou, A. Stacey, J. Orwa, S. Castelletto, D. Simpson, A. D. Greentree, F. Treussart, J.-F. Roch, and S. Prawer, Phys. Rev. B 79, 235316 (2009b).
- Simpson et al. (2009) D. A. Simpson, E. Ampem-Lassen, B. C. Gibson, S. Trpkovski, F. M. Hossain, S. T. Huntington, A. D. Greentree, L. C. L. Hollenberg, and S. Prawer, Applied Physics Letters 94, 203107 (2009).
- Castelletto et al. (2010) S. Castelletto, I. Aharonovich, B. C. Gibson, B. C. Johnson, and S. Prawer, Phys. Rev. Lett. 105, 217403 (2010).
- Morton (2006) J. J. L. Morton, Nature Physics 2, 365 (2006).
- Maze et al. (2008) J. R. Maze, P. L. Stanwix, J. S. Hodges, S. Hong, J. M. Taylor, P. Cappellaro, L. Jiang, M. V. G. Dutt, E. Togan, A. S. Zibrov, A. Yacoby, R. L. Walsworth, and M. D. Lukin, Nature 455, 644 (2008).
- Balasubramanian et al. (2008) G. Balasubramanian, I. Y. Chan, R. Kolesov, M. Al-Hmoud, J. Tisler, C. Shin, C. Kim, A. Wojcik, P. R. Hemmer, A. Krueger, T. Hanke, A. Leitenstorfer, R. Bratschitsch, F. Jelezko, and J. Wrachtrup, Nature 455, 648 (2008).
- Lohrmann et al. (2011) A. Lohrmann, S. Pezzagna, I. Dobrinets, P. Spinicelli, V. Jacques, J.-F. Roch, J. Meijer, and A. M. Zaitsev, Applied Physics Letters 99, 251106 (2011).
- Lawson et al. (1996) S. C. Lawson, H. Kanda, K. Watanabe, I. Kiflawi, Y. Sato, and A. T. Collins, Journal of Applied Physics 79, 4348 (1996).
- Collins and Spear (1982) A. T. Collins and P. M. Spear, Journal of Physics D: Applied Physics 15, L183 (1982).
- Zaitsev (2000) A. M. Zaitsev, Phys. Rev. B 61, 12909 (2000).
- Dietl et al. (2001) T. Dietl, H. Ohno, and F. Matsukura, Phys. Rev. B 63, 195205 (2001).
- Isoya et al. (1990a) J. Isoya, H. Kanda, and Y. Uchida, Phys. Rev. B 42, 9843 (1990a).
- Davies et al. (1989) G. Davies, A. J. Neves, and M. H. Nazaré, Europhysics Letters 9, 47 (1989).
- Nazaré et al. (1991) M. H. Nazaré, A. J. Neves, and G. Davies, Phys. Rev. B 43, 14196 (1991).
- Iakoubovskii and Davies (2004) K. Iakoubovskii and G. Davies, Phys. Rev. B 70, 245206 (2004).
- Mason et al. (1999) P. W. Mason, F. S. Ham, and G. D. Watkins, Phys. Rev. B 60, 5417 (1999).
- Maes et al. (2004) J. Maes, K. Iakoubovskii, M. Hayne, A. Stesmans, and V. V. Moshchalkov, Journal of Physics D: Applied Physics 37, 1102 (2004).
- Baker (2003) J. M. Baker, Journal of Physics: Condensed Matter 15, S2929 (2003).
- Larico et al. (2004) R. Larico, L. V. C. Assali, W. V. M. Machado, and J. F. Justo, Applied Physics Letters 84, 720 (2004).
- Larico et al. (2009) R. Larico, J. F. Justo, W. V. M. Machado, and L. V. C. Assali, Phys. Rev. B 79, 115202 (2009).
- Isoya et al. (1990b) J. Isoya, H. Kanda, J. R. Norris, J. Tang, and M. K. Bowman, Phys. Rev. B 41, 3905 (1990b).
- Nazaré et al. (2001) M. Nazaré, J. Lopes, and A. Neves, Physica B: Condensed Matter 308 - 310, 616 (2001).
- Kaufmann et al. (1997) B. Kaufmann, A. Dörnen, and F. S. Ham, Phys. Rev. B 55, 13009 (1997).
- Paslovsky and Lowther (1992) L. Paslovsky and J. E. Lowther, Journal of Physics: Condensed Matter 4, 775 (1992).
- Scherz (1969) U. Scherz, Journal of Physics and Chemistry of Solids 30, 2077 (1969).
- Telahun et al. (1996) T. Telahun, U. Scherz, P. Thurian, R. Heitz, A. Hoffmann, and I. Broser, Phys. Rev. B 53, 1274 (1996).
- (28) C. Moore, Atomic Energy Levels, Natl. Bur. Stand. (U.S.) Circ. No. 467 (U.S. GPO Washington D.C., 1949).
- Collins et al. (1990) A. T. Collins, H. Kanda, and R. C. Burns, Philosophical Magazine Part B 61, 797 (1990).
- Gheeraert et al. (2012) E. Gheeraert, A. Kumar, J. Pernot, L. Magaud, Y. Joly, E. Bustarret, S. Pascarelli, M. Ruffoni, H. Kanda, and D. Avasthi, (2012), submitted for publication (2012).