ENERGETIC FERMI/LAT GRB100414A: ENERGETIC AND CORRELATIONS
Abstract
This study presents multi-wavelength observational results for energetic GRB100414A with GeV photons. The prompt spectral fitting using Suzaku/WAM data yielded spectral peak energies of of keV and of erg with . The optical afterglow light curves between 3 and 7 days were effectively fitted according to a simple power law with a temporal index of . The joint light curve with earlier Swift/UVOT observations yields a temporal break at 2.30.2 days. This was the first Fermi /LAT detected event that demonstrated the clear temporal break in the optical afterglow. The jet opening angle derived from this temporal break was , consistent with those of other well-observed long gamma-ray bursts (GRBs). The multi-wavelength analyses in this study showed that GRB100414A follows and correlations. The late afterglow revealed a flatter evolution with significant excesses at 27.2 days. The most straightforward explanation for the excess is that GRB100414A was accompanied by a contemporaneous supernova. The model light curve based on other GRBSN events is marginally consistent with that of the observed lightcurve.
1 Introduction
The Large Area Telescope (LAT) on board Fermi Gamma-ray Space Telescope has opened a new window for observing gamma-ray bursts (GRBs) from the range of 20 MeV to 300 GeV (e.g., Abdo et al. (2009a, b); Ackermann et al. (2011, 2010)). Characterizing highly energetic events involving GeV photons is one of the most important issues in determining their origin. Similar to other GRBs, prompt spectral analyses and optical monitoring observations are critical for addressing this topic (e.g. Greiner et al. (2009)). Optical monitoring observations enable the establishment of constraints on the jet opening angle and offer insights into the possible progenitor. Although spectral confirmations are generally required, the bumps in the late optical afterglow light curves are usually interpreted as a superimposition of a supernova component associated with GRB. Multi-band analysis can reveal the existence of tight correlations linking several properties of GRB, namely the spectral peak energy, total radiated energy, and the afterglow break time (Amati et al., 2002; Ghirlanda et al., 2007). The discovery of these correlations can provide critical insights into crucial areas of GRB physics that are not yet completely understood. Although some outliers were found in the tight correlations - (e.g., GRB071010B; Urata et al. 2009, GRB050904; Sugita et al. 2009), the - might yet provide information on the characteristics of different subclasses of GRBs (Amati, 2006).
This Letter presents the spectral analysis of the prompt gamma-ray and systematic optical follow-up results for GRB100414A. This event was detected and localized using Fermi /LAT(Takahashi, 2010). More than 20 photons above 100 MeV were observed within 300 s, and the highest energy photon was a 4 GeV event observed 40 s after the burst (Takahashi, 2010). The Fermi /GBM(Foley, 2010), Konus/WIND(Golenetskii et al., 2010a), and Suzaku/WAM(Uehara et al., 2010) observations also detected this main burst, while the Inter Planetary Network further confirmed the localization (Golenetskii et al., 2010b). Page et al. (2010) improved the GRB position by identifying the X-ray afterglow using Swift/XRT. The optical afterglow was discovered by Cucchiara & Fox (2010) using Gemini/GMOS. The redshift was determined to be according to a series of metal absorption features (Cucchiara & Fox, 2010).
We use the power-law representation of flux density, , where and are the temporal and spectral indices, respectively. All errors are quoted at 1 confidence level in this Letter.
2 Observations and Results
2.1 Prompt emission
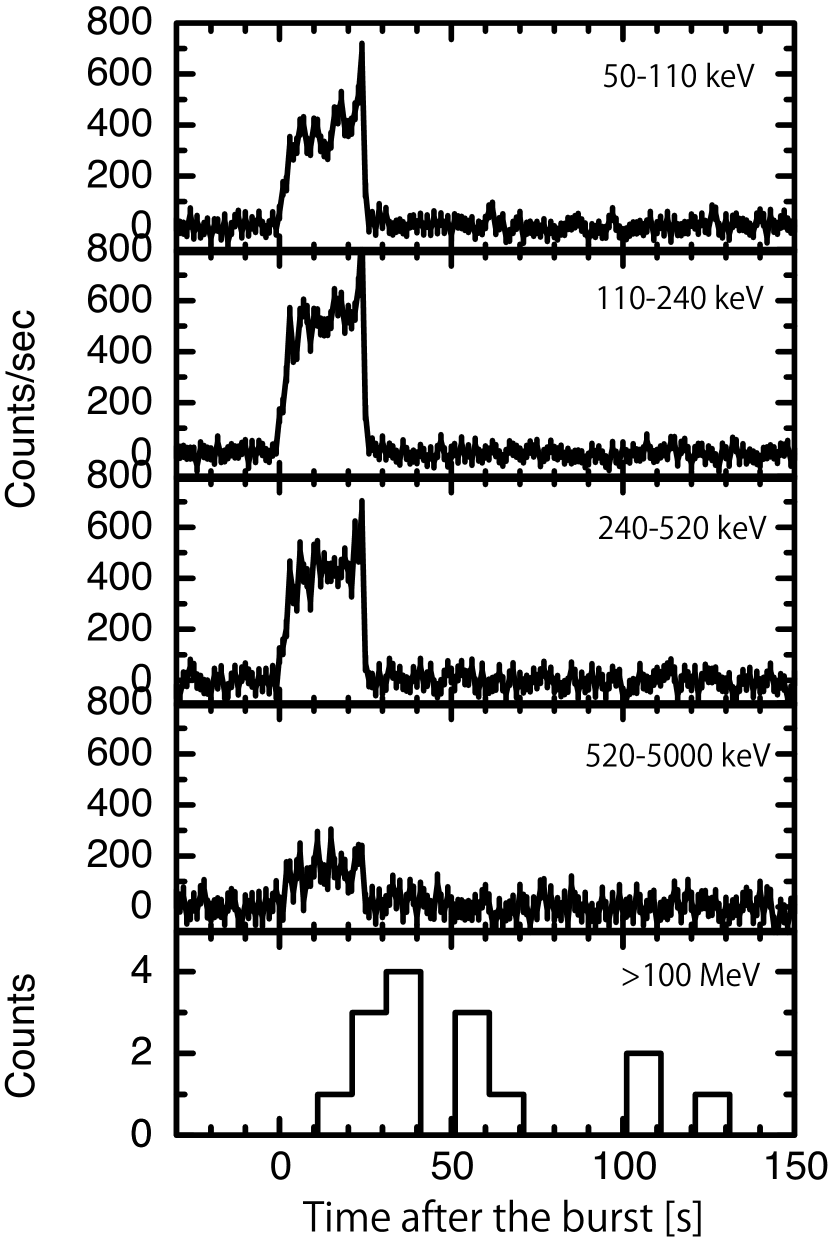
GRB 100414A triggered the SuzakuWAM on 2010 April14 02:20:22.879(=T0). The WAM (Yamaoka et al., 2009) is a lateral shield of the Hard X-ray Detector (Takahashi et al., 2007) on board the Suzakusatellite (Mitsuda et al., 2007) and can function as a GRB monitor sensitive to the 505000 keV gamma-rays (e.g. Onda et al. (2010); Ohno et al. (2008); Tashiro et al. (2007)). This burst was detected by all four of the WAM shields, and its light curve is shown with 1 s time resolution in Figure 1. The duration was s which places it in the class of long duration events.
We also performed the spectral analysis using the WAM transient data with 55 energy channels and 1-s time resolution. We used the data from the WAM2 detector only because this particular GRB was situated on a direction along the normal vector of the WAM2. The WAM2 spectrum was extracted by integrating over T01.5 s to T0+24.5 s with the hxdmkwamspec in the standard HEADAS 6.9 package provided by NASA/GSFC. The background spectrum was estimated by incorporating the best-fit model of source-free time region on both sides (T0504.5 to T04.5 and T0+37.5 to T0+237.5) of the burst time region. The energy response was calculated by the WAM response generator version 1.9 (Ohno et al., 2006).
We performed the spectral fitting in Xspec version 12.5 and found that the best-fit model was the GRB Band function (). Two other models we also attempted were a power-law () and a power-law with an exponential cutoff (). The best-fit parameters for the Band function were =–0.62(–0.15, +0.17), =–3.05(–0.28,+0.20), and =61634 keV. Thus obtained, the fluence in the 100-5000 keV range was (6.650.21)10-5 erg cm-2 s-1.
The corresponding Fermi/LAT photon data were downloaded from the Fermi Science Support Center. Based on the likelihood and aperture photometry111http://fermi.gsfc.nasa.gov/ssc/data/analysis/scitools/, we generated the light curve for the MeV energy range (Figure 1). The highest energy photon from this event was GeV at approximately 40 s after the burst. This result was consistent with Takahashi (2010). We also confirmed the temporal extended emissions.
2.2 Optical follow-up
We performed the optical afterglow observations using the Canada France Hawaii Telescope (CFHT)/MegaCam within the framework of the EAFON (Urata et al., 2003). The -band monitoring observations covered the duration from 5.2 days to 57.6 days after the burst. Additional - and -band images were taken on the night of 2010 April 20 (6.2 days after the burst). Because of the bright moon phase, there was no optical observation between 7 and 26 days. The standard CFHT’s data pipeline reduced all of the data.
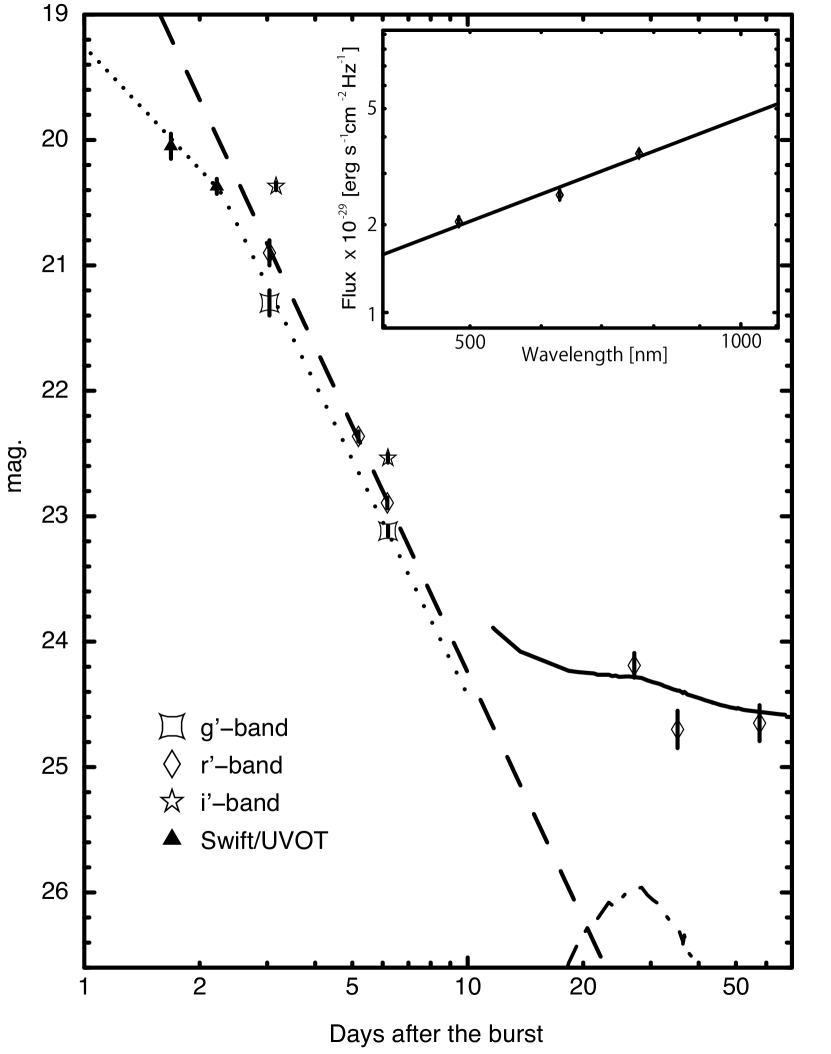
Figure 2 shows the -, - and -band light curves with several GCN points (Landsman & Cannizzo, 2010; Cucchiara & Fox, 2010; Filgas et al., 2010). The light curves demonstrated the steep decay occurring between 3 and 7 days after the burst. The temporal indices were , and in -, -, and -bands, respectively. As shown in Figure 2 the spectral energy distribution (SED) of optical afterglow during the steep decay phase (at 6.2 days) could be satisfactorily expressed according to a simple power law with the spectral index .
After the 35 days, a possible host galaxy component dominated. Because there was no significant brightness change between 35.2 and 57.6 days, we estimated the brightness of the host to be AB mag. The afterglow at 27.2 days exhibited clear excess from the brightness of the host galaxy. The excess was also fairly inconsistent with the extrapolation of the afterglow component.
3 Discussions
3.1 Optical afterglow and Jet break
The prior optical afterglow of GRB100414A ( days) exhibited power-law decays with temporal break at approximately days. Despite the paucity of observations for the optical afterglow, the joint light curve using Swift/UVOT strongly suggested a temporal break. The decay indices before and after the break were and , respectively, fully consistent with typical well-observed long GRB optical afterglows. Comparing the sample (listed in (McBreen et al., 2010)) revealed that the optical afterglow brightness at 2 days exhibited average brightness or was rather brighter than those of long GRBs afterglows.
To examine whether the jet model is applicable to present afterglow, we utilized the relations by Sari et al. (1999) and calculated and based on the observed . The observed values were in agreement with the calculated value of , assuming that we were observing a jet expansion phase in the frequency range above the synchrotron cooling. In addition, although the X-ray afterglow observation was also poor, the decay index between 2.0 and 7.4 days was also consistent with the jet model. The case of wind density profile with also satisfied the closure relation. However, it is unlikely for the late ( days) afterglow.
We also attempted to fit the -band light curve including the UVOT data using the broken power-law model by fixing the temporal decay indices of former and post jet break at and , respectively. The UVOT data were calibrated according to the SDSS field stars that have similar colors to the GRB afterglow, and were converted to band magnitudes. As shown in Figure 2, we successfully fitted the light curve and obtained the jet break time as days. (Figure 2). The jet opening angle derived from this temporal break was , consistent with those of other well-observed long GRBs.
3.2 Energetic and Correlation
The abundance of the multi-wavelength data for estimating the jet break time makes GRB100414A one of the most favorable targets for evaluating the and relations of studies that had stagnated because of a lack of data on the estimation and long-term optical monitoring. In particular, the current event was the first Fermi /LAT detected event exhibiting the clear jet break features.
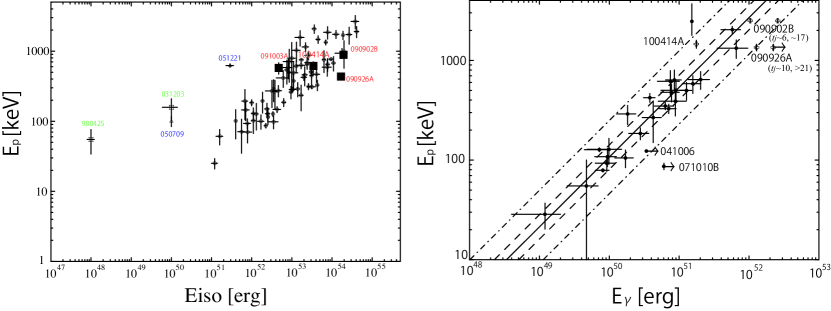
To examine the correlations with the least systematics errors, we collected five LAT-detected events observed using the Suzaku/WAM, as summarized in Table 2. The spectral analysis of the WAM data was performed in the same manner as described in Section 2.1. The estimated of GRB 090902B in the 1 keV to 10 MeV range using Suzaku/WAM are consistent with the value derived from the Fermi /GBM observation (Cenko et al., 2010)). In the case of GRB090926A, the value is slightly smaller than that of the estimation (2.3 erg) using Fermi /GBM (McBreen et al., 2010). The most likely reason for this inconsistency is that the energy range of Suzaku/WAM is insufficient in detecting the underlying power-law component in the Fermi /LAT-GBM spectrum(Abdo et al., 2009a). GRB090510 was the short event, and the spectral parameters were not effectively constrained, we excluded this event for the evaluation of correlation. The marginal optical temporal break time of GRB090926A and GRB090902B was reported by Cenko et al. (2010), McBreen et al. (2010), Rau et al. (2010) and Swenson et al. (2010). As summarized in Table 2, the values vary widely according to the estimation methods. We also excluded the GRB091003 for the evaluation of the relation because of a lack of the estimation. Interestingly, the three selected events (GRB090926A, GRB090902B and the current one) shared commonality in the delayed highest energy photons from their main burst (GRB090926A; Ackermann et al. 2011, GRB090902B; Abdo et al. 2009).
Figure 3 shows the and relations with Suzaku/WAM observed LAT-detected events. We found that all four events were highly consistent with previous studies of the . As shown in Figure 3, the measured values of current event ( keV and erg) adhered closely to the relation. Although the background GRB physic of this correlation is not yet completely understood, the characteristics of different sub-classes of GRBs become apparent (Amati 2006). To compare other categories of the events (e.g., short duration GRBs and sub-energetic events), we plotted them in Figure 3. These features were clearly different from those of the current event. The present event and GRB 090902B were also consistent with correlation (Figure 3). In the case of GRB090926A, thoroughly depends on the jet break time estimation.
3.3 Origin of the late time optical bump
The late afterglow indicated a flatter evolution with the significant excess at days (11.5 days in the rest frame). The flatter component in the light curve was due to the contribution from the host galaxy of GRB100414A. The estimated brightness of the host was consistent with those of typical host galaxies at (e.g., Jakobsson et al. (2011); Berger (2010)). The most straightforward explanation for the excess in the late afterglow light curve (approximately 27.2 days) is that GRB 100414 was accompanied by a contemporaneous SN. Several GRBs have bumps in the optical light curves approximately 15 days in the rest frame (e.g., GRBs 030329, 090323, 090328) that can be interpreted by refreshed shocks (e.g., Rees & Meszaros (1998); Granot et al. (2003)) or late central engine activity. However, the appearance time of the current event is significantly later. The recent spectroscopic confirmation of the GRBSN connection on the typical long GRB with the standard optical afterglow light curve while obeying the relation (Sparre et al., 2011) is also one of the most encouraging results supporting the SN association. Although spectroscopic confirmations are required, discussing the photometric evaluation is still vital. In particular, in the case of rare Fermi /LAT events, light curve evaluation is usually sufficient for the first step.
Several GRBs are associated with SN components, whose rise times and peak magnitudes are constrained by their optical afterglow light curves. The GRBSN are globally similar regarding the rise times and peak magnitudes. The peak times tend to be clustered in 1020 days after the burst in the rest frame, and the absolute magnitudes are usually approximately mag. To examine the consistency of the possible SN component, we added the light curve template of SN1998bw to the GRB100414A’s host galaxy and afterglow with scaling to the redshift of , and fixed the peak time at 27.2 days. This was because having less observational data points meant that constraining the peak time was not possible. Although the peak time at 27.2 days (12.2 days in the rest frame) was earlier than those of the GRBSN events, it was still consistent with the global feature, especially for the GRB060218A case. As shown in Figure 2, the combined light curve was marginally consistent with the observational results. This implies that the energetic GRB100414A was linked to a core collapse supernova.
The aforementioned discussions suggest that the current event show no significant differences with long duration GRBs detected in pre-Swiftand Swifteras, despite energetic GeV radiation. By combining the features of the bumps in the optical light curves and correlations, we concluded that the progenitor of the current event was likely the massive stars.
References
- Abdo et al. (2009a) Abdo, A. A., et al. 2009, ApJ, 706, L138
- Abdo et al. (2009b) Abdo, A. A., Ackermann, M., Arimoto, M., et al. 2009, Science, 323, 1688
- Ackermann et al. (2011) Ackermann, M., et al. 2011, ApJ, 729, 114
- Ackermann et al. (2010) Ackermann, M., et al. 2010, ApJ, 716, 1178
- Amati et al. (2002) Amati, L., et al. 2002, A&A, 390, 81
- Amati (2006) Amati, L. 2006, MNRAS, 372, 233
- Berger (2010) Berger, E. 2010, ApJ, 722, 1946
- Cenko et al. (2010) Cenko, S. B., et al. 2010, arXiv:1004.2900
- Cucchiara & Fox (2010) Cucchiara, A., and Fox, D. B. 2010, GRB Coordinates Network, 10606, 1
- Cucchiara et al. (2009a) Cucchiara, A.,Fox, D. B., Cenko, S. B., Tanvir, N., Berger, B. 2009, GRB Coordinates Network, 10031, 1
- Cucchiara et al. (2009b) Cucchiara, A.,Fox, D. B., Cenko, S. B., Tanvir, N., Berger, B. 2009, GRB Coordinates Network, 9873, 1
- Filgas et al. (2010) Filgas, R., Kruehler, T., & Greiner, J. 2010, GRB Coordinates Network, Circular Service, 10607, 1 (2010), 607, 1
- Foley (2010) Foley, S. 2010, GRB Coordinates Network, Circular Service, 10595, 1 (2010), 595, 1 1
- Ghirlanda et al. (2007) Ghirlanda, G., Nava, L., Ghisellini, G., and Firmani, G., 2007, å, 466, 127
- Golenetskii et al. (2010a) Golenetskii, S., et al. 2010, GRB Coordinates Network, Circular Service, 10597, 1 (2010), 597,
- Golenetskii et al. (2010b) Golenetskii, S., et al. 2010, GRB Coordinates Network, Circular Service, 10599, 1 (2010), 599,
- Granot et al. (2003) Granot, J., Nakar, E., & Piran, T. 2003, Nature, 426, 138
- Greiner et al. (2009) Greiner, J., Clemens, C., Krühler, T., et al. 2009, A&A, 498, 89
- Jakobsson et al. (2011) Jakobsson, P., Malesani, D., Hjorth, J., Fynbo, J. P. U., & Milvang-Jensen, B. 2011, Advances in Space Research, 47, 1416
- Landsman & Cannizzo (2010) Landsman, W., & Cannizzo, J. 2010, GRB Coordinates Network, Circular Service, 10609, 1 (2010), 609, 1
- Malesani et al. (2009) Malesani, D., et al. 2009, GRB Coordinates Network, 9942, 1
- McBreen et al. (2010) McBreen, S., et al. 2010, A&A, 516, A71
- Mitsuda et al. (2007) Mitsuda, K., et al. 2007, PASJ, 59, 1
- Ohno et al. (2006) Ohno, M., et al. 2006, Nuovo Cimento B Serie, 121, 1127
- Ohno et al. (2008) Ohno, M., Fukazawa, Y., Takahashi, T., et al. 2008, PASJ, 60, 361
- Onda et al. (2010) Onda, K., Tashiro, M. S., Nakagawa, Y. E., et al. 2010, PASJ, 62, 547
- Page et al. (2010) Page, K. L., et al. 2010, GRB Coordinates Network, 10601, 1
- Rau et al. (2010) Rau, A., Savaglio, S., Krühler, T., et al. 2010, ApJ, 720, 862
- Rau et al. (2009) Rau, A., McBreen, S., Kruehler, T. and Greiner, J. 2009, GRB Coordinates Network, 9353, 1
- Rees & Meszaros (1998) Rees, M. J., & Meszaros, P. 1998, ApJ, 496, L1
- Rhoads (1999) Rhoads, J. E. 1999, ApJ, 525, 737
- Sari et al. (1999) Sari, R., Piran, T., & Halpern, J. P. 1999, ApJ, 519, L17
- Sparre et al. (2011) Sparre, M., et al. 2011, ApJ, 735, L24
- Stanek et al. (2003) Stanek, K. Z., et al. 2003, ApJ, 591, L17
- Sugita et al. (2009) Sugita, S., et al. 2009, PASJ, Vol. 61, No. 3, pp. 521–527
- Swenson et al. (2010) Swenson, C. A., Maxham, A., Roming, P. W. A., et al. 2010, ApJ, 718, L14
- Takahashi (2010) Takahashi, H. 2010, GRB Coordinates Network, 10594, 1
- Takahashi et al. (2007) Takahashi, T., et al. 2007, PASJ, 59, 35
- Tashiro et al. (2007) Tashiro, M. S., Abe, K., Angelini, L., et al. 2007, PASJ, 59, 361
- Uehara et al. (2010) Uehara, T., et al. 2010, GRB Coordinates Network, Circular Service, 10610, 1 (2010), 610, 1
- Urata et al. (2009) Urata, Y., et al. 2009, ApJ, 706, L183
- Urata et al. (2007) Urata, Y., et al. 2007, ApJ, 668, L95
- Urata et al. (2003) Urata, Y., et al. 2003, ApJ, 595, L21
- Yamaoka et al. (2009) Yamaoka, K., et al. 2009, PASJ, 61, 35
| Date | Start Time(UT) | Delay (days) | Filter | Exposure (s) | mag |
|---|---|---|---|---|---|
| 2010-04-19 | 6:36:31.94 | 5.186 | 300 s | 22.363 0.039 | |
| 2010-04-20 | 6:14:39.03 | 6.167 | 300 s | 22.894 0.043 | |
| 2010-04-20 | 6:33:24.63 | 6.188 | 300 s | 22.537 0.035 | |
| 2010-04-20 | 6:52:18.35 | 6.193 | 300 s | 23.113 0.043 | |
| 2010-05-11 | 5:48:04.70 | 27.16 | 300 s | 24.189 0.098 | |
| 2010-05-19 | 7:23:08.96 | 35.239 | 360 s | 24.700 0.149 | |
| 2010-06-11 | 7:26:45.20 | 57.642 | 360 s | 24.650 0.143 |
| GRB | T90 [s] | Epeak [keV] | [d] | [1052 erg] | [1050 erg] | h [GeV] | |
| 100414A | 1.368 | 21 | 2.30.2 | 34.5 | 17.6 | 4.3 (40s) | |
| 091003 | 0.8969aaCucchiara et al. (2009a) | 23 | — | 4.7 | — | — | |
| 090926A | 2.1062bbMalesani et al. (2009) | 13 | 10eeCenko et al. (2010) or ffRau et al. (2010) | 167.3 | 128 or | 19.6 (25s) | |
| 090902B | 1.822ccCucchiara et al. (2009b) | 19 | 6eeCenko et al. (2010) or 17ggMcBreen et al. (2010) | 193.3 | 104 or 257 | 33.4 (82s) | |
| 090510 | 0.903ddRau et al. (2009); McBreen et al. (2010) | 0.33 | — | — | — | — | 30.5 (0.829s) |