New H2 collision-induced absorption and NH3 opacity and the spectra of the coolest brown dwarfs
Abstract
We present new cloudy and cloudless model atmospheres for brown dwarfs using recent ab initio calculations of the line list of ammonia (NH3) and of the collision-induced absorption of molecular hydrogen (H2). We compare the new synthetic spectra with models based on an earlier description of the H2 and NH3 opacities. We find a significant improvement in fitting the nearly complete spectral energy distribution of the T7p dwarf Gliese 570D and in near infrared color-magnitude diagrams of field brown dwarfs. We apply these new models to the identification of NH3 absorption in the band peak of very late T dwarfs and the new Y dwarfs and discuss the observed trend in the NH spectral index. The new NH3 line list also allows a detailed study of the medium resolution spectrum of the T9/T10 dwarf UGPS J072227.51054031.2 where we identify several specific features caused by NH3.
1 Introduction
Brown dwarfs, with masses between – 0.075, are not massive enough to maintain steady hydrogen fusion in their cores and, except when they are very young, have effective temperatures below that of main sequence stars. Their low atmospheric temperatures allow the formation of molecules and condensates that leave conspicuous imprints on their spectral energy distribution (SED) that have led to the creation of two spectral classes: the L dwarfs with – 1400 K (Kirkpatrick, 2005) and the cooler T dwarfs extending down to K (Leggett et al., 2010a). The recent discovery of several extremely cool dwarfs by the Wide-field Infrared Survey Explorer (WISE) motivates the creation of a new spectral class: the Y dwarfs with K (Cushing et al., 2011).
The spectra of L dwarfs are characterized by absorption bands of VO, TiO, H2O, CO, FeH, CrH and the very broad doublets of Na I (0.59m) and K I (0.77m) (Kirkpatrick et al., 1999). While condensates, primarily corundum, magnesium silicates and iron, do not have spectral features as distinctive as those of molecules, their continuum opacity reddens the near-infrared spectrum of L dwarfs significantly. The effects of the cloud opacity peak at –1600 K or spectral type L6–L8. In the cooler T dwarfs, the condensate cloud layer sinks below the photosphere, TiO and VO have been lost to TiO2, VO2 and condensates (Burrows & Sharp, 1999; Lodders, 2002) the carbon chemistry has shifted to favor CH4 (Burgasser et al., 2002; Lodders & Fegley, 2002), and NH3 bands appear in the mid-infrared around T2 (Cushing et al., 2006). In the very latest T dwarfs and in the new Y dwarfs, weak bands of NH3 appear in the near-infrared (Delorme et al., 2008; Cushing et al., 2011).
Due to their additional degrees of freedom and greater complexity, the opacities of molecules are not nearly as well understood as those of atoms and ions. The primary molecular opacity data bases are the HITRAN (Rothman et al., 2003, 2005, 2009) and the GEISA (Jacquinet-Husson et al., 1999, 2005) compilations, which were developed for modeling the Earth’s atmosphere and consider the opacity of gases at temperatures of 300 K and below. Since the temperature in brown dwarf atmospheres can be up to 10 times higher, those line lists are missing the so-called “hot bands” that arise from the absorption of a photon from an excited lower level that is not thermally populated at 300 K. In some cases, the molecular line spectrum is so rich that individual transitions are unresolved in laboratory spectra or it becomes impossible to assign the observed transitions to specific molecular energy levels. The line lists are thus incomplete for the conditions encountered in brown dwarf atmospheres, especially for higher photon energies, hot bands, and weak transitions corresponding to near infrared and optical wavelengths. Incomplete molecular line lists limit the predictive capability of atmosphere models and synthetic spectra of brown dwarfs (Cushing et al., 2008; Stephens et al., 2009), a problem that was recognized in the first attempts to model the observed spectrum of a brown dwarf, the T7p dwarf Gliese 229B (Marley et al., 1996; Allard et al., 1996). In view of the difficulties in analyzing laboratory spectra of high temperature molecular gases, an alternative is to compute a molecular line list with a first-principles approach.
The past 15 years of brown dwarf research have motivated the theoretical modeling of the opacity of several key molecules. New molecular line lists for H2O (Partridge & Schwenke, 1997; Barber et al., 2006), CO (Goorvitch, 1994), TiO (Schwenke, 1998), VO (Plez, 1998), FeH (Dulick et al., 2003), CrH (Burrows et al., 2002), have improved the quality of the brown dwarf model spectra significantly. Methane (CH4) has been and remains the most important molecule observed in brown dwarf spectra (defining the T spectral class, but appearing as early as L5; (Noll et al., 2000)) with a very incomplete line list at near infrared wavelengths although some progress has been made (Freedman et al., 2008; Schwenke, 2002). The two most recent developments in this area are new calculations of a line list of ammonia (NH3) and of the continuum opacity from collision-induced absorption (CIA) by H2 molecules.
We study the effect of these two much anticipated new opacity calculations on the spectra and colors of brown dwarfs. In section §2, we discuss the nature of H2 CIA opacity, how the new calculation changes the opacity and how if affects the SED of cool brown dwarfs. The role of the NH3 opacity in brown dwarf spectra is presented in section §3, where we show how the new line list for NH3 affects primarily the near-infrared spectrum and brings new spectral features that can help define the T/Y dwarf boundary. We demonstrate the resulting improvement in synthetic spectra by comparing with the well-characterized SED of the T7.5 dwarf Gliese 570D and near infrared color-magnitude diagrams in section §4. The improved NH3 line list provides the opportunity to comment on the role of ammonia in extremely cool dwarfs near the T/Y transition and on recent detections of this molecule in the spectra of extreme objects (section §5). Concluding remarks are provided in section §6.
2 Collision-induced absorption by H2
Molecular hydrogen H2 is the most abundant component of brown dwarf atmospheres. Because of its high degree of symmetry, the H2 molecule has no permanent dipole moment and only quadrupole transitions are allowed, which are very weak. During a collision with another particle, however, the compound H2-particle system has a temporary dipole moment and can thus undergo a radiative dipole transition. The collision-induced absorption process is significant only at relatively high densities where collisions are frequent, such as in the atmospheres of planets and brown dwarfs. Three-body and higher order collisions also contribute to CIA but are probably negligible in brown dwarf atmospheres (Hare & Welsh, 1958).
While the probability of a dipole transition in a typical molecule involves only molecular properties, CIA also depends on the frequency of collisions with other atoms or molecules (primarily other H2 and He, by far the most abundant species), which is linearly dependent on the density of the gas. For a given metallicity, the relative importance of CIA absorption in a brown dwarf atmosphere is a measure of the density of the gas, which is closely tied to the surface gravity. On the other hand, the importance of H2 CIA decreases in higher metallicity atmospheres as the absorption from molecules involving heavier elements (CH4, CO, H2O, NH3) becomes dominant. This sensitivity of H2 CIA to gravity and metallicity is a useful spectral diagnostic in T dwarfs (Burgasser et al., 2002, 2003a; Burgasser, 2004b).
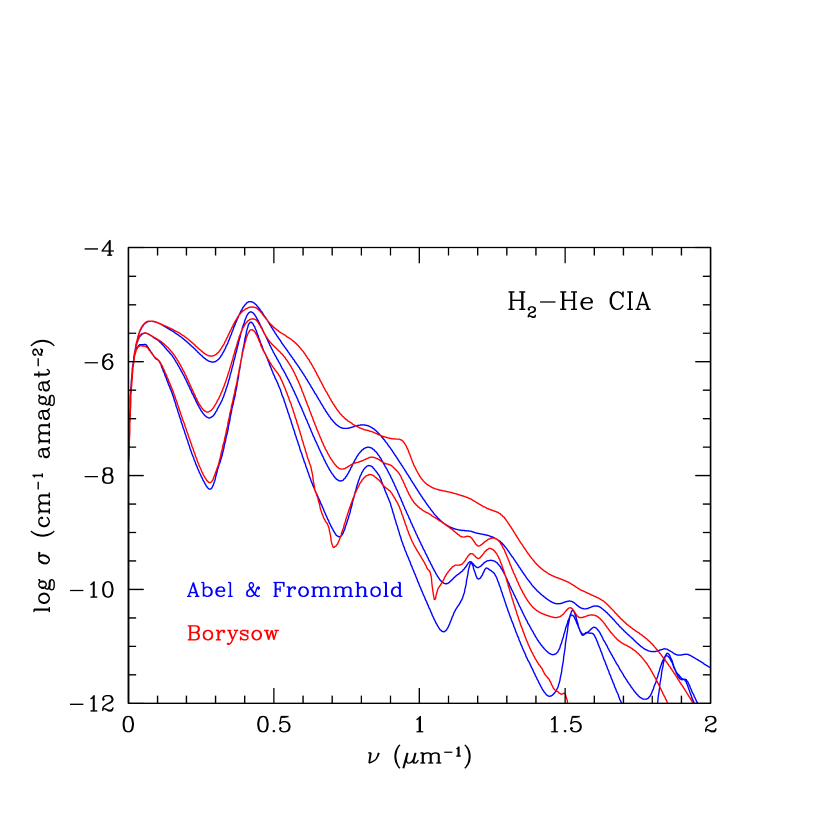
The H2 CIA transitions occur between vibrational-rotational levels of the H2 molecule and form a series of bands corresponding to , 1, 2, 3, etc., where is the vibrational quantum number of the molecule. Each band is formed by transitions between the different rotational levels for a given . Collisional broadening of the individual lines is comparable to the line spacing and thus H2 CIA is effectively a continuum source of opacity. Borysow and her collaborators calculated the H2-H2 and H2-He CIA coefficients in the temperature regime of interest for brown dwarf and white dwarf atmospheres (Borysow & Frommhold, 1986; Borysow et al., 1989; Jorgensen et al., 2000; Borysow et al., 2001; Borysow, 2002; Gustafsson & Frommhold, 2003)111Additional H2 CIA references as well as codes and tables can be found at http://www.astro.ku.dk/aborysow/programs/index.html, and those are universally used by brown dwarf modelers (Freedman et al., 2008; Sharp & Burrows, 2007; Allard et al., 2001). The H2-H2 and H2-He CIA coefficients are shown in Figures 1 and 2, respectively. While these two sources of opacity have similar frequency () and temperature () dependences, H2-He plays a secondary role since the collisions with He are about 10 times less frequent than with H2 as follows from their relative number densities. The absorption coefficient per H2 molecule is
| (1) |
where is the number density of species and is the H CIA cross section. The successive CIA bands corresponding to are clearly visible in Figures 1 and 2. At higher temperatures, weaker transition become more important and fill in the inter-band regions. The band centered at cm-1 (2.4m) is important in T dwarfs as it coincides with the band flux peak, which is caused by a minimum in the combined opacities of H2O and CH4. On the other hand, the and band flux peaks in the spectra of T dwarfs are shaped primarily by H2O and CH4 absorption. Thus, the and flux ratios reflect the relative importance of H2 CIA to the H2O and CH4 opacities which is affected primarily by the gravity and metallicity of the atmosphere. A relatively weaker band flux indicates a higher gravity (stronger H2 CIA) or a lower metallicity (weaker H2O and CH4 bands), or both. Our model atmospheres tend to underestimate the band flux, resulting in bluer than is observed for late T dwarfs (Saumon & Marley, 2008). We have long suspected that this systematic offset comes form an overestimate of the strength of the H2 CIA in the band.
2.1 New calculation of the H2 collision-induced absorption
First-principles calculations of molecular opacities are typically conducted in two steps. First, a potential energy surface is calculated for a range of molecular geometries representing variations in bond lengths and bond angles. This potential surface, which is multi-dimensional for polyatomic molecules, is obtained by solving the quantum mechanical Schrödinger equation for the electrons for each given nuclear geometry using methods of quantum chemistry. The potential surface then serves as input for the calculation of the eigenstates of the molecule and the induced dipole moment surface from which allowed transitions and their oscillator strengths can be calculated to generate a line list. For bands originating from excited states, or for relatively high energy transition (in the optical), the final state is well above the ground state of the molecule. The calculation of these lines requires an accurate knowledge of the potential energy surface far from the minimum that approximately corresponds to the ground state energy, which involves many subtle quantum mechanical effects and requires extensive calculations for widely separated configurations of nuclei. The calculation of higher energy transitions and of “hot bands” is thus increasingly difficult.
The growing evidence from brown dwarf spectra that something was amiss in the band of H2 CIA as well as applications to ultracool white dwarfs (Bergeron, Saumon & Wesemael, 1995) prompted a new calculation of the H2-H2 and H2-He CIA opacity in the entire regime of temperatures and frequencies of interest (Frommhold et al., 2010; Abel et al., 2011, 2012). New, high accuracy potential energy surfaces and induced dipole surfaces were generated for these two CIA processes. The resulting opacity was calculated on a fine temperature and frequency grid, from to cm-1 and K for H2-H2 and 20 to 20000 cm-1 and K for H2-He (Richard et al., 2012). The H2-H2 table is being extended to the same grid as the H2-He table. In each case, the entire parameter range is covered in a uniform manner, while earlier tabulations used different approximations and potential surfaces for different temperature and frequency ranges. As is the case for the older calculations, the new H2-H2 opacities are in excellent agreement with experimental data, which are limited to K (Frommhold, 1993; Abel et al., 2011). Comparisons with the CIA opacity previously used in modeling brown dwarf atmospheres are shown in Figures 1 and 2. As expected, differences are negligible or minimal at low temperatures. The differences become substantial at 2000 K in the roto-translational band for H2-H2 (cm-1) and in all roto-vibrational bands (). In the fundamental band (), which affects the band flux in brown dwarfs, the H2-H2 CIA has decreased by 24% at 1000K and by 44% at 2000K, which goes in the direction required to bring the band flux of the models into better agreement with the observations. The blue side of the fundamental band of H2-H2 CIA extends into the photometric band where the absorption has decreased somewhat at temperatures above K. The H2-He contribution (Fig. 2) shows similar variations, except that the absorption coefficient increases at the peaks of the fundamental and first overtone bands. At frequencies above cm-1, the corrections can be factors of 3 or more. This matters less in brown dwarfs as H2 CIA is not an important source of opacity at optical wavelengths and the He abundance is % that of H2.
The effect of the change in the CIA opacity is shown in Fig. 3 where spectra computed with the old and the new opacity but with the same atmospheric structures, are compared. All the flux peaks in the near infrared are affected, with rather modest flux increases of . Since the new H2 CIA opacity is nearly identical to the older calculation at K and increasingly differs at higher temperatures, the differences in the spectra tend to be larger at higher and nearly vanish for K except in the and bands which are relatively transparent and probe the atmosphere at temperatures well above . Since the CIA opacity increases with the gas density, i.e. with gravity, lower gravity spectra are less affected by the new CIA. For example, at (cgs), the flux in the peaks of the SED increases by less than 7%. At effective temperatures higher than those shown in Fig. 3, a greater change in the spectrum would be expected in cloudless models. However, in brown dwarfs atmospheres with K the continuum opacity of the condensates overwhelms the H2 CIA opacity and the spectrum is unaffected.
3 Ammonia opacity
In brown dwarf atmospheres, the chemistry of nitrogen is dominated by molecular nitrogen N2 and ammonia NH3, the latter being favored at higher pressures and lower temperatures (Lodders & Fegley, 2002). The transformation of N2 into NH3 occurs at K and is, along with the similar conversion of CO to CH4, one of the most significant chemical changes in brown dwarf atmospheres as decreases. While N2 has no permanent dipole moment and is effectively invisible in brown dwarf spectra222Like H2, N2 causes collision-induced absorption (Borysow & Frommhold, 1986, 1987), but its mole fraction of makes this contribution to the opacity in brown dwarf atmospheres completely negligible. the fundamental band of NH3 in the 10–11m region is seen in T2 and later dwarfs (Cushing et al., 2006) and the entire 9–14m region is affected by NH3 absorption (Saumon et al., 2006). Ammonia has a series of weaker overtone bands in the near infrared, two of which are centered at 2.0 and 1.5m and fall in the and photometric bands where the SEDs of T dwarfs show emission. The apparition of these bands in the spectra of very cool brown dwarfs has been suggested as a trigger for a new spectral class (Burrows et al., 2003; Leggett et al., 2007a; Kirkpatrick, 2008).
Saumon et al. (2000) reported the detection of three NH3 features in a spectrum of the T7p Gliese 229B in the 2.02 – 2.045m range but other expected NH3 features were missing. This tentative detection was followed by a decade where no other near-infrared spectrum of T dwarfs was taken at high enough resolution in the band to reveal NH3 features. The first unambiguous detection of NH3 in brown dwarfs was achieved with the Infrared Spectrograph of the Spitzer space telescope that clearly showed the 10–11m band in the combined spectrum of Indi Bab (T1+T6) (Roellig et al., 2004; Mainzer et al., 2007) and then in all dwarfs of type T2 and later observed with the IRS (Cushing et al., 2006; Saumon et al., 2007; Cushing et al., 2008; Stephens et al., 2009; Leggett et al., 2010b). Recently, the search for extremely cool dwarfs has uncovered several objects with K where the blue wing of the band flux peak appears depressed due the presence of NH3 (Delorme et al., 2008; Lucas et al., 2010; Liu et al., 2011; Cushing et al., 2011). Finally, a new near-infrared spectrum of the K T9 dwarf UGPS J072227.51054031.2 contains NH3 features (Bochanski et al., 2011). The detection of NH3 in the near-infrared spectrum of several ultracool dwarfs is one of the factors that motivate the creation of the new Y spectral class (Cushing et al., 2011).
The analysis of the spectral signature of NH3 in T dwarfs is complicated by the presence of vertical mixing in the atmosphere and by the invisibility of N2. Because the time scale for the conversion of N2 to NH3 is very long at low temperatures, gas eddies from very deep in the atmospheres where N2 and NH3 are in chemical equilibrium at high temperatures can be transported vertically by convection and slow mixing in the radiative zone to regions of lower temperatures on a time scale that is much shorter than the N NH3 conversion can take place, resulting in a reduced NH3 abundance (Fegley & Lodders, 1994, 1996; Lodders & Fegley, 2002; Saumon et al., 2006; Hubeny & Burrows, 2007). This process can reduce the observed abundance of NH3 by factors of , weakening the NH3 bands noticeably. Reduced NH3 absorption in the 914m region has been found in every T dwarf observed with the Spitzer IRS with a high enough S/N ratio (Saumon et al., 2006; Mainzer et al., 2007; Saumon et al., 2007; Burgasser et al., 2008b; Leggett et al., 2009, 2010b) and can be fully explained by considering the convective mixing time scale and the time scale for N NH3 conversion. Considering the relatively well understood chemistry of nitrogen and the universality of a deep convection zone in the atmospheres of brown dwarfs, it is reasonable to assume that the abundance of NH3 is reduced by vertical transport in all T dwarfs.
In view of the currently very limited opportunities for spectroscopic observations of brown dwarfs in the mid-infrared and the relative ease of near-infrared spectroscopy, the classification of the growing number of very late T dwarfs and of the new Y dwarfs relies primarily on their near infrared spectral characteristics where NH3 figures prominently as a new spectral index indicator (Delorme et al., 2008; Lucas et al., 2010; Cushing et al., 2011; Burgasser et al., 2011) as anticipated by Burrows et al. (2003); Leggett et al. (2007a) and Kirkpatrick (2008). The importance of NH3 as a strong absorber in the mid-infrared, an indicator of non-equilibrium chemistry, and an important marker for the spectral classification of very late T dwarfs and Y dwarfs demands a high quality line list to compute reliable models.
3.1 New theoretical NH3 line list
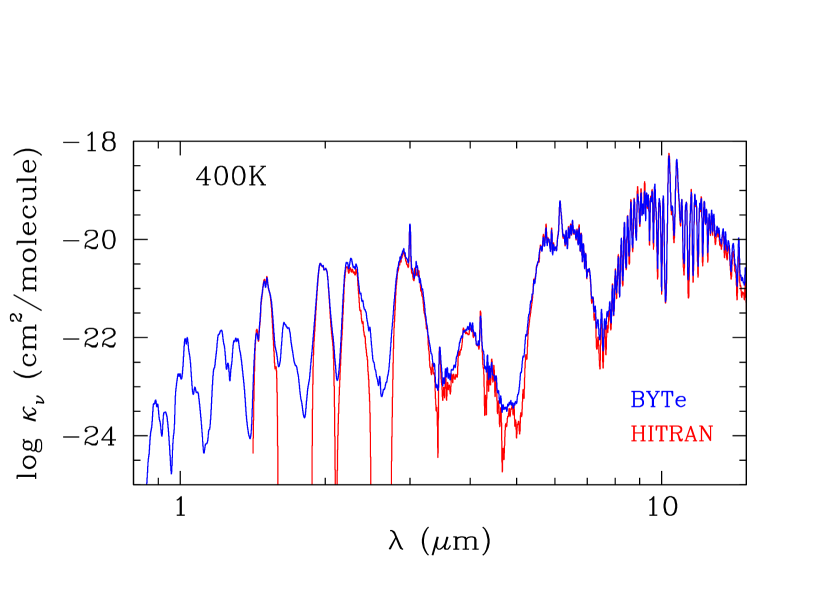
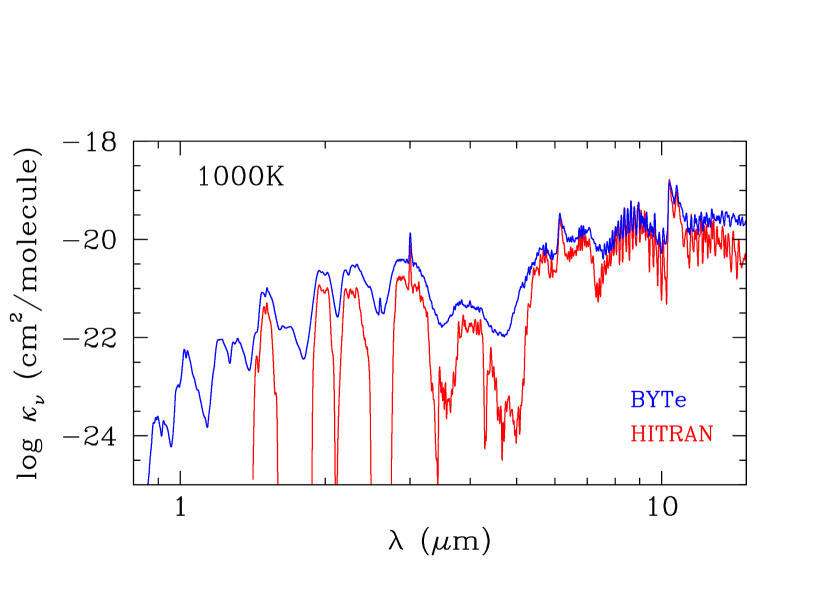
Our previous models used a NH3 line list from the HITRAN data base (Rothman et al., 2003, 2005, 2009) supplemented with room temperature data in the 60007000 cm-1 range (Freedman et al., 2008; Sharp & Burrows, 2007). In principle, the fundamental band at m should be well represented in the low temperature (K) HITRAN data base but the line list becomes increasingly incomplete at shorter wavelengths and higher temperatures. The resulting opacity at 400 and 1000 K is shown in Figs. 4 and 5. There are several gaps in the inter band regions 2.5–2.75m, m and 1.6–1.88m, and the list stops at 1.42m. Such a line list is inadequate to analyze the rapidly growing spectroscopic data for K dwarfs, which has motivated recent experimental (Hargreaves, Li & Bernath, 2011) and theoretical work on ammonia (Huang, Schwenke & Lee, 2011, 2011; Yurchenko, Barber & Tennyson, 2011).
A new extensive line list for NH3 has recently been calculated from first principles. It is based on a new potential energy surface (Yurchenko et al., 2005) that has been refined by fitting calculated energy levels to nearly 400 levels that are accurately known experimentally (Yurchenko, Barber & Tennyson, 2011). The resulting energy levels agree with the experimental values to within 1 cm-1 and generally under 0.1 cm-1. This ‘BYTe’ NH3 line list (Yurchenko, Barber & Tennyson, 2011) contains over 1.1 billion lines, compared to in HITRAN. It extends from 0 to 12000 cm-1 (0.83m) and is applicable up to 1500 K. An independent calculation of a NH3 line list is under way (Huang, Schwenke & Lee, 2011). Figures 4 and 5 show the improvement of the BYTe line list over the HITRAN opacity. At 400 K, we expect the HITRAN opacity to be quite good since it is based on data acquired primarily at room temperature. This is indeed what the BYTe line list shows as both are nearly identical near the center of all the bands in common between the two line lists. In addition, the BYTe line list includes new bands at 1.65m and shortward of 1.4m, and contains many weak lines that fill in the inter band regions where there are gaps in the HITRAN line list. The differences become more dramatic at higher temperatures (Fig. 5) where the transitions from thermally excited levels come into play, reducing the contrast between the peaks and valleys of the opacity and increasing the band opacity by factors of compared to the HITRAN value. The opacity in the m also increases significantly.
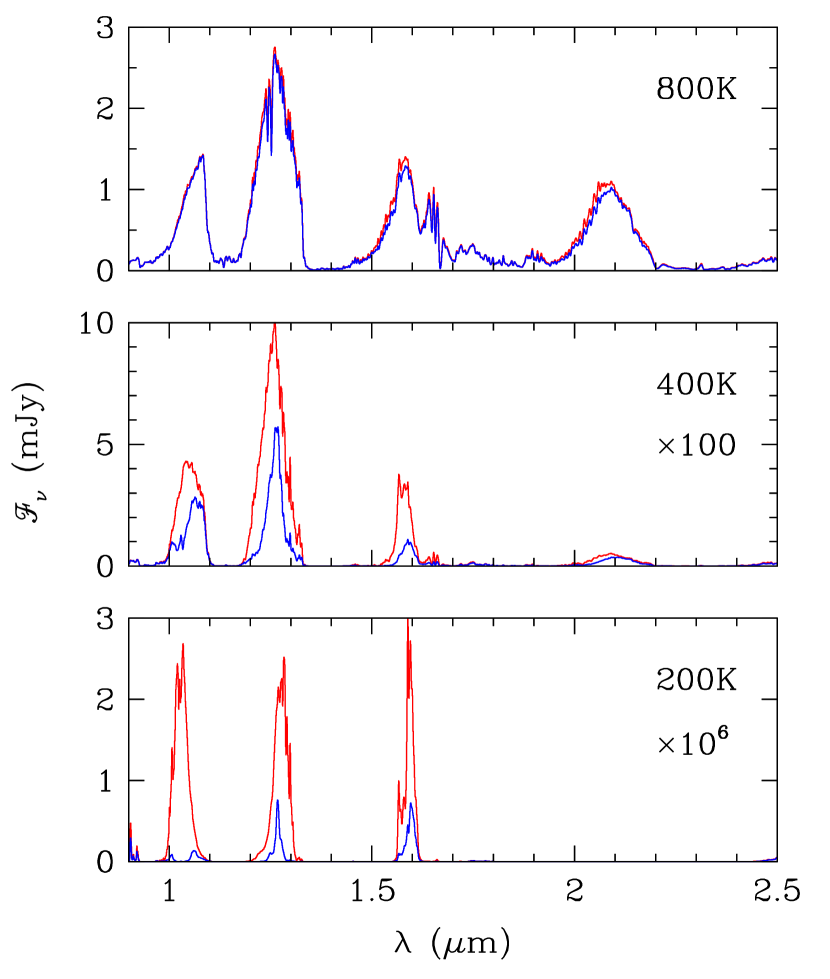
The effect of the change in NH3 opacity on the synthetic spectra is shown in Fig. 6. For this comparison, spectra computed with the HITRAN and the BYTe line lists use the same atmosphere structure. At K (not shown), the spectra are identical but at K there is a small flux decrease of % on the blue side of both the and peaks. At lower , the chemical equilibrium shifts to strongly favor NH3 over N2 as the dominant nitrogen bearing species and its opacity becomes more significant compared to the competing absorption from H2O and CH4. This leads to dramatic changes in the spectrum. All the near infrared flux peaks are reduced by factors of . In particular, the new bands at short wavelengths dramatically affect the shape of the and peaks at K. At the extremely low of 200 K, the changes are limited to the spectral regions were there are gaps in the HITRAN line list, and lead to very distinctive features in the and bands. In particular, the band peak is split in two. Figure 6 suggests that in addition to the NH spectral index which more or less measures the slope of the blue side of the band flux peak (Delorme et al., 2008), another NH3-sensitive index could be defined to measure the curvature of the band peak. In the mid-infrared (not shown), the most variation is shown by the 800 K spectrum with a % decrease in flux in the m region. The 400 and 200 K spectra are barely affected in the mid-infrared. All these differences decrease somewhat as gravity is increased. The spectra shown in Fig. 6 and discussed above are computed in chemical equilibrium. However, we expect that the NH3 abundance will be prevented from coming into equilibrium by convection, resulting in surface abundances times lower in the upper atmosphere. Consequently, NH3 absorption is more muted in non-equilibrium spectra and the changes discussed above are smaller than in model that are in chemical equilibrium. The one exception is the K model which is so cold that the entire atmosphere is dominated by NH3 whose abundance becomes nearly insensitive to convective mixing.
The recently identified Y dwarfs have K (Cushing et al., 2011). The spectra computed with the new BYTe line list indicate that broad NH3 features should be detectable in the near infrared, most notably as a shoulder on the blue side of the band peak at K which is split at K by a growing NH3 band centered at 1.03m. The band peak becomes triangular and the band peak narrows. The strength of these effects is reduced by the non-equilibrium abundance of NH3.
4 Models including both the new H2 CIA and NH3 opacities
We have computed new model atmospheres and synthetic spectra using the new H2 CIA and NH3 opacities. In all other aspects, these models are identical to those described in Saumon & Marley (2008); Marley et al. (2002) with additional details provided in Cushing et al. (2008) and Stephens et al. (2009). These new models, which include cloudless and cloudy atmospheres, were used in the recent analyzes presented in Cushing et al. (2011); Luhman et al. (2011) and Leggett et al. (2011). These new cloudless model spectra are compared to our previous models in Fig. 7, where, in contrast with Figs. 3 and 6, the structures are computed with their respective opacities and thus the model structures and spectra are self-consistent. In this case, the flux is redistributed along the SED to conserve the total flux (which was not the case in Figs. 3 and 6). At and 1000 K, the changes are modest and dominated by the new H2 CIA opacity. The reduced opacity in the first overtone band of H2-H2 CIA is responsible for the increased flux in the band peak (%) and a smaller increase in the band flux. The K spectrum also shows a 7% flux increase in the 4m peak but the 3–15m cloudless spectra are otherwise unaffected. Near the T/Y dwarf transition, where K, all four near infrared peaks in the spectrum are noticeably affected. Absorption by NH3 changes the shape of the and peaks and shaves off the blue side of the band peak. Back warming from this NH3 absorption pushes the flux out in the band, which is now % brighter, and in the 4–8m region where the flux increases by %.
4.1 Comparison with the spectrum of Gliese 570D
The T7.5 dwarf Gliese 570D (Burgasser et al., 2000) is the most thoroughly studied late T dwarf. Optical, near infrared, band, and Spitzer IRS spectroscopy are available – sampling % of the total flux emitted – as well as Spitzer IRAC and WISE photometry. As this brown dwarf is a companion to a nearby main sequence star, its distance and metallicity are accurately known and its age is fairly well constrained to 2–5 Gyr. Because Gl 570D is nearby and relatively bright, the whole data set is of high quality and very effectively constrains the models. It is an excellent test object to validate the new models and evaluate the improvements brought about by the new opacities. Detailed analyzes of Gl 570D (Geballe et al., 2001; Saumon et al., 2006; Geballe et al., 2009) have established that K and (cgs), where the ranges of and are correlated: a higher corresponds to a higher gravity. Solar metallicity was adopted based on the metallicity of the primary ([Fe/H]). Saumon et al. (2006) established that convective transport drives the NH3 abundance below the value expected from chemical equilibrium and obtained an very good fit of the entire SED of Gl 570D (see also Geballe et al. (2009)). Figure 8 shows the spectrum computed by Saumon et al. (2006) for those parameters within the above range that best reproduce the data and a new model computed with the same atmospheric parameters but with the new H2 CIA and NH3 opacities. There is significant improvement in the band peak which is now fitted very well. There is also a modest improvement in the 5.5–7.5m region and beyond 9m where NH3 absorption features overlap with H2O absorption. The new H2 CIA calculation, which is primarily responsible for the increased flux in the band represents a significant improvement over the previously available tabulation. Outside of the 9–14m region, NH3 absorption is rather weak at this , and the new NH3 opacity leads to very modest changes. We believe that the remaining discrepancies in our fot of Gl 570D, such as the width of the band peak and the depth of the 1.6m band of CH4, are primarily due to the very incomplete methane line list, which is presently in a similar state as the ammonia line list was prior to the first-principles calculation of Yurchenko, Barber & Tennyson (2011).
4.2 Comparison with near-infrared photometry
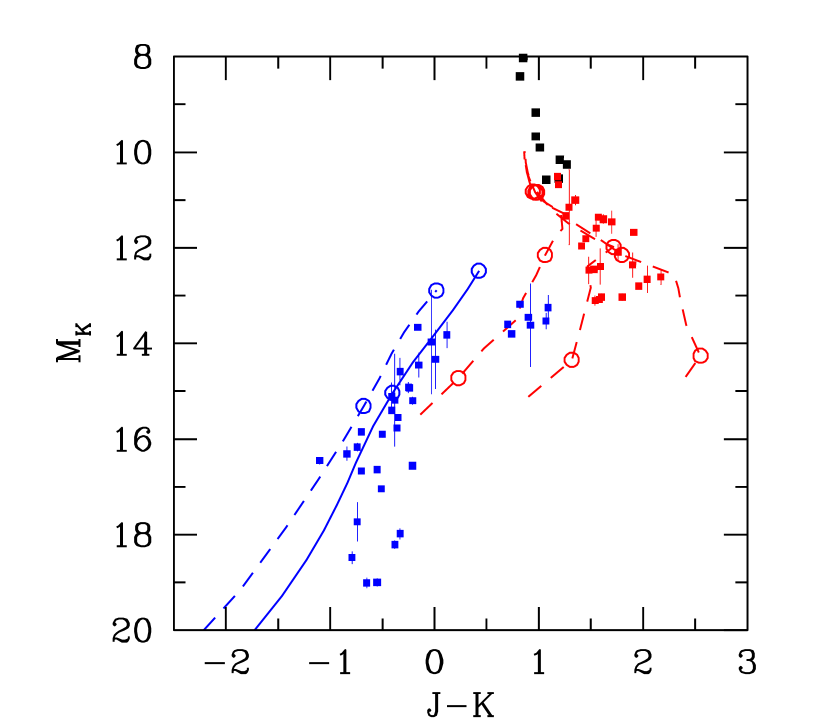
While a comparison with the SED of Gl 570D provides a detailed test of the new models, the overall effect of the new opacities can be better appreciated in color-magnitude diagrams where synthetic colors can be compared to a large set of photometric data. Prior to 2003, our models used the solar abundances of Lodders & Fegley (1998) and the cloudless sequence was in generally good agreement with the near infrared colors of late T dwarfs (Burgasser et al., 2002). A significant downward revision of the CNO abundances in the solar photosphere (Allende Prieto et al., 2002) motivated a change of the solar abundances in our models (Lodders, 2003) which moved the cloudless sequence to the blue in . The resulting sequence of [M/H]=0 cloudless models are too blue compared to late field T dwarfs, particularly in , when compared to the near infrared colors of late-T field dwarfs (Fig. 9 and Fig. 10e of Saumon & Marley (2008)) 333Note that the cloudless COND models of Allard et al. (2001) use the older solar abundances of Grevesse & Noels (1993) and agree very well with the observed near-infrared colors of late T dwarfs.. The new H2-H2 CIA has a weaker first overtone band which increases the band flux and moves the cloudless models to redder , largely compensating for the effect of the reduced CNO abundances (Fig. 9). The new sequence of models is still slightly bluer by than the late T dwarf sequence which may be due to missing CH4 opacity on the band peak. The spread of the observed sequence of late T dwarf colors is significant and can be accounted for by the observed distribution in metallicity of field dwarfs (Fig. 15f of Saumon & Marley (2008)). The very latest T dwarfs recently discovered, with reveal a saturation in and are redder than the calculated cloudless sequences. This may be caused by several limitations in our models such as the near infrared opacity of CH4, the presence of clouds of compounds with low condensation temperature such as Na2S, or the appearance of water clouds. Note that water condensation is included in the chemistry of the atmosphere and the gas phase H2O abundance is reduced in the low- models where water condenses. We are investigating the role of clouds in low- atmospheres and the results will be reported in a separate publication. On the other hand, our cloudy sequences account for iron and silicate clouds and reproduce the SEDs and infrared colors of field L dwarfs fairly well (Saumon & Marley, 2008; Cushing et al., 2008; Stephens et al., 2009). Cloudy models with K are representative of field L dwarfs and the HR 8799 planets (Marley et al., 2012) and are shown in Fig. 9. These hotter, cloudy models are barely affected by the new opacities and their near infrared colors are very nearly identical to the older ones down to K. This is a consequence of the opacity of condensates which reduces the importance of the H2 CIA and of the higher temperatures of the cloudy models which reduce the abundance of NH3.
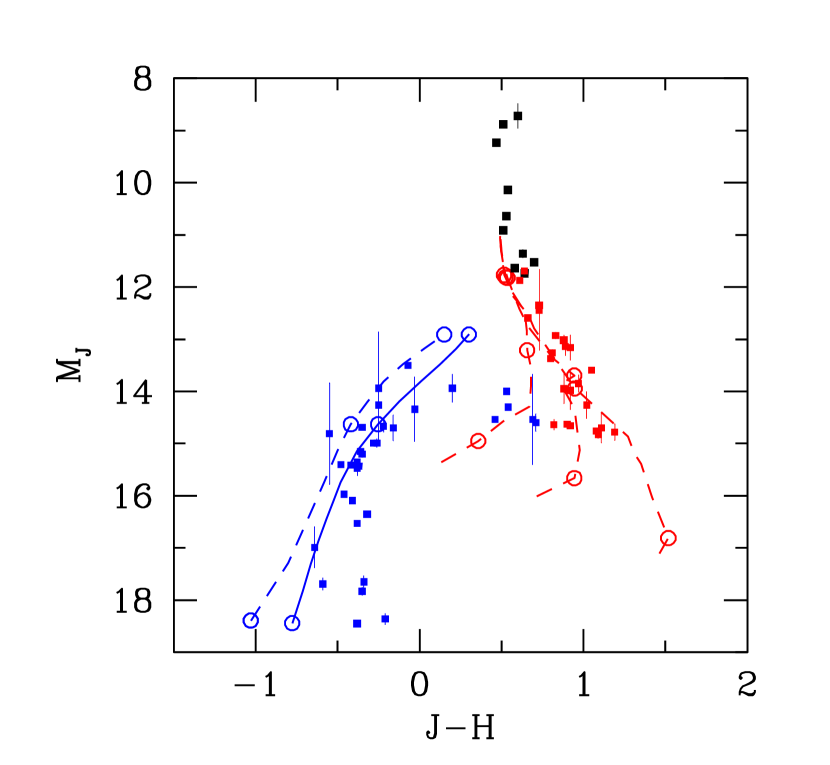
The same general picture emerges from the versus color-magnitude diagram (Fig. 10) although the new cloudless model now represents the sequence of the late field T dwarfs quite well444This may be somewhat fortuitous in view of the model limitations mentioned above, particularly the poorly modeled 1.6m band of CH4 which affects the band (Fig. 8). The data suggest that the color saturates around (see also Kirkpatrick et al. (2011) at which is further supported by the position of the Y0 dwarf WISEP J in this color-magnitude diagram (, , Cushing et al. (2011); Kirkpatrick et al. (2011)). Our cloudless sequences do show such a minimum in at K and a rapid turnover to the red at lower . However, the models do not turn over to the red soon enough and reach values of , which is bluer than is observed. It will be interesting to see how the near infrared color-magnitude diagrams will be affected by a more complete CH4 line list when it becomes available, or by the inclusion of a water cloud in the models.
5 Ammonia and Y dwarfs
Increased absorption in the near infrared has been observed on the blue side of the band peak in the very late T dwarfs and in the new Y dwarfs and it is thought to be due to NH3. The strength of the 1.5m band of ammonia can be quantified with the NH index defined by Delorme et al. (2008)
| (2) |
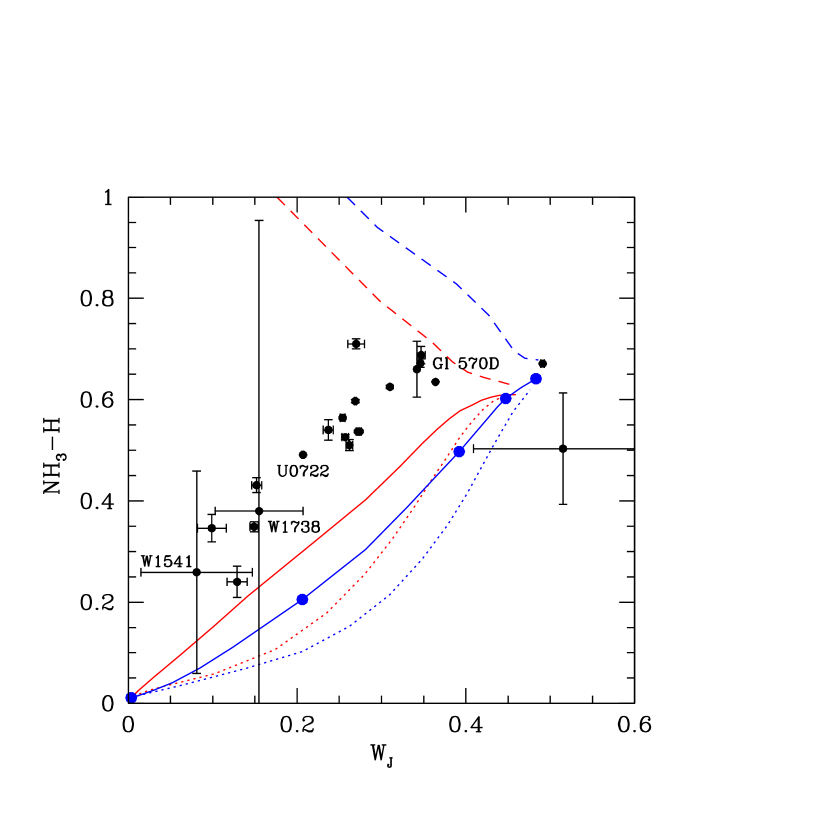
Smaller values of NH indicate a relatively low flux on the blue side of the band peak that is expected from stronger NH3 absorption. A compilation of the data for the latest dwarfs known is shown in Fig. 11. The NH index strongly correlates with the width of the band peak (measured by the index, Warren et al. (2007)), and with spectral type (Burningham et al., 2008; Cushing et al., 2011), with later types having smaller NH. Figure 11 shows a break in the slope at corresponding to spectral type T8 (Cushing et al., 2011). Based on the appearance of the blue side of the band peak of the Y0 dwarf WISEP J1738+2732 – one of the most extreme objects in Fig. 11 – compared to earlier T8 and T9 dwarfs, Cushing et al. (2011) tentatively ascribe the absorption to NH3.
The models shown in Fig. 11 reproduce the observed trend very well and indicate that the reduced abundance of NH3 caused by non-equilibrium chemistry is favored. The dashed lines show the indices computed from the same models after the opacity of NH3 has been removed with a trend that is strongly at odds with the data. The decrease in the modeled NH at K (or spectral type later than T8) is caused by the 1.5m band of NH3. The expectation that NH3 bands would appear in the near infrared at low enough and its detection as a depression in the blue side of the band peak is thus well supported on a quantitative basis by the models. However, the non-equilibrium models still show a systematic offset from the data, even for the low gravity of (cgs) which, for these low , would correspond to a rather low mass of MJupiter. It is very likely that the incomplete CH4 line list is responsible for this systematic shift since methane is a strong absorber in the band and a moderate absorber in the band (Fig. 8).
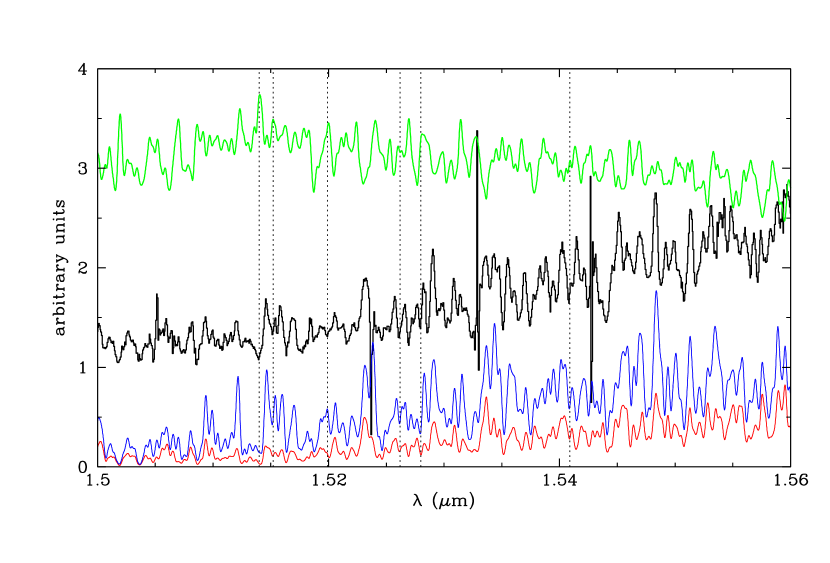
Without the benefit of models, or with models of limited fidelity, the interpretation of the observed trends in spectral indices can be ambiguous, particularly when considering their variations over a wide range of . On the other hand, the direct detection of spectral features provides much more secure evidence of the presence of specific molecular species. While the detection of NH3 in the 2.02–2.045m region of the spectrum of the T7p Gl 229B (Saumon et al., 2000) was tentative, Bochanski et al. (2011) identified 11 ammonia features in their medium resolution () near infrared spectrum of the T9 dwarf UGPS 072227.51054031.2 (here after UGPS 072205). Figure 12 shows the portion of their spectrum with the most NH3 features. For comparison, the top curve shows the log of the NH3 opacity computed from the BYTe line list at the conditions corresponding to the atmospheric level where this part of the spectrum is emitted. The lowest curve is an unscaled model spectrum with K and , solar metallicity, and cm2/s (Leggett et al., 2011). The six NH3 absorption features identified by Bochanski et al. (2011) in this part of the spectrum all have corresponding troughs in the model spectrum. Four of these features also match peaks in the NH3 opacity but the other two (1.5264 and 1.5411m) do not and their attribution to NH3 is not secure.
To better identify NH3 absorption features in the spectrum of UGPS 072205 we show in Fig. 12 a spectrum computed from the same atmosphere model but without any NH3 opacity (blue curve). There is obviously much NH3 absorption over the entire range shown, even considering the fact that the model spectrum has a reduced (non-equilibrium) abundance of NH3. This is fully consistent with the smaller value of the NH index of UGPS 072205 compared to earlier T dwarfs (Fig. 11). However, a careful comparison of the spectra with and without NH3 does not reveal any distinct feature at this spectral resolution. Every feature in one spectrum appears in the other, albeit with a different amplitude. For example, the 1.5142m absorption feature matches a peak in the NH3 opacity and an edge in the model spectrum (Fig. 12), but that edge also appears in the spectrum computed without NH3, making the attribution doubtful. The model spectrum reproduces individual features of the observed spectrum fairly well (after scaling), but not exactly, which makes the attribution of specific features problematic. We find this to be also the case in other regions where Bochanski et al. (2011) found NH3 features (1.21–1.27m, 1.56–1.64m and at 1.990m).555For completeness, we note that the two features in the low-resolution () spectrum of UGPS 072205 pointed out by Lucas et al. (2010) at m and at m can be identified with synthetic spectra at higher resolution as blends of H2O features. A weaker blend of H2S features also contributes to the latter.
The situation is different in the 1.96–2.05m spectral region where Saumon et al. (2000) found 3 ammonia features in Gl 229B. Figure 13 shows this spectral region with the same models and opacity shown in Fig. 12 (with different scalings for clarity). The vertical solid and dashed lines correspond to 19 NH3 absorption features that are clearly identifiable from the difference between the spectrum computed with the non-equilibrium NH3 abundance (red) and the spectrum computed without NH3 opacity (blue). In this spectral range, almost every peak in the NH3 opacity (green) corresponds to a distinct absorption feature in the synthetic spectrum. The solid lines identify 8 absorption features that are present in the spectrum of UGPS 0722-05666If we ignore the single high-valued pixel making up the spike in the data at 2.0175m, the NH3 feature stands out., and the dashed lines indicate 6 NH3 features that are not clearly detected in the spectrum and 5 that appear to be missing. Two of the detected features (2.0374 and 2.0455m) match those found in Gl 229B by Saumon et al. (2000). An absorption feature clearly identified in Bochanski et al. (2011) at 1.9905m (dotted line) corresponds to a well-defined absorption feature in the model spectrum. This feature is barely affected by the removal of all NH3 opacity, however, and does not match very well with the NH3 opacity peak centered at 1.9896m. In our model spectrum, this absorption is caused by H2O.
We conclude that the detection of ammonia absorption features in the near infrared spectra of very late T dwarfs and Y dwarfs is easier in the band near 2m than in the band near 1.53m. The main reason for this is that the NH3 opacity in the band is composed of a series of more or less equally spaced and well separated peaks (Fig. 13) while in the band it has a denser irregular structure with a smaller dynamic range as well as a peak opacity that is about one order of magnitude smaller (Figs. 12 and 4). With higher resolving power it becomes possible to isolate NH3 features in the band. For example, with , about a dozen features stand out in the 1.51–1.57m region of the model shown in Fig. 12. For dwarfs cooler than K, the condensation of water becomes significant (Burrows et al., 2003), removing H2O from the gas and unmasking the NH3 bands. For instance, the blue side of the band peak becomes completely dominated by NH3 absorption and NH3 features should be readily detectable in the spectrum. This is also true in the 2 – 2.05m region, although the flux is much lower than at 1.55m. The NH3 bands will thus become stronger with lower until ammonia itself begins to condense at K (Burrows et al., 2003).
6 Conclusion
We have computed new cloudy and cloudless models and synthetic spectra777The synthetic spectra are available upon request to D. Saumon (dsaumon@lanl.gov). of brown dwarf atmospheres using recent first-principles calculations of the opacity of NH3 and of the collision-induced absorption of H2. Both constitute very significant theoretical improvements in the modeling of the opacity and, in the case of NH3, the BYTe line list greatly expands over the HITRAN line list that is based primarily on experimental results. The cloudy models, relevant to L dwarfs, are barely affected by the new opacity because of their higher where NH3 has a very low abundance and of the condensate opacity that largely conceals the H2 CIA 888This is no longer the case in low-metallicity L subdwarfs where H2 CIA is noticeable (Burgasser et al., 2003a, 2009; Cushing et al., 2009).. We have thus focused on the role of these two opacities in cloudless models, which are relevant to spectral types T4 and later.
The most notable change in the collision-induced absorption is a reduction of the opacity in the first roto-vibrational band centered at 4200 cm-1 (2.4m), resulting in an increased band flux. This corrects a deficiency in our earlier fit of the SED of Gl 570D (Saumon et al., 2006) and we now obtain a remarkable fit of nearly the entire SED of this late T dwarf (Fig. 8). Another consequence is that the cloudless sequence shifts toward bluer colors in near infrared color-magnitude diagrams and is in much better agreement with the colors of the late T dwarfs in the field. This new accurate H2 CIA opacity will strengthen the analysis of gravity and metallicity indicators in the spectra of late T dwarfs and L subdwarfs and help reduce the uncomfortably large uncertainty in spectroscopic determinations of the gravity of brown dwarfs.
The new BYTe line list for NH3 greatly improves the near infrared opacity of ammonia by adding several new bands at short wavelengths as well as a very large number of “hot transitions” that fill in gaps in the HITRAN line list. We can now reliably calculate the opacity of NH3 at temperatures of several hundreds of degrees, which is crucial even for the coolest known dwarfs as the , and bands typically probe temperatures well above . The importance of this line list for the study of the T/Y transition and the new Y dwarfs cannot be overstated. Our models show that NH3 develops very distinct signatures in the and band flux peaks, and confirms the tentative identification of NH3 absorption on the blue side of the band peak which had been anticipated by Burrows et al. (2003). More quantitatively, the new models reproduce the trend in the spectral indices NH and , confirming that the rapid decrease in NH at spectral types later than T8 is due to NH3 absorption. Thus, all the new WISE objects assigned to the Y dwarf class by Cushing et al. (2011) show NH3 absorption in the band. Furthermore, the data favors models where vertical transport reduces the NH3 abundance in the observable part of the atmosphere. At a more detailed level, the medium resolution near infrared spectrum of the T9 UGPS 0722-05 (Bochanski et al., 2011) provides a rare opportunity to compare data with the detailed predictions of spectral features by the models and of the underlying molecular opacities. While we found that none of the features pointed out by Bochanski et al. (2011) can be unambiguously attributed to NH3, our new models allow the identification of 9 other NH3 absorption features around 2m. The models clearly show that while there is strong NH3 absorption in the band in late T dwarfs and in the Y0 dwarfs, the general behavior of the NH3 absorption in the 1.55m region makes it more difficult to isolate individual features than in the 2.0m region, requiring a resolving power of the order of compared to in the band.
Despite the progress that we have demonstrated here, obvious problems remain with the models. For instance, the fit of Gl 570D still has discrepancies that stand out. The near infrared color-magnitude diagrams for field dwarfs fail to reproduce the saturation (and possible turnover) revealed by the data at very low . The spectral indices NH and do not yet provide a quantitative diagnostic of the atmospheric structure and chemistry. With these two new calculations of molecular opacities that affect primarily late T dwarfs and the new class of Y dwarfs, reliable opacities are available for all important gas phase absorbers except for CH4. The inadequacy of the the current line list of methane has been much maligned ever since the very first spectral modeling of a T dwarf (Marley et al., 1996; Allard et al., 1996). We believe that for cloudless atmosphere models, the CH4 opacity is the only remaining obstacle of significance to modeling the spectroscopic data accurately. The availability of a CH4 line list comparable in quality and scope to the BYTe NH3 line list would open the door to reliable determinations of T dwarf gravities and metallicities, two fundamental parameters that have remained elusive for the vast majority of brown dwarfs.
References
- Abel et al. (2011) Abel, M.,Frommhold, L., Li, X. & Hunt, K.L.C. 2011, J. Phys. Chem., 115, 6805
- Abel et al. (2012) Abel, M.,Frommhold, L., Li, X. & Hunt, K.L.C. 2012, J. Phys. Chem., in press
- Ackerman & Marley (2001) Ackerman, A. S. & Marley, M. S. 2001, ApJ, 556, 872
- Allende Prieto et al. (2002) Allende Prieto, C., Lambert, D.L. & Asplund, M. 2002, ApJ, 573, L137,
- Allard et al. (1996) Allard, F., Hauschildt, P. H., Baraffe, I. & Chabrier, G. 1996, ApJ, 465, L123
- Allard et al. (2001) Allard, F., Hauschildt, P. H., Alexander, D. R., Tamanai, A. & Schweitzer, A. 2001, ApJ, 556, 357
- Barber et al. (2006) Barber, R.J., Tennyson, J., Harris, G.J. & Tolchenov, R.N. 2006, MNRAS, 368, 1087
- Bergeron, Saumon & Wesemael (1995) Bergeron, P, Saumon, D. & Wesemale, F. 1995, ApJ, 443, 764
- Bochanski et al. (2011) Bochanski, J.J., Burgasser, A.J., Simcoe, R.A. & West, A.A. 2011, AJ, 142, 169
- Borysow (2002) Borysow, A. 2002, A&A, 390, 779
- Borysow & Frommhold (1986) Borysow, A. & Frommhold, L. 1986, ApJ, 304, 849
- Borysow & Frommhold (1986) Borysow, A. & Frommhold, L. 1986, ApJ, 311, 1043
- Borysow & Frommhold (1987) Borysow, A. & Frommhold, L. 1987, ApJ, 320, 437
- Borysow et al. (1989) Borysow, A., Frommhold, L. & Moraldi, M. 1989, ApJ, 336, 495
- Borysow et al. (2001) Borysow, A., Jorgensen, U.G. & Fu, Y. 2001, J. Quant. Spec. Radiat. Transf., 68, 235
- Burgasser et al. (2000) Burgasser, A. J. et al. 2000, ApJ, 531, L57
- Burgasser et al. (2002) Burgasser, A. J. et al. 2002, ApJ, 564, 421
- Burgasser et al. (2003a) Burgasser, A. J., Kirkpatrick, J.D., Burrows, A., Liebert, J., Reid, I.N., Gizis, J.E., McGovern, M.R., Prato, L. & McLean, A.S. 2003, ApJ, 592, 1186
- Burgasser et al. (2003b) Burgasser, A. J., Kirkpatrick, J.D., Liebert, J. & Burrows, A. 2003, ApJ, 594, 510
- Burgasser (2004a) Burgasser, A. J. 2004, ApJS, 155, 191
- Burgasser (2004b) Burgasser, A. J. 2004, ApJ, 614, L73
- Burgasser et al. (2006) Burgasser, A.J., Kirkpatrick, J.D., Cruz, K. L., Reid, N. I., Leggett, S. K., Liebert, J., Burrows, A. & Brown, M. 2006, ApJS, 166, 585
- Burgasser et al. (2008b) Burgasser, A.J., Tinney, C.G., Cushing, M.C., Saumon, D., Marley, M.S., Bennett, C.S. & Kirkpatrick, J.D. 2008, ApJ, 689, L53
- Burgasser et al. (2009) Burgasser, A.J., Witte, S., Helling, Ch., Sanderson, R.E., Bochanski, J.J. & Hauschildt, P.H. 2009, ApJ, 697, 148
- Burgasser et al. (2011) Burgasser, A.J., Gelino, C.R., Cushing, M.C. & Kirkpatrick, D.J. 2011, ApJ, in press (arXiv/astro-ph.1110.4664B)
- Burningham et al. (2008) Burningham, B. Pinfield, D.J., Leggett, S.K., Tamura, M., Lucas, P.W., Homeier, D., Day-Jones, A., Jones, H.R.A., Clarke, J.R.A., Ishii, M., and 8 coauthors, 2008, MNRAS, 391, 320
- Burningham et al. (2009) Burningham, B. Pinfield, D.J., Leggett, S.K., Tinney, C.G., Liu, M.C., Homeier, D., West, A.A. Day-Jones, A., Huelamo, N., Dupuy, T.J. and 10 coauthors 2009, MNRAS, 395, 1237
- Burningham et al. (2011a) Burningham, B., Lucas, P.W. Leggett, S.K., Smart, R., Baker, D., Pinfield, D.J., Tinney, C.G., Homeier, D., Allard, F., Zhang, Z.H. and 8 coauthors 2011, MNRAS, 414, L90
- Burningham et al. (2011b) Burningham, B., Leggett, S.K., Homeier, D., Saumon, D., Lucas, P.W., Pinfield, D.J., Tinney, C.G., Allard, F., Marley, M.S., Jones, H.R.A. and 5 coauthors 2011, MNRAS, 414, 3590
- Burrows et al. (2002) Burrows, A., Ram, R.S., Bernath, P., Sharp, C.M. & Milsom, J.A. 2002, ApJ, 577, 986
- Burrows & Sharp (1999) Burrows, A., & Sharp, C.M. 1999, ApJ, 512, 843
- Burrows et al. (2003) Burrows, A., Sudarsky, D. & Lunine, J.I. 2003, ApJ, 596, 587
- Cushing et al. (2006) Cushing, M.C., Roellig, T.L., Marley, M.S., Saumon, D., Leggett, S.K., Kirkpatrick, J.D., Wilson, J.C., Sloan, G.C., Mainzer, A.K., Van Cleve, J.E. & Houk, J.R. 2006, ApJ, 648, 614
- Cushing et al. (2008) Cushing, M.C., Marley, M.S., Saumon, D., Kelly, B.C., Vacca, W.D., Rayner, J.T., Freedman, R.S., Lodders, K. & Roellig, T.L. 2008, ApJ, 678, 1372
- Cushing et al. (2009) Cushing, M.C., Looper, D., Burgasser, A.J., Kirkpatrick, J.D., Faherty, J., Cruz, K.L., Sweet, A., & Sanderson, R.E. 2009, ApJ, 696, 986
- Cushing et al. (2011) Cushing, M.C., Kirkpatrick, J.D., Gelino, C.R. Griffith, R.L., Skrutskie, M.F., Mainzer, A.K., Marsh, K.A., Beichman, C.A., Burgasser, A.J., Prato, L.A., and 5 coauthors 2011, ApJ, 743, 50
- Dahn et al. (2002) Dahn, C. C., Harris, H. C., Vrba, F. J., Guetter, H. H., Canzian, B., Henden, A. A., Levine, S. E., Luginbuhl, C. B., Monet, A. K. B., Monet, D. G., and 8 coauthors, 2002, AJ, 124, 1170
- Delorme et al. (2008) Delorme, P., Delfosse, X., Albert, L., Artigau, E., Forveille, T., Reylé, C., Allard, F., Homeier, D., Robin, A.C., Willott, C.J., Liu, M.C. & Dupuy, T.J. 2008, A&A, 482, 961
- Dulick et al. (2003) Dulick, M., Bauschlicher, C.W. Jr., Burrows, A., Sharp, C.M., Ram, R.S. & Bernath, P. 2003, ApJ, 594, 651
- Fegley & Lodders (1994) Fegley, B. J. & Lodders, K. 1994, Icarus, 110, 117
- Fegley & Lodders (1996) Fegley, B. J. & Lodders, K. 1996, ApJ, 472, L37
- Freedman et al. (2008) Freedman, R.S., Marley, M.S. & Lodders, K. 2008, ApJS, 174, 504
- Frommhold (1993) Frommhold, L., 1993, Collision-induced absorption in gases, (Cambridge: Cambridge Univ. Press)
- Frommhold et al. (2010) Frommhold, L., Abel, M., Wang, F., Gustafsson, M., Li, X. & Hunt, K.L.C. 2010, Mol. Phys., 108, 2265
- Geballe et al. (2001) Geballe, T.R., Saumon, D., Leggett, S.K., Knapp, G.R., Marley, M.S. & Lodders K. 2001, ApJ, 556, 373
- Geballe et al. (2009) Geballe, T.R., Saumon, D., Golimowski, D.A., Leggett, S.K., Marley, M.S. & Noll, K.S. 2009, ApJ, 695, 844
- Goorvitch (1994) Goorvitch, D. 1994, ApJS, 95, 535
- Grevesse & Noels (1993) Grevesse, N., & Noels, A. 1993, in Origin and Evolution of the Elements, ed. N. Prantos, E. Vangioni-Flam, & M. Casse (Cambridge: Cambridge Univ. Press), 14
- Gustafsson & Frommhold (2003) Gustafsson, M. & Frommhold, L. 2003, A&A, 400, 1161
- Hare & Welsh (1958) Hare, W.F.J., & Welsh, H.L. 1958, Can. J. Phys., 36, 88
- Hargreaves, Li & Bernath (2011) Hargreaves, R.J., Li, G., & bernath, P.F. 2011, ApJ, 735, 111
- Huang, Schwenke & Lee (2011) Huang, X., Schwenke, D.W., & Lee, T.J. 2011, J. Chem. Phys., 134, 044320
- Huang, Schwenke & Lee (2011) Huang, X., Schwenke, D.W., & Lee, T.J. 2011, J. Chem. Phys., 134, 044321
- Hubeny & Burrows (2007) Hubeny, I. & Burrows, A. 2007, ApJ, 669, 1248
- Jacquinet-Husson et al. (1999) Jacquinet-Husson, N., et al. 1999, J. Quant. Spec. Radiat. Transf., 62, 205
- Jacquinet-Husson et al. (2005) Jacquinet-Husson, N., et al. 2005, J. Quant. Spec. Radiat. Transf., 95, 429
- Jorgensen et al. (2000) Jorgensen, U.G., Hammer, D., Borysow, A. & Falkesgaard, J. 2000, A&A, 361, 283
- Kirkpatrick (2005) Kirkpatrick, J.D. 2005, ARA&A, 43, 195
- Kirkpatrick (2008) Kirkpatrick, J.D. 2008, in “14th Cambridge Workshop on Cool Stars, Stellar Systems, and the Sun” G.T. van Belle, Ed., ASP Conference Series, Vol. 384, 85
- Kirkpatrick et al. (1999) Kirkpatrick, J.D., Reid, I.N., Liebert, J., Cutri, R.M., Nelson, B, Beichman, C.A., Dahn, C.C., Monet, D.G., Gizis, J.E. & Skrutskie, M.F. 1999, ApJ, 519, 802
- Kirkpatrick et al. (2011) Kirkpatrick, J.D. et al. 2011, ApJS, 197, 19
- Knapp et al. (2004) Knapp, G. R., Leggett, S.K, Fan, X., Marley, M.S., and 25 other authors 2004, AJ, 127, 3553
- Leggett et al. (2002) Leggett, et al. 2002, ApJ, 564, 452
- Leggett et al. (2007a) Leggett, S.K., Marley, M.S., Freedman, R.S., Saumon, D., Liu, M.C., Geballe, T.R., Golimowski, D.A., Stephens, D. 2007, ApJ, 667, 537
- Leggett et al. (2007b) Leggett, S.K., Saumon, D., Marley, M.S., Geballe, T.R., Golimowski, D.A., Stephens, D. & Fan, X., 2007, ApJ, 655, 1079
- Leggett et al. (2009) Leggett, S.K., Cushing, M.C., Saumon, D., Marley, M.S., Roellig, T.R., Warren, S.J., Burningham, B., Jones, H.R.A., Kirkpatrick, J.D., and 10 coauthors 2009, ApJ, 695, 1517
- Leggett et al. (2010a) Leggett, S.K., Burningham, B., Saumon, D., Marley, M.S., Warren, S.J., Smart, R.L., Jones, H.R.A., Lucas, P.W., Pinfield, D.J. & Motohide, T. 2010, ApJ, 710, 1627
- Leggett et al. (2010b) Leggett, S.K., Saumon, D., Burningham, B., Cushing, M.C., Marley, M.S. & Pinfield, D.J. 2010, ApJ, 720, 252
- Leggett et al. (2011) Leggett, S.K., et al. 2011, submitted to ApJ.
- Liu & Leggett (2005) Liu, M.C. & Leggett, S.K. 2005, ApJ, 634, L616
- Liu et al. (2011) Liu, M. C., Delorme, P., Dupuy, T.J., Bowler, B.P., Albert, L., Artigau, E., Reylé, C., Forveille, T. & Delfosse, X. 2011 ApJ, 740, 108
- Lodders (2002) Lodders, K. 2002, ApJ, 577, 974
- Lodders (2003) Lodders, K. 2003, ApJ, 591, 1220
- Lodders & Fegley (1998) Lodders, K. & Fegley, B. 1998, The Planetary Scientist’s Companion, (Oxford University Press: New York)
- Lodders & Fegley (2002) Lodders, K. & Fegley, B. 2002,Icarus, 155, 393
- Lucas et al. (2010) Lucas, P.W., Tinney, C.G., Burningham, B., Leggett, S.K., Pinfield, D.J., Smart, R., Jones, H.R.A., Marocco, F., Barber, R.J., Yurchenko, S.N., and 7 coauthors, 2010, MNRAS, 408, L56
- Luhman et al. (2011) Luhman, K.L., Burgasser, A.J., Labbé, I., Saumon, D., Marley, M.S., Bochanski, J.J., Monson, A.J. & Persson, S.E. 2011, ApJ, in press
- Mainzer et al. (2007) Mainzer, A.K., Roellig, T.L., Saumon, D., Marley, M.S., Cushing, M.C., Sloan, G.C., Kirkpatrick, J.D., Leggett, S.K. & Wilson, J.C. 2007, ApJ, 662, 1245
- Marley et al. (1996) Marley, M. S., Saumon, D., Guillot, T., Freedman, R. S., Hubbard, W. B., Burrows, A. & Lunine, J. I. 1996, Science, 272, 1919
- Marley et al. (2002) Marley, M. S., Seager, S., Saumon, D., Lodders, K., Ackerman, A. S., Freedman, R. S., & Fan X. 2002, ApJ, 568, 335
- Marley et al. (2012) Marley, M. S., Saumon, D., Cushing, M.C., & Fortney, J.J. 2012, submitted to ApJ
- Marocco et al. (2010) Marocco, F., Smart, R.L., Jones, H.R.A., burningham, B., Lattanzi, M.G., Leggett, S.K., Lucas, P.W., Tinney, C.G., Adamson, A., Evans, D.W., and 4 coauthors, 2010, A&A, 524, 38
- McCaughrean et al. (2004) McCaughrean, M.J., Close, L.M., Scholz, R.-D., Lenzen, R., Biller, B., Brandner, W., Hartung, M. & Lodieu, N. 2004, A&A, 413, 1029
- Noll et al. (2000) Noll, K.S., Geballe, T.R., Leggett, S.K & Marley, M.S. 2000, ApJ, 541, L75
- Partridge & Schwenke (1997) Partridge, H. & Schwenke, D.W. 1997, J. Quant. Spec. Radiat. Transf., 53, 373
- Perryman et al. (1997) Perryman, M. A. C., et al. 1997, A&A, 323, L49
- Plez (1998) Plez, B. 1998, A&A, 337, 495
- Richard et al. (2012) Richard, C., Gordon, I.E., Rothman, L.S., Abel, M., Frommhold, L., Gustafsson, M., Hartmann, J.-M., Hermans, C., Lafferty, W.J., Orton, G.S., Smith, K.M., & Tran, H. 2012, J. Quant. Spec. Radiat. Transf., in press
- Roellig et al. (2004) Roellig, T.L., Van Cleve, J.E., Solan, G.C., Wilson, J.C.,m Saumon, D., Leggett, S.K., Marley, M.S., Cushing, M.C., Kirkpatrick, J.D., Mainzer, A.K. & Houck, J.R. 2004, ApJS, 154, 418
- Rothman et al. (2003) Rothman, L.S., Barbe, A., Benner, C.D., Brown, L.R., Camy-Peyret, C., Carleer, M.R., Chance, K., Clerbaux, C., Dana, V., Devi, V.M. and 20 coauthors, 2003, J. Quant. Spec. Radiat. Transf., 82, 5
- Rothman et al. (2005) Rothman, L.S., Jacquemart, D., Barbe, A., Benner, C.D., Birk, M., Brown, L.R., Carleer, M.R., Chakerian, C., Chance, K., Coudert, L.H. and 20 coauthors, 2005, J. Quant. Spec. Radiat. Transf., 96, 139
- Rothman et al. (2009) Rothman, L.S., Gordon, I.E., Barbe, A., Benner, C.D., Bernath, P.E., Birk, M., Boudon, V., Brown, L.R., Campargue, A., Champion, J.P. and 6 coauthors 2009, J. Quant. Spec. Radiat. Transf., 110, 533
- Saumon et al. (2000) Saumon, D., Geballe, T.R., Leggett, S.K., Marley, M.S., Freedman, R.S., Lodders, K., Fegley, B. Jr. & Sengupta, S.K. 2000 ApJ, 541, 374
- Saumon et al. (2006) Saumon, D., Marley, M.S., Cushing, M.C., Leggett, S.K., Roellig, T.L., Lodders, K. & Freedman, R.S. 2006, ApJ, 647, 552
- Saumon et al. (2007) Saumon, D., Marley, M.S., Leggett, S.K., Geballe, T.R., Stephens, D., Golimowski, D.A., Cushing, M.C., Fan, X., Rayner, J.T., Lodders, K. & Freedman, R. S. 2007, ApJ, 656, 1136
- Saumon & Marley (2008) Saumon, D., Marley, M.S. 2008, ApJ, 689, 1327
- Schwenke (1998) Schwenke, D. 1998, Faraday Discuss., 109, 321
- Schwenke (2002) Schwenke, D. 2002, Spectrochimica Acta A, 58, 849
- Sharp & Burrows (2007) Sharp, C.M. & Burrows, A. 2007, ApJS, 168, 140
- Stephens et al. (2009) Stephens, D.C., Leggett, S.K., Cushing, M.C., Marley, M.S., Saumon, D., Geballe, T.R., Golimowski, D.A. X. Fan & Noll, K.S. 2009, ApJ, 702, 154
- Tinney et al. (2003) Tinney, C. G., Burgasser, A. J. & Kirkpatrick, J. D. 2003, AJ, 126, 975
- Vrba et al. (2004) Vrba, F. J., Henden, A. A., Luginbuhl, C. B., Guetter, H. H., Munn, J. A., Canzian, B., Burgasser, A. J., Kirkpatrick, J. D., Fan, X., Geballe, T. R., and 5 coauthors 2004, AJ, 127, 2948
- Warren et al. (2007) Warren, S.J., Mortlock, D.J., Leggett, S.K., Pinfield, D.J., Homeier, D., Dye, S., Jameson, R.F., Lodieu, N., Lucas, P.W., Adamson, A.J. and 14 coauthors 2007, MNRAS, 381, 1400
- Yurchenko et al. (2005) Yurchenko, S. N., Zheng, J., Lin, H., Jensen, P. & Thiel, W. 2005, J. Chem. Phys., 123, 134308
- Yurchenko, Barber & Tennyson (2011) Yurchenko, S. N., Barber, R. J., & Tennyson, J. 2011, MNRAS, 413, 1828
- Yurchenko, Barber & Tennyson (2011) Yurchenko, S. N., Barber, R. J., Tennyson, J., Thiel, W. & Jensen, P. 2011, J. Mol. Spec., 268, 123