An X-ray WHIM metal absorber from a Mpc-scale empty region of space
Abstract
We report a detection of an absorption line at in a Chandra HRC-S/LETG X-ray grating spectrum of the blazar H 2356-309. This line can be identified as intervening -K absorption, at , produced by a warm () intergalactic absorber. The feature is significant at a level (accounting for the number of independent redshift trials). We estimate an equivalent hydrogen column density of . Unlike other previously reported FUV/X-ray metal detections of warm-hot intergalactic medium (WHIM), this CV absorber lies in a region with locally low galaxy density, at from the closest galaxy at that redshift, and therefore is unlikely to be associated with an extended galactic halo. We instead tentatively identify this absorber with an intervening Warm-Hot Intergalactic Medium filament possibly permeating a large–scale, 30 Mpc extended, structure of galaxies whose redshift centroid, within a cylinder of 7.5 Mpc radius centered on the line of sight to H 2356-309, is marginally consistent (at a level) with the redshift of the absorber.
Subject headings:
intergalactic medium, large-scale structure of Universe, Techniques: spectroscopic, quasars: absorption lines, BL Lacertae objects: individual (H 2356-309), X-rays: galaxies: clusters1. Introduction
Cosmological simulations predict that during the process of structure formation, the high redshift diffuse cold photoionized intergalactic baryonic phase responsible for the forest, undergoes a substantial transformation. Baryons in these filaments are predicted to fuel structure formation by accreting toward the large–scale dark matter Cosmic Web, populated by galaxies and, by doing so, to undergo shocks that heat them up to temperatures of K(Cen & Ostriker, 1999; Davé et al., 2001). This new collisionally ionized baryonic phase is dubbed Warm-Hot Intergalactic Medium (WHIM), and is supposed to exist in filamentary structures at very low densities ( times the mean baryonic density of the universe) and to account for the majority of the baryons in the local universe () that are currently still undetected (Fukugita & Peebles, 2004).
The range of density and temperature of the WHIM are theoretically well established within the context of a -CDM Universe. On the contrary, the effects of AGN and galaxy wind feedback, as well as that of galaxy mergers, on WHIM filaments, both in the immediate surrounding of structures and at larger scales, are not yet well understood and therefore their physics difficult to implement in simulations. This feedback may significantly affect the metal content of the WHIM (e.g. Cen & Ostriker, 2006) and therefore its detectability. At WHIM temperatures and densities, the gas is so highly ionized and tenuous that can only weakly emit in the soft X-rays through Breemstrahlung and weakly interact with radiation in the Far-Ultraviolet (FUV) and soft X-ray bands through electronic transitions of relatively light metals in their highest ionization states, therefore emitting or absorbing photons at these wavelenghts. Uncertainties on the IGM-galaxy feedback processes reflect negatively into the accuracy of hydrodynamic simulations predictions and so, in turn, on feasibility studies of WHIM observations and the prospects for accurate studies of this important baryon phase and its interplay with galaxies at large-scales.
Despite the few claims of broad-band X-ray imaging detection (Zappacosta et al., 2002, 2005; Werner et al., 2008), the best way to currently detect and study the WHIM still relies on the identification of absorption lines (mainly OVI, OVII, CV, HI-Ly) from intervening medium in the FUV/X-ray spectrum of bright background extragalactic sources.
Cross-correlation studies of WHIM metal and HI systems over the entire WHIM temperature/density distribution intervals, and their surrounding galaxy environments, are critical to progress in this field. These, however, are hampered mostly by the small number of WHIM metal detections, particularly in the regime of temperatures T K (where the majority of these baryons should be found), accessible only in the X-ray band where so far only few mostly controversial results have been obtained even when targetting sightlines crossing known galaxy-traced superstructures (Nicastro et al., 2005; Fang et al., 2010; Zappacosta et al., 2010). At lower temperatures (T K), the WHIM can be also identified in the FUV band, through the detection of, possibly paired, OVI doublet and thermally broadened HI absorbers (BLAs) (see Richter et al., 2008, for a review). These are found to constitute % of the predicted baryon mass, in the local Universe (e.g. Shull et al., 2011), and are supposed to be tracers of collisionally ionized IGM (the WHIM), at T K. Cross-correlation studies of this cool tail of the WHIM-mass distribution with the surrounding galaxy environment, tentatively suggest that while OVI absorbers (or OVI and BLA pairs) lie relatively close () to bright galaxies (Stocke et al., 2006), BLA-only absorbers are found at larger distances from their nearest galaxy neighbor (; Danforth et al., 2010, hereafter DSS10). This tentative evidence (based on a small number of systems) would suggest that ’warm’ metals (T) are limited to the surrounding of large galaxy halos which probably contributed to their enrichment, while the more diffuse “metal-poor” gas (at least in the T temperature range) traces more distant regions.
Here, we present the first evidence for possible CV () IGM absorption in the X-rays, at z=0.112, found to lie in a relatively under-dense region of the local Universe, with the nearest galaxy at Mpc distance, but still within a larger-scale filamentary structure of galaxies. The paper is organized as follows: we briefly present the data and their reduction in § 2, then we describe the spectral analysis in § 3 and finally in § 4 we discuss and iterpret our findings.
Reported errors are unless otherwise specified.
2. Data reduction
H2356-309 has been observed twice with Chandra with the HRC-S/LETG grating configuration for a total of ks.
The first observation was performed in October 2008 (96.49 ks). The second observation (496.4 ks) consists in 10 pointings
with exposures ranging from 15 ks to 100 ks and was carried out during the last four months of
2009.
H 2356-309 was also observed with XMM-Newton for 130 ks. However, the XMM-Newton gratings (RGSs) do not
cover the spectral band, which we focus on in this paper. We therefore do not use the XMM-Newton
data of H 2356-306 in this paper.
The Chandra data have been previously analyzed and presented by Fang et al. (2010) and
Zappacosta et al. (2010). In this paper we make use of the data reduced by Zappacosta et al. (2010) (see their §3.1, for details on the
data reduction).
In order to maximize the signal-to-noise ratio (S/N) of the single Chandra observations, for each observation we co-add the
HRC-LETG positive and negative order source and background spectra. Given the non-linearity of the HRC-LETG effective dispersion
relation
111See http://cxc.harvard.edu/cal/Letg/Hrc_disp/degap.html,
http://asc.harvard.edu/proposer/POG/html/chap9.html#tth_sEc9.3.2
, this procedure may introduce additional uncertainties () in the wavelength calibration scale
(currently calibrated to ).
Since the corrections leading to these calibrations are obtained at
the rest-frame position of strong X-ray metal electronic transitions
and the interpolation to red-shifted transitions may not be strictly
valid, we assumed throughout the spectral range a conservative
increased uncertainty of . This uncertainty
will in turn increase to when we
will co-add the spectra of all the observations to maximize the
S/N. In this case the final uncertainty is obtained by propagating
the single spectra uncertainties but weighting each term by the
relative contribution in counts of each observation in the 0.5-2 keV
band. In the following we will always quote the statistical errors
only, unless differently specified.
3. Spectral analysis
For the spectral analysis we use the fitting package Sherpa (Freeman et al., 2001), in CIAO 4.2. We perform all our fits using the data weighted with the Gehrels variance function and adopting a Nelder-Mead simplex optimization method.
The analysis is mainly focussed on the spectral region, not considered in Fang et al. (2010) and Zappacosta et al. (2010). In our spectral analysis and fitting procedure, we use two different approaches to the data: (a) in order to maximize the S/N per resolution element, we first co-add all the 11 HRC-LETG spectra together (see Zappacosta et al., 2010, for details), and analyze the total 496.4 ks spectrum; (b) then, to check the reliability of our findings against possible systematics introduced by co-adding the single spectra, we also repeat the fitting procedures simultaneously to 6 HRC-LETG spectra, extracted from the 11 observations in such a way that the resulting 6 spectra have all homogeneous S/N per resolution element: the exposures of these 6 spectra vary between 90-110 ks each.
All spectra are binned to half the HRC-S/LETG FWHM (0.025 ).
3.1. Single line analysis
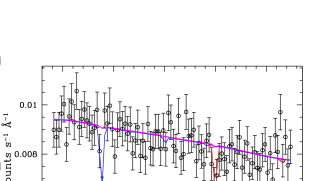
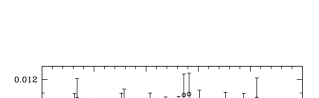
Figure 1 shows two portions of the total HRC-LETG spectrum of H 2356-309, where the redshifted CV K (top panel) and OVII K (bottom panel) lines are expected ( , top panel, and , bottom panel), together with the local best fitting continuum models (magenta curves in both panels222the Å best fitting continuum includes also 2 negative Gaussians to model atomic OI absorption both at and at the redshift of H 2356-309.), and the intervening absorber models (red and blue curves, §3.2), folded through the HRC-LETG response. In these two spectral intervals, the total spectrum has net source counts per resolution element (CPREs; ) and so is sensitive to the detection of absorption line equivalent widths at .
A visual inspection of the Å portion of the spectrum (Fig. 1, top panel) reveals the presence of two negative (compared to the best fitting continuum) line-like features at 44.75 and 47 . We modeled these features by adding two negative Gaussians to our best fitting local continuum model. The two resulting best-fitting absorption lines have line centroids Å and Å, EW and EW , and single line statistical significances (i.e. estimated by dividing the best fitting Gaussian normalizations by their errors) of and , respectively.
To check the actual statistical significance of these features against possible systematics introduced by co-adding the 11 observations, we performed the same analysis simultaneously on the Å portion of the 6 homegenuous S/N spectra extracted from the 11 observations333ObsIDs 8120, 10764, 10497+10499, 10498+10500, 10577+10840, 10761+10762+10841. For each of the 6 spectra, our local continuum model includes a power-law with spectral index and normalizations free to vary independently. We then include 2 negative Gaussians for each of the 6 spectra, with common line centroids, common EWs and line widths frozen to a common unresolved HRC-LETG value, and fit the 6 data-sets simultaneously. The best fit model gives lines positions and equivalent widths consistent with the ones derived from the fit to the co-added spectrum, although with larger uncertainties due to the larger number of free parameters in the joint fit.
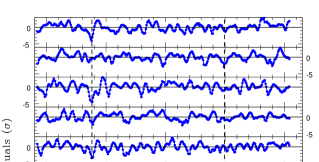
Figure 2 shows the smoothed residuals of the Å portion of the 6 spectra (top panel) and the co-added spectrum (bottom panel), to their respective best-fitting continuum models (obtained by folding the residual histograms through the HRC-LETG line spread function), re-normalized after smoothing to comply with Poisson statistics. The Å line is visible in 4 out of the 6 best-fitting continuum residuals, and appears prominent in the best-fitting continuum residuals to the co-added spectrum. The second absorption feature is only visible in the best-fitting continuum residuals to the co-added spectrum.
In the following analysis, we focus exclusively on the co-added spectrum of H 2356-309, and tentatively identify the two absorption features at Å and Å, as redshifted CV K lines at and (only marginally consistent at a level with the systemic redshift of H 2356-309: ; Jones et al. 2009).
3.2. Global analysis and characterization of the absorber
To test the validity of our tentative CV identifications at and , we used our hybrid-ionization WHIM spectral model (adapted from PHASE, Krongold et al., 2003), to check for compatibility between the data and the presence or absence of associated absorption from other ions of the same or different metals. The model includes more than 3000 electronic transitions from H to Ca, and predicts the opacity of each transition for given H equivalent column densities (), and temperatures (T), for collisionally ionized plasma undergoing the additional photoionizing contribution by UV and X-ray metagalactic photons at a given redshift and baryon density ().
We proceeded as follow: we first modeled local continua separately in 4 different key spectral bands of the co-added HRC-LETG spectrum of H 2356-309: , , , . We chose these 4 spectral bands because these are the regions where transitions from other abundant ions associated with CV in plasma in collisional ionization, photoionization, or hybrid-ionization equilibrium are expected to produce significant opacity. To model the local continua we used simple power-laws and, in the 23-28 Å spectral range, we also included two negative Gaussians to model the atomic OI transitions at and at blazar redshift (Figure 1, bottom panel, magenta curves). Then we added two hybrid-ionization components, at the redshift of our tentative CV identifications. The model paramaters are: temperature, equivalent H column density and volume baryon density of the gas, the redshift of the absorber, and its internal turbulence velocity. The baryon volume density is used to define the relative contribution of photoionization: lower the volume density, higher the photo-ionization contribution from the surrounding meta-galactic photons. This contribution is highly degenerate with the temperature of the plasma, and cannot be constrained independently in such quality data. We therefore fixed this parameter to a typical WHIM value of (overdensity of , compared to the average Universe density), for both absorbers. We also froze the turbulent velocity to (that of an unresolved line in HRC-LETG data). Of the remaining three parameters, the temperature and equivalent H column density of the absorbers, were left free to vary in the fit, but linked to a common value in all the 4 spectral regions. Finally, the redshifts of the two absorbers were set to the best fit values determined in previous section and left free to vary within and linked to a common narrow spectral interval in each of the four bands. The best-fitting absorber models, confirm our tentative identifications of the two lines as CV K absorbers. Fig. 1 shows the best-fitting absorption models (blue and red curves) in the only two bands where relatively strong opacities from CV K (top panel) and OIV-VII K (bottom panel) lines are predicted. For both best-fitting absorber models the, by far, strongest opacity contribution is given by CV K. The additional opacity produced by OIV-VI K lines is fully consistent with the data (bottom panel, blue and red curves). The best-fitting parameters of the possible intervening absorbers are: , K, and , K, (90% upper limits). For the intervening absorber the small upper and lower error-bars in temperature are set by the lack of strong OVII K and OIV K absorption in the data, respectively.
We also checked whether the detected absorption feature at 44.76 Å, could be due to a different transition from a cooler ion of C, at redshift lower than . Possible candidates are inner-shell K transitions from lithium-like C (CIV) all the way down to neutral C (CI). However, unlike CV which is Helium-like and so highly stable and practically the only ion of C over a wide range of temperatures (from log K), lower ionization ions are much less stable, and contribute together to the total C fraction, in a mixture that depends upon the exact gas temperature. Typically, at temperatures of log K, CIII and CIV contribute most, while at lower temperature CI and CII are the dominant ions. In other words, while He-like metals can be found isolated in absorption or emission spectra, for a wide interval of temperatures, lower ionization ions produce equally strong opacities in groups of 2-3 ions. We checked the data for their compatibility with the presence of any of these low-ionization transitions, and found no possible solution. If the detected absorber at Å, was due, e.g. to the CIV K transition at Å (which would place the absorber at ), in order to reproduce the spectral features at Å, the absorber should have either a temperature K and or higher temperatures but extremely high column densities . In both cases the models predicts similar, or even higher, opacities at other transitions (i.e. CIII at and OIV, OVI in the range ) whose presence is not consistent with the data. Similar considerations hold for the possible identification of the Å feature with the main transitions from lower ionization ions. We therefore exclude the identification of the Å feature with intervening cool medium at , and conclude that a CV K absorber at is the most likely identification for the observed feature.
Our best-fitting model for the absorber, predicts an OVI column of . OVI has its strongest outer-shell doublet transitions in the FUV, at . We checked for the presence of these lines in the low S/N () archival FUSE observation of H 2356-309. Unfortunately, however, in the relevant spectral region ( Å) these data are only sensitive to column densities of (for line Doppler parameters in the range km s-1) at a level, so fully consistent with the presence of the predicted line, but not of sufficient quality to uncontroversially set the issue.
4. Discussion
4.1. On the significance of the intervening CV line
In Section 3.1 we estimated the significance of the intervening CV K line, as a single-line significance of . However, in doing so we did not account for the number of redshift trials, i.e. for the lack of a prior on the expected redshift of the line (see e.g. Kaastra et al., 2006). A blind search for intervening CV K line, exploits the entire redshift range available, from to the redshift of the background blazar. The number of resolution elements of the spectrometers between the rest frame position of the CV K line (), and the position of the line at the redshift of the blazar, represents the number of independent redshift trials N. In our case: / 0.05 = 133. The probability of chance detection of an intervening CV K line seen at a single-line significance of , is given by the binomial distribution formula
where , and is the one-sided Gaussian probability corresponding to . This gives a chance detection probability of (0.2%), corresponding to an effective line significance of , after accounting for the number of redshift trials.
4.2. Possible galactic/super-galactic identification of the absorber
The low temperature estimated for the intervening CV absorber at , suggests it to be the X-ray counterpart of the OVI inter-galactic absorbers commonly found in the FUV spectra of extragalactic sources, at (Danforth & Shull, 2005; Tripp et al., 2008). However, unlike OVI, which can be efficently produced in both photo-ionized and collisionally ionized gas, CV is an He-like ion, and as such much more stable and abundant in collisionally ionized gas (or WHIM) than in gas purely photo-ionized by the meta-galactic radiation field.
Indeed, only a relatively small fraction of the OVI absorbers are found to originate in shock-heated (e.g. collisionally ionized) gas at low-temperature end of the WHIM mass distribution and therefore associated to BLAs, while the rest is possibly imprinted by the residual local photo-ionized Ly forest (e.g. Danforth & Shull, 2005; Tripp et al., 2008). The CV absorber that we find here, belongs probably to the class of OVI-BLA associations, which are still limited in number.
In a recent work on BLA detections along the line of sight to 7 AGNs, DSS10 report a marginal evidence for BLA-OVI detections in well-surveyed galaxy fields (4 in their sample) to be closer to galaxies ( from their closest galaxy) than isolated BLAs with OVI non-detections (4 in their sample; Mpc Mpc from the closest galaxy). This limited number statistic evidence, suggests that metals in the local Universe (at least at such moderately low temperatures) are not uniformly spread in the IGM, but they concentrate around structures, possibly in extended halos of galaxies.
However, these searches are limited to nearest-galaxy versus absorber correlations and do not investigate on the spatial distributions of galaxies around a given absorbers. WHIM filaments embedding a large number of galaxies could be enriched differently, and at different levels, from extended galaxy halos in relatively sub-dense galaxy regions.
Much sparser are the evidences regarding metals at higher temperatures that can be traced in the X-rays. Nicastro et al. (2005) and Fang et al. (2010) have obtained so far the most convincing, although still debated (e.g. Kaastra et al., 2006; Yao et al., 2012, respectively) detections from this hotter phase. They have found absorptions from warm-hot material at and , both coincident with extended filaments of galaxies (Williams et al., 2010; Buote et al., 2009), in regions not completely devoid of galaxies at scales 444Indeed for the z=0.027 system there are two galaxies (of 0.4 and 0.8 ) at distances of (Williams et al., 2010) and for the absorber, the NASA/IPAC Extragalactic Database reports four galaxies at kpc the farthest being and two Abell clusters within .
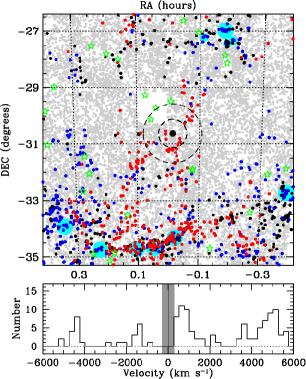
Fig. 3 shows the galaxy distribution (dots) around H 2356-309 from the 2dF Galaxy Redshift Survey (2dFGRS; Colless et al., 2003). The 2dFGRS is redshift complete at for which corresponds to at . As can be seen the sightline to the blazar passes through a Mpc long filament of galaxies connecting clusters and groups of galaxies in the same redshift range. The position of the X-ray absorber (: statistical and absolute wavelength scale uncertainties, added in quadrature) is marginally consistent (at a level, once both the absorber redshift uncertainty and the width of the galaxy distribution - FWHM = 600 km s-1 - are properly taken into account) with the centroid of the galaxy redshift distribution (, i.e. from ; see Fig. 3, bottom panel). By conservatively assuming that all galaxies are at the same redshift of the absorber, we find that the closest galaxy is distant (the actual 3-D distance could be even larger). This is comparable to the virial radius of a massive X-ray emitting cluster, (e.g. Pointecouteau et al. 2005). Moreover within a distance of Mpc there are only 9 galaxies with luminosities in the range . Hence the absorber lies in a relatively under-dense galaxy environment.
We checked for the presence of possible galaxies closer to the sightline but with unkwnown redshift. At the redshift of the absorber they would have luminosities and be distant . The closest galaxies of luminosities comparable to are located at larger distances. In particular within there are three objects of , and at distances respectively of , , . It is also possible that there could be a galaxy exactly aligned to the sightline (therefore not immediately visible) producing the absorption. Falomo et al. (2000) studied the morphological properties of the host galaxies of a sample of blazars with HST-WFPC2 including H 2356-309. They found a compact faint () object at from the blazar position. At the redshift of the absorption this companion would be distant and have a physical size of a fraction of kpc. We checked for its possible counterpart at other wavelenghts. The HRC-S/LETG order 0 image does not show signs of it. Moreover Giroletti et al. (2004) analyzing VLA and VLBA maps do not find any radio counterpart at these scales. Although there are no optical spectroscopic studies for this specific compact object, Falomo et al. (2000) find several of these “companions” in sub-arcsec studies of BL Lac objects statistically hinting at a possible physical connection to the blazars themselves. In this context this compact companion can more likely be the responsible of the CV line at the blazar rest-frame than of the intervening one. We therefore conclude that the CV absorption that we report here, is probably produced by a genuine WHIM filament , locally free from galaxies, in a substantially metal-enriched intergalactic environment, and not by a nearby galaxy extended halo.
5. Summary and conclusions
We reported on a strong intervening CV K absorber at , serendipitously detected in the Chandra HRC-S/LETG spectrum of the blazar H2356-309. The CV K absorption line is detected at a confidence level (accounting for the number of independent redshift trials).
We tentatively identify this absorber with an intervening WHIM absorber embedding a large-scale filament of galaxies extending for Mpc, and connecting clusters and groups of galaxies at its extremes, and we rule out its possible association with the extended halo of a bright single galaxies at a distance lower than 2 Mpc from the absorber.
Future FUV studies with HST-COS coupled with further deeper and redshift-complete optical spectroscopic observations of the local galaxy field will certainly help in shedding further light on the origin of the absorber, its metallicity and physical properties.
References
- Buote et al. (2009) Buote, D. A., Zappacosta, L., Fang, T., Humphrey, P. J., Gastaldello, F., & Tagliaferri, G. 2009, ApJ, 695, 1351
- Cen & Ostriker (1999) Cen, R. & Ostriker, J. P. 1999, ApJ, 514, 1
- Cen & Ostriker (2006) —. 2006, ApJ, 650, 560
- Colless et al. (2003) Colless, M., Peterson, B. A., Jackson, C., Peacock, J. A., et al. 2003, ArXiv Astrophysics e-prints
- Danforth & Shull (2005) Danforth, C. W. & Shull, J. M. 2005, ApJ, 624, 555
- Danforth et al. (2010) Danforth, C. W., Stocke, J. T., & Shull, J. M. 2010, ApJ, 710, 613
- Davé et al. (2001) Davé, R., Cen, R., Ostriker, J. P., Bryan, G. L., Hernquist, L., et al. 2001, ApJ, 552, 473
- Falomo et al. (2000) Falomo, R., Scarpa, R., et al. 2000, ApJ, 542, 731
- Fang et al. (2010) Fang, T., Buote, D. A., et al. 2010, ApJ, 714, 1715
- Freeman et al. (2001) Freeman, P., Doe, S., & Siemiginowska, A. 2001, in Society of Photo-Optical Instrumentation Engineers (SPIE) Conference Series, Vol. 4477, Society of Photo-Optical Instrumentation Engineers (SPIE) Conference Series, ed. J.-L. Starck & F. D. Murtagh, 76–87
- Fukugita & Peebles (2004) Fukugita, M. & Peebles, P. J. E. 2004, ApJ, 616, 643
- Giroletti et al. (2004) Giroletti, M., Giovannini, G., Taylor, G. B., & Falomo, R. 2004, ApJ, 613, 752
- Jones et al. (2009) Jones, D. H., Read, M. A., Saunders, W., et al. 2009, MNRAS, 399, 683
- Kaastra et al. (2006) Kaastra, J. S. et al. 2006, ApJ, 652, 189
- Krongold et al. (2003) Krongold, Y., Nicastro, F., et al. 2003, ApJ, 597, 832
- Nicastro et al. (2005) Nicastro, F. et al. 2005, Nature, 433, 495
- Pointecouteau et al. (2005) Pointecouteau, E. et al. 2005, A&A, 435, 1
- Richter et al. (2008) Richter, P. et al. 2008, Space Sci. Rev., 134, 25
- Shull et al. (2011) Shull, J. M., Smith, B. D., & Danforth, C. W. 2011, ArXiv e-prints
- Stocke et al. (2006) Stocke, J. T., Penton, S. V., Danforth, C. W., Shull, J. M., Tumlinson, J., & McLin, K. M. 2006, ApJ, 641, 217
- Tripp et al. (2008) Tripp, T. M., Sembach, K. R., Bowen, D. V., Savage, B. D., Jenkins, E. B., Lehner, N., & Richter, P. 2008, ApJS, 177, 39
- Werner et al. (2008) Werner, N., Finoguenov, A., et al. 2008, A&A, 482, L29
- Williams et al. (2010) Williams, R. J., Mulchaey, J. S., Kollmeier, J. A., & Cox, T. J. 2010, ApJ, 724, L25
- Yao et al. (2012) Yao, Y., Shull, J. M., Wang, Q. D., & Cash, W. 2012, ApJ, 746, 166
- Zappacosta et al. (2010) Zappacosta, L., Nicastro, F., et al. 2010, ApJ, 717, 74
- Zappacosta et al. (2002) Zappacosta, L. et al. 2002, A&A, 394, 7
- Zappacosta et al. (2005) —. 2005, MNRAS, 357, 929