The starburst-AGN connection in the merger galaxy Mrk 938:
an infrared and X-ray view††thanks: Herschel is an ESA space observatory with science instruments provided by European-led Principal Investigator consortia and with important participation from NASA.
Abstract
Mrk 938 is a luminous infrared galaxy in the local Universe believed to be the remnant of a galaxy merger. It shows a Seyfert 2 nucleus and intense star formation according to optical spectroscopic observations. We have studied this galaxy using new Herschel far-IR imaging data in addition to archival X-ray, UV, optical, near-IR and mid-IR data. Mid- and far-IR data are crucial to characterise the starburst contribution, allowing us to shed new light on its nature and to study the coexistence of AGN and starburst activity in the local Universe. The decomposition of the mid-IR Spitzer spectrum shows that the AGN bolometric contribution to the mid-IR and total infrared luminosity is small (0.02), which agrees with previous estimations. We have characterised the physical nature of its strong infrared emission and constrained it to a relatively compact emitting region of kpc. It is in this obscured region where most of the current star formation activity is taking place as expected for LIRGs. We have used Herschel imaging data for the first time to constrain the cold dust emission with unprecedented accuracy. We have fitted the integrated far-IR spectral energy distribution and derived the properties of the dust, obtaining a dust mass of . The far-IR is dominated by emission at 35 K, consistent with dust heated by the on-going star formation activity.
keywords:
Galaxies: evolution — Galaxies: nuclei — Galaxies: Seyfert — Galaxies: structure — Infrared: galaxies — Galaxies: individual: Mrk938.1 Introduction
Observations over the past decade have revealed that supermassive black holes (SMBHs) likely reside at the centres of all galaxies with spheroids (see Kormendy & Richstone, 1995, for a review) and that the properties of these black holes and their host galaxies are tightly correlated (e.g. Marconi & Hunt, 2003; Ferrarese & Ford, 2005). In addition, the similarity in the anti-hierarchical evolution of both star formation rate and active galactic nuclei (AGN) activity at z2 (La Franca et al., 2005; Arnouts et al., 2007) reveals that the assembly and evolution of galaxies and the SMBHs at their centres are intimately connected. However, the nature of such an intrinsic connection is still enigmatic. Since it is believed that the main phase of SMBH growth through major mergers occurs in environments heavily obscured by dust (Hopkins et al., 2006), the infrared (IR) domain is the path to follow to unveil key signatures that remain lurking at other wavelengths.
The class of objects known as luminous infrared galaxies (LIRGs; , IR in the range 81000 µm) contributes a significant fraction (50%) of the cosmic infrared background. In addition, they are major contributors to the star-formation activity at z1 (Elbaz et al., 2002; Le Floc’h et al., 2005; Pérez-González et al., 2005). LIRGs are powered by star formation and/or AGN activity, and a large fraction of them, especially at the high IR luminosity end, are classified as interacting galaxies and mergers (Sanders & Mirabel, 1996). It has been suggested that the mechanisms that trigger mass accretion onto the SMBH through major merger processes are episodes of nuclear star formation (Hopkins et al., 2006). Therefore, it is clear that studying LIRGs can shed new light on our understanding of the coeval evolution of host galaxy and black hole.
Mrk 938 (also known as NGC 34, NGC 17, and IRAS F000851223, among others) is a local LIRG belonging to the IRAS Revised Bright Galaxy Sample (Sanders et al., 2003) – RA=00h11m06.65s, dec=–12d06m26.7s. It is located at a distance of 86.4 Mpc using the recession velocity relative to the Local Group =5961 km s-1 measured by Schweizer & Seitzer (2007) and assuming a CDM cosmology with (, ) = (0.3, 0.7) and = 70 . The measured IR luminosity of this galaxy is using the IRAS fluxes reported by Sanders et al. (2003) and the adopted distance. Although this source has been classified in the literature as both Seyfert 2 and starburst (SB) galaxy from optical spectroscopy (see Schweizer & Seitzer, 2007, for a detailed discussion on this issue), its X-ray emission confirms the presence of an obscured AGN (see Guainazzi et al., 2005, and also Section 3.1). We note that in the recent work of Yuan et al. (2010) the nuclear activity of Mrk 938 has been definitively classified as Seyfert 2 based on optical spectroscopy.
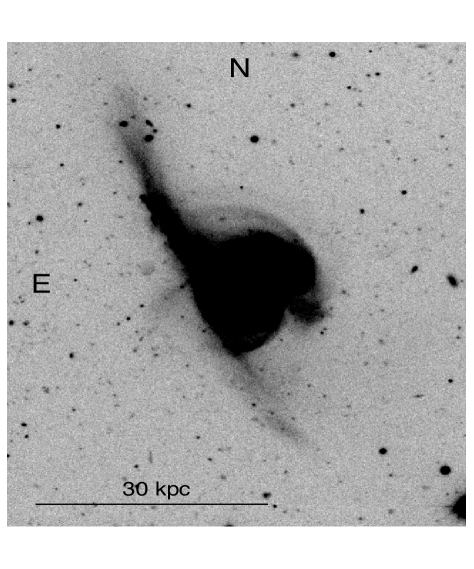
The optical morphology of Mrk 938 is dominated by a bright red nucleus, a blue exponential disk, and a rich system of young massive star clusters. The faint optical surface brightness emission reveals a pair of tidal tails to the northeast and southwest of the system, with the former being the brightest and longest one (see Fig. 1, courtesy of F. Schweizer). All these signatures led Schweizer & Seitzer (2007) to propose that Mrk 938 is the remnant of a gas-rich merger of two unequal mass galaxies. The nuclei of the two galaxies have probably coalesced, creating a concentrated and obscured starburst and an AGN, both driving a strong gaseous outflow. The starburst appears to be confined to a highly obscured central region of less than 1 kpc in radius (Schweizer & Seitzer, 2007). This is indeed confirmed by ground-based high-angular resolution observations in the mid-IR. These revealed that the mid-IR emission in this system originates in the central pc (Miles et al., 1996), but it actually dominates in a region of pc (see discussion in Section 4.1). Fernández et al. (2010) detected H i emission from both tidal tails and from nearby galaxies, suggesting that Mrk 938 is part of a gas-rich group of galaxies. They also found a hint of emission between Mrk 938 and NGC 35, the largest companion lying at a projected distance of 131 kpc, and suggested that they might have recently interacted. The radio-continuum emission detected in the nuclear region is extended, indicating that it is mostly due to the highly concentrated starburst.
Here we present for the first time a detailed analysis of novel far-IR (m) imaging observations of Mrk 938 obtained with the Herschel Infrared Observatory (Pilbratt et al., 2010). These have been combined with our own analysis of X-ray, UV, and IR data already presented in the literature. The main goal of this work is to understand the AGN/SB connection in Mrk 938, as well as the origin of the IR emission of this galaxy. This is the second paper in a series presenting Herschel imaging observations of a sample of nearby Seyfert galaxies to investigate the co-existence of AGN and starburst activity, as well as the nature of the dusty torus. A study of the dust properties of NGC 3081 has recently been presented in Ramos Almeida et al. (2011b).
This paper is structured as follows: Sect. 2 describes the data analysis procedure of the different IR and X-ray observations. In Sect. 3 we present evidence of AGN activity, including the decomposition of the mid-IR spectrum into AGN and SB contributions. The properties of the SB component have been derived in Sect. 4. We used the wealth of archival data to fit the SED of the galaxy and to derive the dust properties, presented in Sect. 5. Finally, our findings and conclusions are summarised in Sect. 6.
2 Observations and data analysis
2.1 Herschel
We performed far-IR imaging observations of Mrk 938 with the Photodetector Array Camera and Spectrometer (PACS, Poglitsch et al., 2010) and the Spectral and Photometric Imaging REceiver (SPIRE, Griffin et al., 2010) onboard the Herschel Space Observatory (Pilbratt et al., 2010), covering the spectral range µm in 6 bands. The data are part of the guaranteed time proposal “Herschel imaging photometry of nearby Seyfert galaxies: testing the coexistence of AGN and starburst activity and the nature of the dusty torus” (PI: M. Sánchez-Portal).
The PACS observations were carried out using the “mini-map” mode, consisting of two concatenated scan line maps, at 70∘ and 110∘ (in array coordinates), at a speed of 20″/sec, each one with 10 lines of 3′ length and cross-scan step of 4″. This mode produces a highly homogeneous exposure map within the central 1′ area. The set of maps were duplicated to observe through both the 70 µm (“blue”) and 100 µm (“green”) filters. Therefore the galaxy was observed twice through the 160 µm (“red”) filter. The PACS beams at 70, 100, and 160 µm are 5.6″, 6.8″, and 11.3″ FWHM, respectively. With the SPIRE photometer, the three available bands were observed simultaneously using the “small map” mode, with two 1 1 nearly orthogonal scan lines, at a scan speed of 30″/sec. The scan line length is 11.3′ and the area for scientific use is around 5′5′. The FWHM beam sizes at 250, 350, and 500 µm are 18.1″, 25.2″, and 36.9″ respectively.
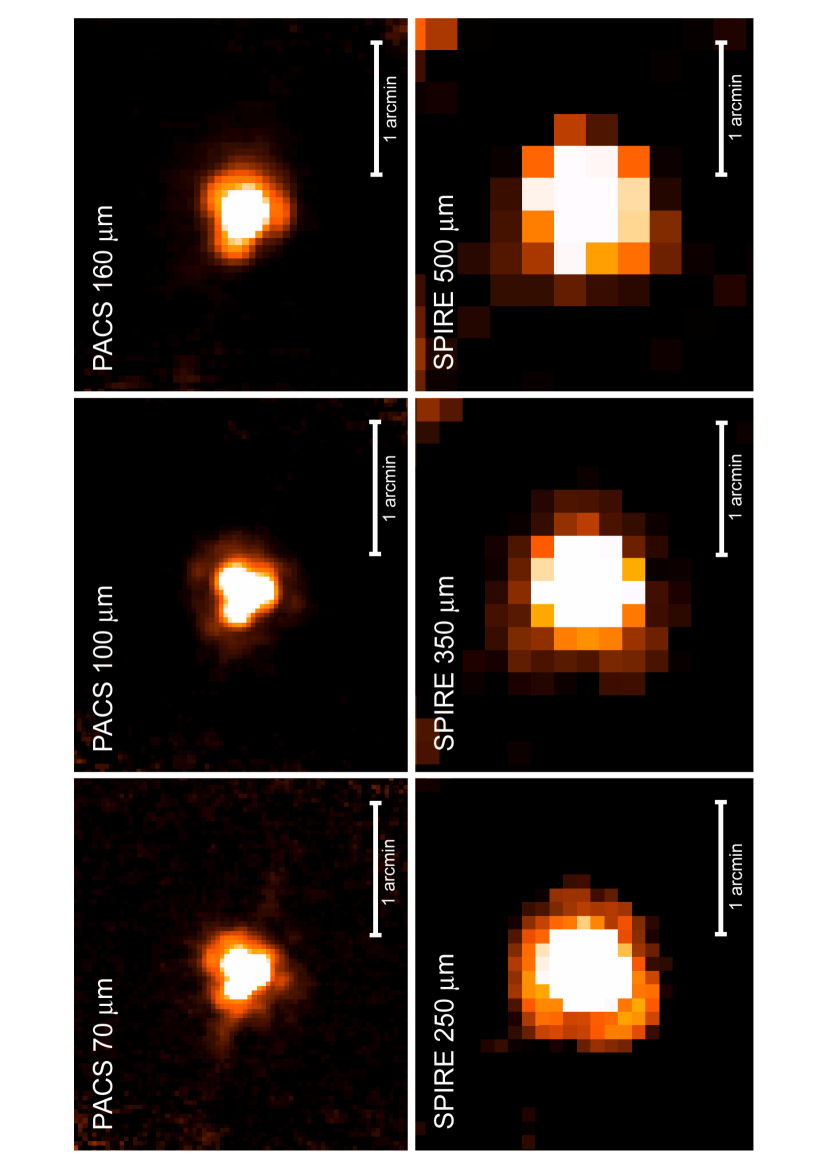
The data reduction was carried out with the Herschel Interactive Processing Environment (HIPE) v6.0.1951. For the PACS instrument, the extended source version of the standard PhotProject reduction script was deemed as adequate, due to the small angular size of the galaxy. This procedure implements a high-pass filtering algorithm to remove the 1/f noise of the bolometer signals. The sources are masked in order to prevent the high-pass filter to remove flux from extended structures. The FM v5 photometer response calibration files (Müller et al., 2011) were used. Level 2 maps produced by the reduction script for the two scan directions were merged using the mosaic task. For SPIRE, the standard small map script with the ‘naïve’ scan mapper task was applied, using the calibration database v6.1. Colour corrections (for PACS, see Poglitsch et al. 2010; for SPIRE, please refer to the Observer’s Manual) are small for blackbodies at the expected temperatures (e.g. Pérez García & Rodríguez Espinosa, 2001) and have been neglected. More details on the processing of Herschel data are given in Sánchez-Portal et al. (in preparation). The far-IR maps of Mrk 938 are shown in Fig. 2.
Aperture photometric data in the different bands were extracted using IRAF111Image Reduction and Analysis Facility (IRAF) software is distributed by the National Optical Astronomy Observatories, which is operated by the Association of Universities for Research in Astronomy, Inc., under cooperative agreement with the National Science Foundation. and the measurements for an aperture radius of 70 ″are shown in Table 1. The selected radius is a good compromise between including all IR emission and minimising the background contribution. Since the PACS encircled energy radius of FM v5 is normalised to an aperture of 60 ″, no aperture correction for the data was required. The morphology of Mrk 938, which will be further discussed in Sect. 4.1, is compatible with an unresolved object. Using our far-IR and photometry and the parametrisation of Dale & Helou (2002) we derived a total IR luminosity of , in agreement with that of Sanders et al. (2003).
| Name | (µm) | (Jy) | error (Jy) | Reference |
|---|---|---|---|---|
| 2MASS | 1.2 | 0.051 | 0.001 | Jarret et al. (2003) |
| 2MASS | 1.6 | 0.067 | 0.002 | “ |
| 2MASS | 2.2 | 0.062 | 0.002 | “ |
| Spitzer-IRAC | 3.6 | 0.043 | 0.002 | Gallimore et al. (2010) |
| Spitzer-IRAC | 4.5 | 0.036 | 0.001 | “ |
| Spitzer-IRAC | 5.8 | 0.092 | 0.004 | “ |
| Spitzer-IRAC | 8.0 | 0.59 | 0.01 | “ |
| IRAS | 12 | 0.35 | 0.032 | Sanders et al. (2003) |
| Spitzer-IRS | 15 | 0.435 | 0.012 | Deo et al. (2007) |
| Spitzer-MIPS | 24 | 1.84 | 0.18 | This work |
| IRAS | 25 | 2.39 | 0.055 | Sanders et al. (2003) |
| Spitzer-IRS | 30 | 4.36 | 0.05 | Deo et al. (2007) |
| IRAS | 60 | 17.05 | 0.045 | Sanders et al. (2003) |
| Herschel-PACS | 70 | 14.80 | 1.48 | This work |
| IRAS | 100 | 16.86 | 0.135 | Sanders et al. (2003) |
| Herschel-PACS | 100 | 15.00 | 1.50 | This work |
| ISO-ISOPHOT | 120 | 17.20 | 0.40 | Spinoglio et al. (2002) |
| ISO-ISOPHOT | 150 | 10.60 | 0.50 | “ |
| Herschel-PACS | 160 | 8.90 | 0.89 | This work |
| ISO-ISOPHOT | 170 | 8.50 | 0.20 | Spinoglio et al. (2002) |
| ISO-ISOPHOT | 180 | 5.40 | 0.10 | “ |
| ISO-ISOPHOT | 200 | 3.00 | 0.10 | “ |
| Herschel-SPIRE | 250 | 2.80 | 0.28 | This work |
| Herschel-SPIRE | 350 | 0.90 | 0.09 | This work |
| Herschel-SPIRE | 500 | 0.20 | 0.02 | This work |
| IRAM-30m | 1300 | 0.0097 | 0.0018 | Albrecht et al. (2007) |
2.2 Spitzer
2.2.1 Imaging Observations
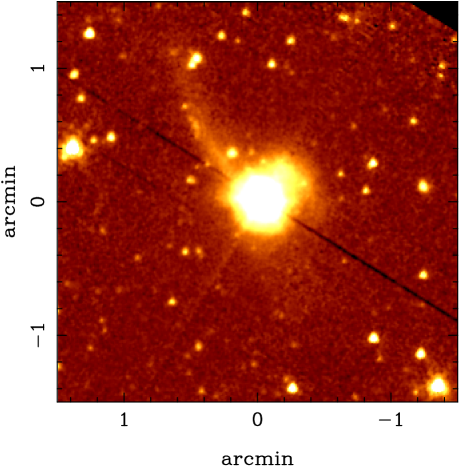
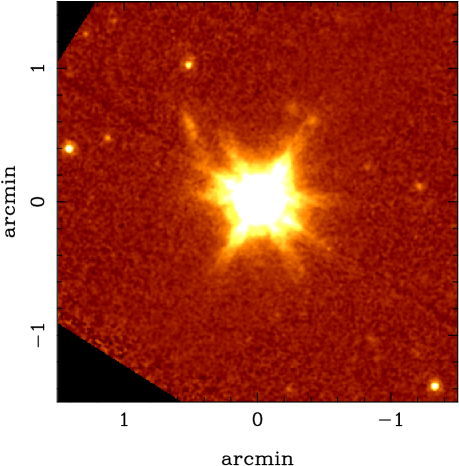
Mrk 938 was observed with the Spitzer instruments IRAC (Fazio et al., 2004) and MIPS (Rieke et al., 2004). We retrieved the basic calibrated data (BCD) from the Spitzer archive (IRAC – P3269, PI: J.F. Gallimore; MIPS – P3672, PI: J.M. Mazzarella). The BCD processing includes corrections for the instrumental response (e.g. pixel response linearisation), flagging of cosmic rays and saturated pixels, dark and flat fielding corrections, and flux calibration based on standard stars (see the IRAC and MIPS instrument handbooks for details). We combined the BCD images into mosaics using the MOsaicker and Point source EXtractor (MOPEX) software provided by the Spitzer Science Center (SSC) using the standard parameters. IRAC images of Mrk 938 at 3.6 and 8 µm are shown in Fig. 3. The IRAC 8 µm image was affected by the banding effect (see IRAC Handbook). Similar to Gallimore et al. (2010) we corrected this artefact by fitting a polynomial to the affected rows.
We computed integrated photometry of the source in the MIPS 24 µm image, and obtained from the literature photometric data points for the IRAC bands (Gallimore et al., 2010). The source photometry is presented in Table 1.
2.2.2 Spectroscopic Observations
We retrieved Spitzer/IRS (Houck et al., 2004) spectroscopic observations of Mrk 938 from the Spitzer archive (P3269, PI: J.F. Gallimore; P30291, PI: G. Fazio). The observations were taken in low-resolution (60–120) with the Short-Low (SL) and Long-Low (LL) modules and in high-resolution () mode with the Short-High (SH) and Long-High (LH) modules. The low resolution data were observed in mapping mode while the high resolution data were obtained in staring mode.
For the staring data we started with the BCD data. Bad pixels were corrected using the IDL package IRSCLEAN222The IRSCLEAN package is available at
http://irsa.ipac.caltech.edu/data/SPITZER/docs/dataanalysistools/tools/irsclean/. Then we subtracted the sky emission and extracted the spectra using the standard programs included in the Spitzer IRS Custom Extraction (SPICE) package provided by the SSC and the point source calibration. The resulting spectrum was already presented in Tommasin et al. (2010). For the SL+LL mapping observations we constructed the data cubes using CUBISM (Smith et al., 2007). We extracted the nuclear spectrum of Mrk 938 observed in SL+LL mapping mode using a 134134 aperture. Since the mapping mode data cubes are calibrated as extended sources we applied a wavelength dependent aperture correction to obtain a point-like spectrum to represent the nuclear emission of this galaxy. For more details on the data analysis please see Pereira-Santaella et al. (2010a, b); Alonso-Herrero et al. (2012).
We evaluated the strength of the 9.7 µm silicate feature, , by calculating the ratio of the observed flux density to the continuum flux density at 9.7 µm using the method in Pereira-Santaella et al. (2010b). Applying the definition of Spoon et al. (2007) we get , where the minus sign indicates absorption. This value is considerably higher, in absolute terms, than the average of the LIRG sample in Alonso-Herrero et al. (2012) of . We also measured the equivalent width (EW) of the 6.2 µm PAH feature, and obtained EW(PAH 6.2 µm)=0.4 µm. Spoon et al. (2007) provided a diagnostic diagram to give a general classification of IR galaxies based on and EW(PAH 6.2 µm). According to that, Mrk 938 is a moderately obscured composite nucleus.
2.3 XMM-Newton
Mrk 938 was observed by XMM-Newton on 2002, December 22 (rev 556, obsid 0150480501, PI: R. Maiolino) and then analysed with the XMM-Newton Science Analysis Software (SAS; Gabriel et al., 2004). All EPIC observations were taken in Full Frame mode and the medium filter in place. These data were already presented in Guainazzi et al. (2005), but we reduced them with the latest software to take full advantage of the most recent calibration files.
To extract the X-ray spectra, high background periods produced by intense soft proton fluxes were rejected by defining good time intervals within the complete observation window. After this process, the net exposure times were about 13, 16 and 16 ks for pn, MOS1 and MOS2 respectively. The light curves of the sources were inspected and no variability within the X-ray observations was observed. Source photons were extracted from a circular region of 30 arcsec radius centred on the object position. A circular source-free region on the same chip and radius of 60 arcsec was used to characterise the background. The target does not suffer from pile-up, so the pn spectrum was extracted with patterns 0 to 4, and MOS spectra from 0 to 12. Ancillary files and response matrices were generated by the arfgen and rmfgen SAS tasks respectively in order to convert the counts to physical units during the spectral analysis. All EPIC spectra were binned to oversample the instrumental resolution and to have no less than 20 counts in each background-subtracted spectral channel.
Spectral fitting was performed with XSPEC 12, where all applied models include Galactic foreground absorption (= cm-2) inferred from H i observations (Dickey & Lockman, 1990). Given that our source has been found to be highly obscured, we started fitting the data with a model consisting of a powerlaw plus an absorbed powerlaw, both with the same photon index. We got a reasonable fit at high energies, but a prominent soft excess with respect to the powerlaw appeared below 1 keV. Thus we added a thermal component, MEKAL in XSPEC. We obtained a temperature =0.67 keV typical of a starburst emission, and a high intrinsic absorption of =75 cm-2, consistent with high obscuration. A considerably flat powerlaw was obtained, =1.43. A summary of the parameters of this model, which is considered our best-fit (/dof=50/64), is presented in Table 2. Our derived X-ray luminosity is similar to that in Guainazzi et al. (2005). Fig. 4 shows the X-ray data (only EPIC-pn data is shown for simplicity) and model-to-data residuals. We also tried adding a reflection model (PEXRAV, Magdziarz & Zdziarski, 1995), for possible X-ray scattering from an optically thick surface, but did not get any statistical improvement in the fit.
| (keV) | (1022 cm-2) | ( erg s-1) | ( erg s-1) | |
|---|---|---|---|---|
| 0.67 | 75 | 1.43 | 5.4 | 1.4 |

2.4 Swift
The position of Mrk 938 has been observed with the Burst Alert Telescope (BAT Barthelmy et al., 2005), but the source is not detected even in the 70th month survey. We have used the standard BAT tool batcelldetect333http://heasarc.gsfc.nasa.gov/ftools/caldb/help/batcelldetect.html to analyse the observations and derive the rate (normalised by the number of working detectors) at the source position in the eight standard channels from corresponding background subtracted images. In the fourth channel, 35–50 keV, the rate becomes negative, therefore we have combined the first three channels to get a rate in the 1435 keV energy range. Using WebPIMMS444http://heasarc.nasa.gov/Tools/w3pimms.html for the count rate to flux conversion we get a flux upper limit of 2.5 erg s-1 cm-2 (equivalent to a luminosity of 2.2 erg s-1). If we extrapolate our best-fit model derived for the XMM-Newton data, we get =1.6 erg s-1 cm-2( =1.4 erg s-1), that is compatible with a BAT non-detection. We cannot further constrain the X-ray model because the extrapolated fluxes for all reasonable models lie below the BAT upper limit.
3 AGN Activity
In the local universe, a significant fraction of LIRGs hosts an AGN, and this fraction increases with the IR luminosity of the system (Veilleux et al., 1995). Using optical emission-line ratios and a new scheme to classify galaxies, Yuan et al. (2010) recently reported that approximately half of local LIRGs are classified as Seyfert, LINER or composite (SB/AGN). The AGN detection rate in LIRGs can be as high as when combining optical and IR indicators (i.e. emission line ratio diagnostics and spectral decomposition, Alonso-Herrero et al., 2012), and thus similar to that of local ultraluminous infrared galaxies (ULIRGs, Nardini et al., 2010). However, in clear contrast with ULIRGs, in local LIRGs the AGN bolometric contribution to the IR luminosity of these systems is very small, with an average of =0.05 (Alonso-Herrero et al., 2012). Therefore the high IR luminosities in most LIRGs are produced in intense dusty starbursts. Petric et al. (2011) estimated that AGN contribute 12% to the IR luminosity, which is compatible with the upper end found in Alonso-Herrero et al. (2012).
3.1 X-ray evidence
The analysis of the X-ray emission of Mrk 938 shows evidence of the presence of an obscured AGN. The active nucleus dominates the hard X-ray contribution as can be seen from the highly absorbed powerlaw component used to fit the spectrum. The measured absorption-corrected hard X-ray luminosity of erg s-1 is too high to be originated in a pure starburst (see Sect 4.3). The high intrinsic absorbing column returned by the spectral fitting supports the conclusion of the highly obscured nucleus.
A powerful diagnostic to estimate the nuclear obscuration is the 210 keV to [O iii] flux ratio, (e.g. Maiolino et al., 1998; Bassani et al., 1999; Guainazzi et al., 2005). According to previous studies the threshold lies in T=0.1, where objects with 0.1 are Compton-thick while those with 1 are unobscured or Compton-thin. Using =1.1 erg s-1 cm-2 as presented in Polletta et al. (1996) we obtain T=0.01 for our source, therefore Mrk 938 would appear as Compton-thick. However, this galaxy has a very strong starburst contribution in the optical (Gonçalves et al., 1999), therefore the AGN is not responsible for a considerable fraction of the [O iii] flux and the ratio as a measure of obscuration is uncertain. Another indicator of the nuclear obscuration is the emission fluorescence Fe Kα line. Objects are considered as Compton thick when EW(Fe Kα)1000 eV (Matt et al., 1996). In the case of Mrk 938, due to low statistics at the hardest energies we can only constrain the presence of the Fe Kα line by extracting an upper limit. Using Cash statistics, Guainazzi et al. (2005) fitted the unbinned spectrum in the 5.25–7.25 keV range. They found an equivalent width upper limit of 322 eV when fitting a Gaussian with energy fixed at 6.4 keV. Therefore, the width of the Fe Kα line places the source in the Compton-thin region.
3.2 Mid-infrared evidence
In terms of continuum emission, the mid-IR spectral range contains a wealth of information to disentangle the AGN from the SB contribution in galaxies. This comes from both broad features and fine structure emission lines. In particular, high metallicity starburst galaxies show very similar mid-IR spectra (see e.g., Brandl et al., 2006; Bernard-Salas et al., 2009), which are rather different from the continuum and line emission observed in pure AGN. Because of this, spectral decomposition of Spitzer IRS spectra is a powerful tool to estimate the fractional AGN and SB contributions at different mid-IR wavelengths in both local (see e.g., Nardini et al., 2008, 2010; Alonso-Herrero et al., 2012) and high- (e.g. Menéndez-Delmestre et al., 2009) galaxies.
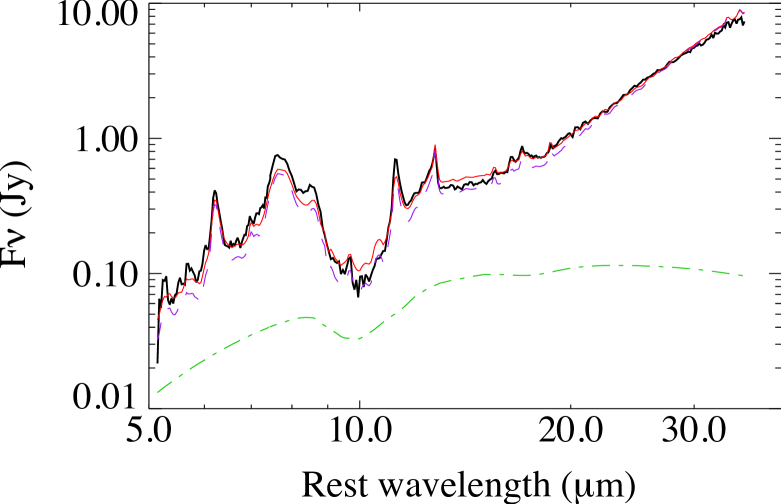
In the case of local LIRGs Alonso-Herrero et al. (2012) demonstrated that the mid-IR spectral decomposition can identify even subtle AGN emission that may otherwise be under the detection threshold with other mid-IR diagnostics. Here we used a spectral decomposition method very similar to theirs to estimate the AGN contribution with respect to the total mid-IR emission of Mrk 938. For the SB component this method uses the average starburst spectrum of Brandl et al. (2006), and the templates of purely star forming (U)LIRGs of Rieke et al. (2009) covering the IR luminosity range 10.5 . The AGN continuum emission is represented by that produced by an interpolated version of the CLUMPY torus models of Nenkova et al. (2008a, b). We restricted the large database of the CLUMPY torus models to only use two AGN templates. These were derived by Ramos Almeida et al. (2011a) as the best fitted models to the average SEDs of nearby type 1 and type 2 Seyferts using a Bayesian code (Asensio Ramos & Ramos Almeida, 2009). We then looked for the best combination of SB + AGN templates to fit the IRS spectrum that minimised . The best fit to the IRS spectrum of Mrk 938 was achieved with the type 2 AGN template, as expected, plus the starburst template. This SB template is required to fit the relatively deep 9.7 µm silicate feature observed in this galaxy. We note that the IR luminosity of the best fit template is higher than that of our galaxy. This might indicate that the IR emission comes from a relatively compact region (Sect. 4.1), as is the case of many LIRGs.
In Fig. 5 we show the IRS spectrum of Mrk 938 plus the AGN+SB best fit model, in addition to the scaled model components. As can be seen from the figure, the AGN contribution to the mid-IR emission is small but detectable. The AGN fractional contributions to the continuum emission within the Spitzer/IRS slit are listed in Table 3. Although our statistical uncertainties on the derived parameters are small (5%) the errors associated to the templates can be larger, especially in the SB component. Our results are in good agreement with those of Deo et al. (2009). Clearly, as found in local LIRGs and many local Seyfert galaxies, the AGN contribution at wavelengths longer than 40 µm is greatly reduced (see Alonso-Herrero et al., 2012; Mullaney et al., 2011). Vega et al. (2008) obtained a contribution of 17% of the AGN to the 3–30 µm luminosity, which is at the upper end of the AGN contribution that we find at 20µm including uncertainties. Tommasin et al. (2010) find an AGN contribution to the 19µm flux of Mrk 938 of 50 (13)%, which is considerably higher than our estimation. This can be explained because they used upper limits on the undetected line widths for their estimation.
| [AGN] | [AGN] | [AGN] | [AGN] |
|---|---|---|---|
| 0.21 | 0.10 | 0.05 | 0.02 |
Additionally, we can use mid-IR high excitation emission lines to investigate the AGN emission, in particular, the [Ne v] lines at 14.32 µm and 24.32 µm and the [O iv] 25.89 µm line (Genzel et al., 1998). Tommasin et al. (2010) did not detect any of these emission lines in Mrk 938 (see also Gallimore et al., 2010; Pereira-Santaella et al., 2010a). When these high excitation emission lines are ratioed with a line mostly produced by star formation (e.g., the [Ne ii] 12.81 µm), it is possible to obtain an approximate contribution -if any- of the AGN to the mid-IR emission of a galaxy. The upper limit to the [O iv] 25.89 µm/[Ne ii] 12.81 µm of (Tommasin et al., 2010; Pereira-Santaella et al., 2010a) indicates that the mid-IR emission of this galaxy is dominated by star formation activity (see e.g., Alonso-Herrero et al., 2012; Petric et al., 2011). This is in good agreement with the low AGN fractional contribution to the mid-IR emission inferred from the spectral decomposition.
Since the IRS slit encloses most of the 24 µm emission (from the comparison with the MIPS photometry, see Table 1), the derived AGN fraction contribution to the 24 µm emission is 0.05. Alonso-Herrero et al. (2012) also found that in local LIRGs this fractional AGN contribution is related to the AGN bolometric contribution to the IR luminosity of the system. Using their relation we estimated that in Mrk 938 . This is in good agreement with the AGN bolometric contribution estimated by Vega et al. (2008) of 4% from their modelling of the full SED of this galaxy. We derived then an AGN bolometric luminosity of 2.6 erg s-1. Alternatively, the AGN bolometric luminosity can be estimated from the hard X-ray keV luminosity. Using the bolometric correction of Marconi et al. (2004) and our derived X-ray luminosity from the model fit erg s-1(Table 2), we get a bolometric luminosity of =1.6 erg s-1, compatible with our previous estimation derived from the IRS spectral decomposition.
4 Starburst Activity
It is now becoming clear that the size of star-forming regions and the resulting IR surface brightness (also referred as compactness) of IR bright galaxies may help us understanding how star formation is produced in galaxies. That implies that we may be able to differentiate between extended steady star formation in disks and compact star formation activity driven by mergers. These two processes produce different overall IR spectral energy distributions (SEDs) of LIRGs and ULIRGs both locally and at high-redshift (see e.g., Rujopakarn et al., 2011a, b, and references therein), where there is no clear dependence of the shape of SED with .
Similar to the fundamental planes of spiral and elliptical galaxies, there are three parameters that define a fundamental plane of IR-selected galaxies. (Chanial et al., 2007). These are: the IR luminosity, the dust temperature and the size of the IR-emitting regions. According to these authors, changes in the IR compactness describe a smooth sequence going from quiescent to starburst galaxies, where there is a simultaneous increase of gas surface density, effective dust temperature, and SFR surface density. In the following sections we explore in detail some of these properties in Mrk 938.
4.1 IR Emitting Region
The detailed study of the optical properties of Mrk 938 (morphology, star cluster ages, and dynamics) led Schweizer & Seitzer (2007) to claim that this object is the result of a merger of two gas-rich galaxies of unequal masses (1/32/3). At present, the current starburst activity of Mrk 938 appears to be confined to a highly obscured central region of less than 1 kpc in size.
Fig. 3 presents the Spitzer/IRAC images at 3.6 and 8 µm. The 3.6 µm image, which probes the photospheric emission, shows the main body of the galaxy plus some extended low surface brightness emission. The northeast tidal tail of this merger system is clearly detected in the form of diffuse emission and some knots. There also exists a southwest tail with a much fainter optical surface brightness that is hardly seen in the 3.6 µm image. The knots in the northeast tail, also detected in the IRAC 8 µm image, appear to be coincident with the blue knots lying at a projected distance of (kpc) from the nucleus (Schweizer & Seitzer, 2007). Knots in both tidal tails are associated with H ii regions (A. Pérez-García, private communication).
The IRAC 8 µm emission, which probes dust continuum emission and PAH emission, is dominated by the presence of a bright central region. This region appears slightly resolved with a size (FWHM) of (pc). The size of the 8 µm emitting region inferred from the IRAC data is in good agreement with the distribution of the mid-IR emission detected from ground-based high angular resolution imaging as measured by Miles et al. (1996). These authors also showed that there are two mid-IR sources in the central regions of Mrk 938 separated 1.2 ″, although most of the mid-IR emission arises from a resolved source with an angular size of (FWHM). This confirms that the starburst region in this galaxy is only relatively compact (kpc, FWHM), as is the case in a large fraction of local LIRGs (Alonso-Herrero et al., 2006; Rujopakarn et al., 2011a). Also, the presence of extended mid-IR emission in the central regions of Mrk 938 is in agreement with the result that the AGN contribution to the mid-IR emission is low, as demonstrated in Sect. 3.2. We used PACS 70 µm and MIPS 24 µm images, that have comparable angular resolution, and probed the current star formation. We can set an upper limit to the starburst region of kpc (FWHM), which is in good agreement with the measured size at shorter wavelengths.
We analysed the Herschel brightness profiles of Mrk 938 and compared them with those of point-like sources. We found no evidence of extended emission in any of the PACS or SPIRE bands. As a sanity check, we performed aperture photometry on the PACS 70 µm image using small radii, in this case 6 and 14 ″. After applying the corresponding aperture corrections we obtained values in agreement with the integrated flux at 70 µm, therefore confirming that we are not detecting extended emission.
4.2 Star Formation Rate
Based on a variety of morphological, photometric and spectroscopic arguments, Schweizer & Seitzer (2007) concluded that the star formation activity of Mrk 938 was higher and more spread out in the past. As a result of the merger process a galaxy-wide starburst started about 600 million years ago. It is this post-starburst population that appears to dominate the emission from the blue disk present in this system. Riffel et al. (2008) used near-IR spectroscopy to study the stellar populations in the central region of this galaxy. They found that the near-IR emission of this galaxy is dominated by an intermediate-age stellar population of Gyr, whereas the young (Myr) stellar population contributes to less than 25% of this emission.
In the previous section we saw that most of the IR emission of Mrk 938 appears to be coming from a relatively compact region 0.52 kpc in size. In very dusty galaxies, as is the case of Mrk 938, this IR emission is probing the current star formation rate (SFR). This is because the UV light emitted by the young stars is absorbed by the dust and re-emitted in the IR. Therefore, some IR monochromatic luminosity or, alternatively, the total IR luminosity can be used to estimate the SFR (Kennicutt et al., 2009). The 24 µm monochromatic luminosity has been found to be a good indicator of the current SFR of dusty galaxies (e.g. Alonso-Herrero et al., 2006; Calzetti et al., 2007; Rieke et al., 2009). It has the advantage that it traces dust heated by the most massive stars, hence directly probing the current star formation activity. We used the Rieke et al. (2009) calibration
| (1) | |||||
which assumes a Kroupa IMF555Using a Salpeter IMF would result in a SFR approximately 1.4 times higher than that from the Kroupa IMF (see e.g. Kennicutt et al., 2009).. Using (calculated from the 24 µm flux in Table 1), we estimated a SFRIR of 42 yr-1 to an accuracy within 0.2 dex (after removing the AGN contribution at this wavelength). This value is actually the obscured SFR. This value lies between the values estimated by Vega et al. (2008) of 21 and 151 yr-1 based on SED fitting for star formation in the last 10 Myr and averaged over the entire burst respectively. Also, our derived SFR is similar to the 64 yr-1 obtained from 1.4 GHz observations (Fernández et al., 2010). As a sanity check we can test the above hypothesis that most of the on-going SFR in LIRGs is taking place in obscured environments.
A source of uncertainty in the SFR calculation using IR indicators arises if a significant fraction of the stellar luminosity is not absorbed and then re-emitted in the IR, but escapes directly in the UV instead. We derived the SFRUV using the far-UV flux for this galaxy. This was found by correlation of the source position with the GALEX archive. Taking into account a Galactic colour excess =0.027 (quantity reported in NED666The NASA/IPAC Extragalactic Database (NED) is operated by the Jet Propulsion Laboratory, California Institute of Technology, under contract with the National Aeronautics and Space Administration) and applying the extinction curve of Fitzpatrick (1999) we derived the UV corrected flux (=0.62 mJy). Following Kennicutt (1998), assuming a flat continuum and scaling to a Kroupa IMF we have
| (2) |
where is the UV luminosity. For Mrk 938 we find that the represents 3% of the , as also found in Howell et al. (2010). This value is in agreement with the median value found for a sample of LIRGs in Buat et al. (2007) and Pereira-Santaella et al. (2011).
Similarly, we can estimate the unobscured SFR from the observed (not corrected for extinction) integrated H luminosity ( erg s-1) reported by Moustakas & Kennicutt (2006). We used the SFR recipe of Kennicutt et al. (2009) that accounts for the unobscured and obscured SFR in terms of the H and 24 µm luminosities, respectively. We inferred that most () of the current star formation in Mrk 938 is obscured, and thus likely to be taking place in the compact starburst region revealed by the mid-IR observations described above. This is in agreement with the small value found for the calculated above.
4.3 X-rays from star formation
For a starburst, the emission of radiation in the X-ray domain can be attributed to a combination of components like supernova remnants, hot plasmas associated to star-forming regions and High Mass X-ray Binaries (HMXB) within the galaxy among others (Fabbiano, 1989). Several investigations have revealed correlation between the X-ray emission and total SFR in starbursts (e.g. Ranalli et al., 2003; Pereira-Santaella et al., 2011). The linear relation of Pereira-Santaella et al. (2011) reads
| (3) |
with a 0.25 dex scatter, where =3.4 and 3.9 for the soft 0.5–2 keV and hard 2–10 keV X-rays respectively. Applying this equation with the SFRs derived in Sect. 4.2, we estimate the following luminosities due to star formation activity in Mrk 938: erg s-1and erg s-1. The errors take into account the uncertainties in the SFR value and the uncertainties in Eq. 3.
We have compared the X-ray emission expected from star formation activity as calculated above with that of the fitted XMM-Newton data. Using the luminosities measured in Sect. 2.3 for the best-fit model to the X-ray data we get a consistent value for the soft component (0.5 erg s-1). This is in agreement with the fact that most, if not all, of the X-ray emission at soft energies is produced by the starburst, as is also the case in a large fraction of local LIRGs (Pereira-Santaella et al., 2011). Also, the model derived from the fit of the X-ray data is consistent with star formation. However, in the 2–10 keV band, the luminosity of the X-ray fitting is an order of magnitude higher than that expected from the SFR. This was a priori anticipated because the AGN is the major contributor to the harder energies.
5 Spectral Energy Distribution and Dust Properties
Several attempts have been made in the past to model the IR and submillimeter spectral energy distributions (SED) of LIRGs and ULIRGs using a modified blackbody with one or several dust temperature or full radiative transfer modelling (see e.g. Klaas et al., 2001; Dunne & Eales, 2001; Vega et al., 2008; Clements et al., 2010). Here we use for the first time Herschel photometry and data from the literature to obtain better estimates of the dust properties of Mrk 938. Table 1 presents our Herschel photometry as well as IRAS, Spitzer and ISO data compiled from the literature to construct the far-IR SED. The errors quoted for the Herschel flux densities take into account the photometric calibration uncertainties of in all the bands. The remaining errors listed in Table 1 are those given in the corresponding references.
.
We parametrised the SED of Mrk 938 using the standard modified blackbody, which depends on the dust temperature () and the dust emissivity (). In the case of optically thin emission in the IR, this function can be approximated as:
| (4) |
We fixed as it has been found to be a reasonable value for IR bright galaxies (Dunne & Eales, 2001). Then we used a minimization method to fit the dust temperature. The SED fit was done using all the flux densities for µm given in Table 1, with the normalization at 100 µm. For the IRAS and ISO flux densities we used a 10% uncertainty.
We obtained a best-fit dust temperature of K. As can be seen from Fig. 6 (left panel), using a single temperature produces a good fit to the far-IR SED of Mrk 938. Acceptable fits () were also obtained in the range of temperatures K (the fits for the limitting temperatures are shown in Fig. 6 as dotted lines). The best-fit temperature is similar to those found by Klaas et al. (2001) for local (U)LIRGs using similar assumptions. We also tried a fit using , which has been found to fit better the SEDs of LIRGs and ULIRGs (Dunne & Eales, 2001; Clements et al., 2010). The fit provided a higher dust temperature, as expected. However, this fit was considerably worse, having a value of more than three times higher than that obtained with .
We derived the dust mass () using the following equation (adapted from Hildebrand, 1983):
| (5) |
where is the observed flux density, is the luminosity distance, is the blackbody emission for the best-fit dust temperature, and is the absorption coefficient. We evaluated this expression at 250 µm using an absorption coefficient of as interpolated from the dust model of Li & Draine (2001). We obtained , which is consistent with the values derived for local ULIRGs and other IR-bright galaxies (see Klaas et al., 2001; Clements et al., 2010, and references therein). For the range of acceptable dust temperatures, the inferred uncertainty in the calculated dust mass is . Vega et al. (2008) estimated an of . However, they used the dust-to-mass ratio as conversion factor between the gas and the dust mass, using a fixed value of 100 for all sources in their sample. This can introduce a large uncertainty in the dust mass. This is most probably the reason for the difference between our value and that in Vega et al. (2008).
We have also fitted the SED of LIRGs using a two-temperature model, similar to those used in other works (e.g. Dunne & Eales, 2001; Clements et al., 2010), where we have taken into account all flux density values for µm to obtain a better constraint of the properties of the warm dust. Using two modified blackbody functions and =2 we obtained K and K for the warm and cold components, respectively. As expected, the temperature of the cold dust is very similar to that of the single blackbody fit. We also note that the temperature of the warm dust is not tightly constrained, as K produces values of similar to . Finally, the goodness of the fit of the two temperature model is only marginally better than the single temperature fit. Clements et al. (2010) found higher dust temperatures for ULIRGs than those of lower luminosity systems, i.e. a median dust temperature of 42 K for a sample of ULIRGs, while a median of 35 K has been found for normal galaxies (Dunne & Eales, 2001). The latter is consistent with the relatively cold temperature found in Mrk 938. We also find that the mass ratio of the cold to the warm dust component is very high (), which clearly indicates that the cold component is dominant in this galaxy. The total dust mass is very similar to the value obtained with one dust temperature.
In Fig. 6 (right panel) we have plotted the entire SED including the torus model of hot dust and the best-fit model to the far-IR data using the combination of two blackbodies described above. The latter best-fit temperatures are typical of star forming regions in the galaxy disk, therefore confirming that the active nucleus is not responsible for most of the observed dust emission (as seen in e.g. Hatziminaoglou et al., 2010). Dust in regions of star formation have peak temperatures between 40 and 70 K, while radiation of AGN origin has a characteristic peak temperature within the range 120170 K (e.g. Pérez García & Rodríguez Espinosa, 2001). This is in agreement with what we found in Sect. 3.2 from the spectral decomposition, where we concluded that the dusty torus only contributes up to 2% of the observed IR emission.
As a comparison, Ramos Almeida et al. (2011b) studied the dust distribution of the Seyfert 2 galaxy NGC 3081 also including Herschel PACS and SPIRE data in their analysis. The nuclear emission of this galaxy was reproduced by a clumpy torus model of warm dust heated by the AGN. The circumnuclear emission was fitted by a cold dust component at 28 K heated by young stars in the galaxy disk, plus a colder component at 19 K in the outskirts of the galaxy heated by the interstellar radiation. Similarly, Radovich et al. (1999) decomposed the SED of the narrow line galaxy NGC 7582 and found an extranuclear emission dominated by cold dust at 30 K, plus an additional very cold component emitting at 17 K. We do not detect this very cold dust component in Mrk 938. This is because we cannot resolve any extended emission in our data, and although this component is likely to exist its contribution to the total IR luminosity is negligible.
We can finally estimate the size of the IR emitting region. Following Klaas et al. (2001), for an optically thin (transparent) blackbody with , the far-IR emitting component is homogeneously distributed in a “minimum face-on disk” of radius with the form:
| (6) |
Assuming an opacity at 100 µm , we obtain a minimum radius for the IR emitting region of pc, in good agreement with our measurements from the mid-IR images in Sect. (4.1).
6 Summary and conclusions
LIRGs have emerged as an important cosmological class given that they may play a central role in our understanding of the general evolution of galaxies and black holes. We have studied Mrk 938, a LIRG in the local Universe classified as a Seyfert 2 through optical spectroscopy. Table 4 summarises the relevant parameters resulting from the present work which, in addition to table 8 in Schweizer & Seitzer (2007), shows the main properties of Mrk 938. The analysis of the X-ray data favours the presence of a highly obscured AGN, where the SB emission prevails at soft energies and the active nucleus dominates at hard energies. The absorption-corrected hard X-ray luminosity is too high to be originated only in a pure starburst.
| AGN Properties | |||
| Hard X-ray luminosity | absorption corrected | ||
| Bolometric luminosity | (AGN) | from X-ray and bolometric correction | |
| from IRS decomposition | |||
| AGN contribution | Bolometric | 2% | from IRS decomposition |
| keV | from comparison with SFR-due X-ray luminosity | ||
| keV | from comparison with SFR-due X-ray luminosity | ||
| 24 µm | 5 ()% | from IRS decomposition | |
| SB Properties | |||
| Star Formation Rate | SFRobscured | yr-1 | from MIPS 24 µm, Kroupa IMF |
| Size IR emitting region | kpc | from IRAC 8 µm (FWHM) | |
| kpc | from MIPS 24 µm, PACS 70 µm (FWHM) | ||
| kpc | from dust mass, assuming | ||
| Dust Temperature | 35 (4) K | two temperature fit, fixed | |
| 63 (4) K | “ | ||
| Dust Mass | “ | ||
| Dust mass Ratio | 79 | “ | |
We have performed a decomposition of the Spitzer/IRS spectrum and recovered the AGN contribution to the IR luminosity, which is overwhelmed by the intense emission of star formation. The best fit model to the IRS data was achieved with a combination of a type 2 AGN plus a starburst templates. Using the derived fractional contribution of the AGN to the luminosity at 24 µm we derived an AGN bolometric contribution to the IR luminosity of 2%, which is in agreement with previous estimations. This supports the proposed scenario that intense dusty starbursts are responsible for the high IR luminosities in most local LIRGs. The analysis of IR images shows that the IR emission of Mrk 938 originates in a relatively compact region, with a size between 0.5 and 2 kpc. We have also demonstrated that most of the on-going SFR is produced in an obscured environment as expected for LIRGs.
The wealth of multi-wavelength archival data of this source has been used in conjunction with our own observations to constrain the SED. We have used Herschel imaging data for the first time to constrain the cold dust emission with unprecedented accuracy. We have derived dust temperatures of 63 K and 35 K for the warm and cold components, respectively. Using the results of our SED fitting we have derived a cold dust mass of and a very high mass ratio of the cold to the warm dust components. This demonstrates that emission of cold dust clearly dominates the IR SED.
Acknowledgments
Thanks to F. Schweizer for kindly providing the optical image of Mrk 938, to J. Gallimore for providing the MIPS SED data, and to H. Krimm and W. Baumgartner for the analysis of the BAT observations. PE, AAH and MPS acknowledge support from the Spanish Plan Nacional de Astronomía y Astrofísica under grant AYA2009-05705-E. MPS acknowledges support from the CSIC under grant JAE-Predoc-2007. AMPG acknowledges support by the Spanish Plan Nacional de Astronomía y Astrofísica under the grant AYA2008-06311-CO2-01. CRA acknowledges financial support from STFC (ST/G001758/1) and from the Spanish Ministry of Science and Innovation (MICINN) through project Consolider-Ingenio 2010 Program grant CSD2006-00070: First Science with the GTC. MP acknowledges Junta de Andalucía and Spanish Ministry of Science and Innovation through projects PO8-TIC-03531 and AYA2010-15169.
PACS has been developed by a consortium of institutes led by MPE (Germany) and including UVIE (Austria); KU Leuven, CSL, IMEC (Belgium); CEA, LAM (France); MPIA (Germany); INAF-IFSI/OAA/OAP/OAT, LENS, SISSA (Italy); IAC (Spain). This development has been supported by the funding agencies BMVIT (Austria), ESA-PRODEX (Belgium), CEA/CNES (France), DLR (Germany), ASI/INAF (Italy), and CICYT/MCYT (Spain). SPIRE has been developed by a consortium of institutes led by Cardiff University (UK) and including Univ. Lethbridge (Canada); NAOC (China); CEA, LAM (France); IFSI, Univ. Padua (Italy); IAC (Spain); Stockholm Observatory (Sweden); Imperial College London, RAL, UCL-MSSL, UKATC, Univ. Sussex (UK); and Caltech, JPL, NHSC, Univ. Colorado (USA). This development has been supported by national funding agencies: CSA (Canada); NAOC (China); CEA, CNES, CNRS (France); ASI (Italy); MCINN (Spain); SNSB (Sweden); STFC (UK); and NASA (USA). This work is based on observations made with the Spitzer Space Telescope, which is operated by the Jet Propulsion Laboratory, California Institute of Technology, under NASA contract 1407.
References
- Albrecht et al. (2007) Albrecht, M., Krügel, E., & Chini, R. 2007, A&A, 462, 575
- Alonso-Herrero et al. (2012) Alonso-Herrero, A., Pereira-Santaella, M., Rieke, G. H., & Rigopoulou, D. 2012, ApJ, 744, 2
- Alonso-Herrero et al. (2006) Alonso-Herrero, A., Rieke, G. H., Rieke, M. J., et al. 2006, ApJ, 650, 835
- Arnouts et al. (2007) Arnouts, S., Walcher, C. J., Le Fèvre, O., et al. 2007, A&A, 476, 137
- Asensio Ramos & Ramos Almeida (2009) Asensio Ramos, A. & Ramos Almeida, C. 2009, ApJ, 696, 2075
- Barthelmy et al. (2005) Barthelmy, S. D., Barbier, L. M., Cummings, J. R., et al. 2005, Space Sci. Rev., 120, 143
- Bassani et al. (1999) Bassani, L., Dadina, M., Maiolino, R., et al. 1999, ApJS, 121, 473
- Bernard-Salas et al. (2009) Bernard-Salas, J., Spoon, H. W. W., Charmandaris, V., et al. 2009, ApJS, 184, 230
- Brandl et al. (2006) Brandl, B. R., Bernard-Salas, J., Spoon, H. W. W., et al. 2006, ApJ, 653, 1129
- Buat et al. (2007) Buat, V., Marcillac, D., Burgarella, D., et al. 2007, A&A, 469, 19
- Calzetti et al. (2007) Calzetti, D., Kennicutt, R. C., Engelbracht, C. W., et al. 2007, ApJ, 666, 870
- Chanial et al. (2007) Chanial, P., Flores, H., Guiderdoni, B., et al. 2007, A&A, 462, 81
- Clements et al. (2010) Clements, D. L., Dunne, L., & Eales, S. 2010, MNRAS, 403, 274
- Dale & Helou (2002) Dale, D. A. & Helou, G. 2002, ApJ, 576, 159
- Deo et al. (2007) Deo, R. P., Crenshaw, D. M., Kraemer, S. B., et al. 2007, ApJ, 671, 124
- Deo et al. (2009) Deo, R. P., Richards, G. T., Crenshaw, D. M., & Kraemer, S. B. 2009, ApJ, 705, 14
- Dickey & Lockman (1990) Dickey, J. M. & Lockman, F. J. 1990, ARA&A, 28, 215
- Dunne & Eales (2001) Dunne, L. & Eales, S. A. 2001, MNRAS, 327, 697
- Elbaz et al. (2002) Elbaz, D., Cesarsky, C. J., Chanial, P., et al. 2002, A&A, 384, 848
- Fabbiano (1989) Fabbiano, G. 1989, ARA&A, 27, 87
- Fazio et al. (2004) Fazio, G. G., Hora, J. L., Allen, L. E., et al. 2004, ApJS, 154, 10
- Fernández et al. (2010) Fernández, X., van Gorkom, J. H., Schweizer, F., & Barnes, J. E. 2010, AJ, 140, 1965
- Ferrarese & Ford (2005) Ferrarese, L. & Ford, H. 2005, A&A, 116, 523
- Fitzpatrick (1999) Fitzpatrick, E. L. 1999, PASP, 111, 63
- Gabriel et al. (2004) Gabriel, C., Denby, M., Fyfe, D. J., et al. 2004, in Astronomical Society of the Pacific Conference Series, Vol. 314, Astronomical Data Analysis Software and Systems (ADASS) XIII, ed. F. Ochsenbein, M. G. Allen, & D. Egret, 759–+
- Gallimore et al. (2010) Gallimore, J. F., Yzaguirre, A., Jakoboski, J., et al. 2010, ApJS, 187, 172
- Genzel et al. (1998) Genzel, R., Lutz, D., Sturm, E., et al. 1998, ApJ, 498, 579
- Gonçalves et al. (1999) Gonçalves, A. C., Véron-Cetty, M.-P., & Véron, P. 1999, A&AS, 135, 437
- Griffin et al. (2010) Griffin, M. J., Abergel, A., Abreu, A., et al. 2010, A&A, 518, L3+
- Guainazzi et al. (2005) Guainazzi, M., Matt, G., & Perola, G. C. 2005, A&A, 444, 119
- Hatziminaoglou et al. (2010) Hatziminaoglou, E., Omont, A., Stevens, J. A., et al. 2010, A&A, 518, L33+
- Hildebrand (1983) Hildebrand, R. H. 1983, QJRAS, 24, 267
- Hopkins et al. (2006) Hopkins, P. F., Hernquist, L., Cox, T. J., et al. 2006, ApJS, 163, 1
- Houck et al. (2004) Houck, J. R., Roellig, T. L., van Cleve, J., et al. 2004, ApJS, 154, 18
- Howell et al. (2010) Howell, J. H., Armus, L., Mazzarella, J. M., et al. 2010, ApJ, 715, 572
- Jarrett et al. (2003) Jarrett, T. H., Chester, T., Cutri, R., Schneider, S. E., & Huchra, J. P. 2003, AJ, 125, 525
- Kennicutt (1998) Kennicutt, Jr., R. C. 1998, ARA&A, 36, 189
- Kennicutt et al. (2009) Kennicutt, Jr., R. C., Hao, C.-N., Calzetti, D., et al. 2009, ApJ, 703, 1672
- Klaas et al. (2001) Klaas, U., Haas, M., Müller, S. A. H., et al. 2001, A&A, 379, 823
- Kormendy & Richstone (1995) Kormendy, J. & Richstone, D. 1995, ARA&A, 33, 581
- La Franca et al. (2005) La Franca, F., Fiore, F., Comastri, A., et al. 2005, ApJ, 635, 864
- Le Floc’h et al. (2005) Le Floc’h, E., Papovich, C., Dole, H., et al. 2005, ApJ, 632, 169
- Li & Draine (2001) Li, A. & Draine, B. T. 2001, ApJ, 554, 778
- Magdziarz & Zdziarski (1995) Magdziarz, P. & Zdziarski, A. A. 1995, MNRAS, 273, 837
- Maiolino et al. (1998) Maiolino, R., Salvati, M., Bassani, L., et al. 1998, A&A, 338, 781
- Marconi & Hunt (2003) Marconi, A. & Hunt, L. K. 2003, ApJ, 589, L21
- Marconi et al. (2004) Marconi, A., Risaliti, G., Gilli, R., et al. 2004, MNRAS, 351, 169
- Matt et al. (1996) Matt, G., Brandt, W. N., & Fabian, A. C. 1996, MNRAS, 280, 823
- Menéndez-Delmestre et al. (2009) Menéndez-Delmestre, K., Blain, A. W., Smail, I., et al. 2009, ApJ, 699, 667
- Miles et al. (1996) Miles, J. W., Houck, J. R., Hayward, T. L., & Ashby, M. L. N. 1996, ApJ, 465, 191
- Moustakas & Kennicutt (2006) Moustakas, J. & Kennicutt, Jr., R. C. 2006, ApJS, 164, 81
- Mullaney et al. (2011) Mullaney, J. R., Alexander, D. M., Goulding, A. D., & Hickox, R. C. 2011, MNRAS, 414, 1082
- Müller et al. (2011) Müller, T., Nielbock, M., Balog, Z., Klaas, U., & Vilenius, E. 2011, PACS Photometer - Point-Source Flux Calibration, PICC-ME-TN-037 v1.0
- Nardini et al. (2008) Nardini, E., Risaliti, G., Salvati, M., et al. 2008, MNRAS, 385, L130
- Nardini et al. (2010) Nardini, E., Risaliti, G., Watabe, Y., Salvati, M., & Sani, E. 2010, MNRAS, 405, 2505
- Nenkova et al. (2008a) Nenkova, M., Sirocky, M. M., Ivezić, Ž., & Elitzur, M. 2008a, ApJ, 685, 147
- Nenkova et al. (2008b) Nenkova, M., Sirocky, M. M., Nikutta, R., Ivezić, Ž., & Elitzur, M. 2008b, ApJ, 685, 160
- Pereira-Santaella et al. (2010a) Pereira-Santaella, M., Alonso-Herrero, A., Rieke, G. H., et al. 2010a, ApJS, 188, 447
- Pereira-Santaella et al. (2011) Pereira-Santaella, M., Alonso-Herrero, A., & Santos-Lleó, M. e. a. 2011, A&A, accepted [arXiv:1109.0921]
- Pereira-Santaella et al. (2010b) Pereira-Santaella, M., Diamond-Stanic, A. M., Alonso-Herrero, A., & Rieke, G. H. 2010b, ApJ, 725, 2270
- Pérez García & Rodríguez Espinosa (2001) Pérez García, A. M. & Rodríguez Espinosa, J. M. 2001, ApJ, 557, 39
- Pérez-González et al. (2005) Pérez-González, P. G., Rieke, G. H., Egami, E., et al. 2005, ApJ, 630, 82
- Petric et al. (2011) Petric, A. O., Armus, L., Howell, J., et al. 2011, ApJ, 730, 28
- Pilbratt et al. (2010) Pilbratt, G. L., Riedinger, J. R., Passvogel, T., et al. 2010, A&A, 518, L1+
- Poglitsch et al. (2010) Poglitsch, A., Waelkens, C., Geis, N., et al. 2010, A&A, 518, L2+
- Polletta et al. (1996) Polletta, M., Bassani, L., Malaguti, G., Palumbo, G. G. C., & Caroli, E. 1996, ApJS, 106, 399
- Radovich et al. (1999) Radovich, M., Klaas, U., Acosta-Pulido, J., & Lemke, D. 1999, A&A, 348, 705
- Ramos Almeida et al. (2011a) Ramos Almeida, C., Levenson, N. A., Alonso-Herrero, A., et al. 2011a, ApJ, 731, 92
- Ramos Almeida et al. (2011b) Ramos Almeida, C., Sánchez-Portal, M., Pérez García, A. M., et al. 2011b, MNRAS, L306+
- Ranalli et al. (2003) Ranalli, P., Comastri, A., & Setti, G. 2003, A&A, 399, 39
- Rieke et al. (2009) Rieke, G. H., Alonso-Herrero, A., Weiner, B. J., et al. 2009, ApJ, 692, 556
- Rieke et al. (2004) Rieke, G. H., Young, E. T., Engelbracht, C. W., et al. 2004, ApJS, 154, 25
- Riffel et al. (2008) Riffel, R., Pastoriza, M. G., Rodríguez-Ardila, A., & Maraston, C. 2008, MNRAS, 388, 803
- Rujopakarn et al. (2011a) Rujopakarn, W., Rieke, G. H., Eisenstein, D. J., & Juneau, S. 2011a, ApJ, 726, 93
- Rujopakarn et al. (2011b) Rujopakarn, W., Rieke, G. H., Weiner, B. J., et al. 2011b, ArXiv e-prints
- Sanders et al. (2003) Sanders, D. B., Mazzarella, J. M., Kim, D.-C., Surace, J. A., & Soifer, B. T. 2003, AJ, 126, 1607
- Sanders & Mirabel (1996) Sanders, D. B. & Mirabel, I. F. 1996, ARA&A, 34, 749
- Schweizer & Seitzer (2007) Schweizer, F. & Seitzer, P. 2007, AJ, 133, 2132
- Smith et al. (2007) Smith, J. D. T., Armus, L., Dale, D. A., et al. 2007, PASP, 119, 1133
- Spinoglio et al. (2002) Spinoglio, L., Andreani, P., & Malkan, M. A. 2002, ApJ, 572, 105
- Spoon et al. (2007) Spoon, H. W. W., Marshall, J. A., Houck, J. R., et al. 2007, ApJ, 654, L49
- Tommasin et al. (2010) Tommasin, S., Spinoglio, L., Malkan, M. A., & Fazio, G. 2010, ApJ, 709, 1257
- Vega et al. (2008) Vega, O., Clemens, M. S., Bressan, A., et al. 2008, A&A, 484, 631
- Veilleux et al. (1995) Veilleux, S., Kim, D.-C., Sanders, D. B., Mazzarella, J. M., & Soifer, B. T. 1995, ApJS, 98, 171
- Yuan et al. (2010) Yuan, T.-T., Kewley, L. J., & Sanders, D. B. 2010, ApJ, 709, 884