Copyright 2012 by American Institute of Physics. The following article appeared in Appl. Phys. Lett. 100, 061903 (2012); doi: 10.1063/1.3681169 and may be found at http://dx.doi.org/10.1063/1.3681169
Oxygen vacancy segregation and space-charge effects in grain boundaries of dry and hydrated BaZrO3
Abstract
A space-charge model is applied to describe the equilibrium effects of segregation of double-donor oxygen vacancies to grain boundaries in dry and wet acceptor-doped samples of the perovskite oxide BaZrO3. The grain boundary core vacancy concentrations and electrostatic potential barriers resulting from different vacancy segregation energies are evaluated. Density-functional calculations on vacancy segregation to the mirror-symmetric (112) [10] tilt grain boundary are also presented. Our results indicate that oxygen vacancy segregation can be responsible for the low grain boundary proton conductivity in BaZrO3 reported in the literature.
pacs:
61.72.Mm 61.72.jd 68.35.Dv 71.15.Nc 77.22.JpWhile the benefits of ceramic materials make solid oxide proton conductors like barium zirconate (BaZrO3, BZO) desirable for use as electrolytes in electrochemical devices such as hydrogen fuel cells, limitations in proton conductivity have thus far prevented successful implementation. Ishihara (2009); Fabbri, Pergolesi, and Traversa (2010) It has become apparent that boundaries between grains in the material are the prime source of inhibited overall proton conductivity. Kreuer (2003); Bohn and Schober (2000); Pergolesi et al. (2010)
Experiments have established that the grain boundary (GB) proton resistivity is an intrinsic effect, not caused by the segregation of secondary phases at the GB.Iguchi, Sata, and Yugami (2010); Dahl et al. (2011) Two different explanations have instead been put forward Park et al. (2009), in which the GB effects are believed to originate in either a structural distortion in the GB region Kreuer (2003), or in the appearance of positively charged GBs, caused by a change in chemical composition and leading to Schottky barriers and the depletion of mobile protonic charge carriers.Iguchi, Sata, and Yugami (2010); Kjølseth et al. (2010); Chen, Danel, and Kim (2011) At present the latter explanation model is the predominating one Iguchi, Sata, and Yugami (2010); Kjølseth et al. (2010); Chen, Danel, and Kim (2011), but the details of the GB cores are neither well understood nor sufficiently explored.
In this letter we present an investigation concerning the equilibrium segregation of oxygen vacancies to GBs in dry and hydrated acceptor-doped BZO and the electrostatic potential barrier such segregation causes. Density-functional theory (DFT) is used to evaluate the energy of vacancy segregation to a tilt GB and a space-charge model is applied to describe the equilibrium barrier and core vacancy concentration resulting from different segregation energies. We show that segregation energies on the order that we find can cause potential barriers consistent with experimental findings on GB proton conductivity in BZO.
The system is modeled using the periodic supercell technique and all DFT calculations are performed within the plane-wave approach as implemented in the Vienna ab-initio simulation package (VASP) Kresse and Hafner (1993); Kresse and Furthmüller (1996). Electron-ion interactions are described by the projector augmented wave method Blöchl (1994) and a generalized gradient approximation (GGA) exchange-correlation functional due to Perdew and Wang (PW91) Wang and Perdew (1991) is used. More computational details have been reported elsewhere. Sundell, Björketun, and Wahnström (2006) In the present work all calculations are performed non-spin-polarized with a plane-wave cutoff of 400 eV (constant volume) or 520 eV (volume relaxations), and a Monkhorst-Pack -point grid is used to sample the Brillouin zone.
Theoretical and experimental work on the currently considered (112) [10] tilt GB has previously been performed on strontium titanate K. J. Dudeck and N. A. Benedek and D. J. H. Cockayne (2010) and this particular GB is well suited for DFT calculations. It consists of alternating BaZrO and O2 planes and here we consider the mirror-symmetric BaZrO terminated case, which has the lowest energy. The interplanar distance is Å, with a computed value of the bulk lattice constant Å. Our supercell has the dimensions () in the directions ([11], [10], [112]) and consists of 180 atoms with the distance Å between the periodically repeated GBs.
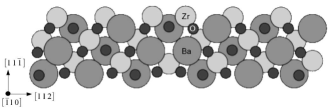
To begin with, the system is optimized by relaxing the atomic structure, resulting in the configuration shown in Fig. 1. The GB expands 0.135 Å in the perpendicular direction and the calculated GB energygra is J/m2. Next, an oxygen vacancy is introduced. Since double-donor vacancies are dominating in acceptor doped BZO, we consider the charge state only. The vacancy formation energy is determined as function of vacancy position, both with and without relaxing the structure. As reference, the vacancy formation energy for the bulk system with the same size of the supercell is also determined. The segregation energy is then obtained by taking the difference . Note that the error due to interaction between charged defect images in the periodic supercell calculations is to a large degree cancelled for the quantity .
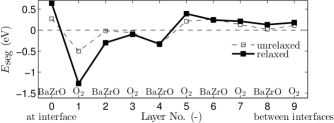
We find a significant segregation tendency to layer 1 of the GB, with an energy of eV (cf. Fig. 2). A large part of this energy gain derives from ionic relaxation during vacancy formation. Referring to Fig. 1, the high stability of vacancies in layer 1 is due to the close proximity of the pair of oxygen ions on either side of the interface and the electrostatic repulsion this causes. As one of the oxygens in the pair is removed, the other ion relaxes considerably, to a position in the symmetry plane.
Having established the existence of low-energy vacancy positions close to the GB interface, we would now like to evaluate the corresponding equilibrium vacancy segregation and electrostatic potential barrier as function of temperature. To do so, we apply a space charge model Maier (1995); De Souza (2009); Guo and Waser (2006); Kim, Fleig, and Maier (2003) with an ideal depletion approximation to two different cases: i) dry BZO, where a concentration of single-acceptor dopants are perfectly compensated for by double-donor vacancies, and ii) wet BZO, where dissociative absorption of water molecules from a humid atmosphere is taken into account.
In both cases we consider a one-dimensional model, with three regions of constant defect concentration: i) the GB core (), where an increased concentration of oxygen vacancies is expected and the proton concentration is assumed to vanish, ii) a compensating space charge layer (SCL) (), depleted of oxygen vacancies and protons, and finally iii) the neutral grain interior () with vacancy concentration and in the wet case proton concentration . The dopant concentration is taken to be fixed and equal throughout all regions and a concentration corresponding to occupation of 10% of the Zr sites is used in all calculations. Motivated by the high stability of oxygen vacancies in layer 1 (cf. Fig. 2), we define a core region enclosing that layer and denote the segregation energy for those vacancies with . Vacancies in layers 2,3,4, are treated as having zero segregation energy and the symmetry plane, layer 0, is assumed void of vacancies. For the core half-width we use the value Å. With this description the density of active oxygen vacancy sites in the core becomes about half that of the grain interior: , where Å-3.
We begin with the dry case and consider electrochemical equilibrium between oxygen vacancies in the GB core and grain interior for an ideal solution Maier (2004):
| (1) |
The electrostatic potential difference between core and interior, , is obtained by solving Poisson’s equation in the SCL with the boundary conditions . For the dielectric constant we use the value Adachi et al. (2001) and the size of the SCL is determined from charge compensation with respect to the core: , or . It follows that the present model is applicable for only. The solution for the potential difference is:
| (2) |
Eqs. 1 and 2 can now be solved iteratively to obtain and as function of temperature. Using the neutrality condition, the grain interior oxygen vacancy concentration is in the present, dry, case given by: . Our numerical results are shown in Fig. 3 as dashed lines for a few different values of the segregation energy .
Next, the wet case. Hydration of the grain interior is modeled by the hydration reaction (Kröger-Vink notation):
| (3) |
Experimental values from the literature Kreuer (2003) are assigned to the hydration enthalpy eV and entropy meV/K and a water partial pressure of bar is used in the calculations. The interior hydroxide concentration is obtained from the law of mass action, charge neutrality and site restriction Kreuer (2003):
| (4) |
where and the equilibrium constant . In the middle panel of Fig. 3 we show the result for the interior hydroxide concentration , indicating the transition between wet and dry grain interior around 900 K.
We are now in the position to determine the concentration of core vacancies and the electrostatic barrier as function of temperature in hydrated samples. In this case and in Eq. 1 is replaced by . Eqs. 1 and 2 are solved together with the expression for the hydroxide concentration in Eq. 4 and our final results for and in hydrated samples are shown as solid lines in Fig. 3.
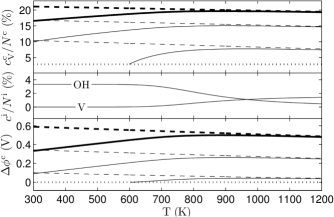
It is clear from Fig. 3 that, according to our model, segregation energies on the order that we find in the tilt GB can lead to significant electrostatic potential barriers as a result of oxygen vacancy aggregation at the GB. In dry BZO at 600 K, 21% of the oxygen sites having a vacancy segregation energy of eV in the GB core are predicted to be vacant, giving rise to an electrostatic potential barrier of 0.55 V. In the hydrated case, vacancies persist at the GB to the degree that, although the interior vacancies have been annihilated at 600 K, 19% of the core sites are still vacant and the barrier is 0.45 V. Even if the sample is cooled to room temperature, the number (assuming thermodynamic equilibrium) only drops to 17% and a potential barrier of 0.33 V is still present.
In recent work, Kjølseth et al Kjølseth et al. (2010) used a space-charge model to evaluate the potential barrier corresponding to experimental results on grain interior and grain boundary proton conductivity in Y-doped BZO Kjølseth et al. (2010); Duval et al. (2007); Babilo, Uda, and Haile (2007). A barrier on the order 0.4–0.6 V was found to match measurements made at 200–300∘C. This agrees relatively well with our results, where a barrier of 0.4–0.45 V is seen for eV in this temperature range. Similar potential barriers fitted to experimental conductivity data were also found by Chen et al Chen, Danel, and Kim (2011) for 10 mol% Y-doped samples Chen, Danel, and Kim (2011); Kjølseth et al. (2010); Duval et al. (2007); Iguchi, Sata, and Yugami (2010) and by Iguchi et al Iguchi, Sata, and Yugami (2010). Interesting to point out is the significant difference in potential barrier calculated from conductivity measurements of Duval Duval et al. (2007), of BZO annealed at high temperature and of conventionally sintered samples. Chen et al calculated a barrier of 0.77 V in the conventionally sintered material, while the calculations of Kjølseth et al show a barrier of 0.46 V in the annealed sample.
When comparing our results to barriers estimated from experimental data it is important to keep in mind that our results are based on DFT calculation on one single grain boundary structure, while experimental results correspond to an average effect in polycrystalline samples. Theoretical investigations of additional GBs are therefore warranted to conclude whether the magnitude of the present oxygen vacancy segregation energy is a general trait of GBs in BZO. Furthermore an aggregation of acceptor dopants at GBs has been observed in BZO Gross et al. (2001); Kjølseth et al. (2010); Iguchi, Sata, and Yugami (2010), an effect which we do not take into account and which would tend to diminish the positive charge due to oxygen vacancies. In addition, there is reason to investigate the segregation energy of protons in GBs, particularly considering that the stability of protons in solid oxides has been seen to increase on oxygen sites where vacancies are also increasingly stable Bjørheim et al. (2010); Nyman, Björketun, and Wahnström (2011).
In conclusion, we present DFT calculations of oxygen vacancy segregation to a tilt grain boundary in BZO. Using a space charge model we demonstrate that at 600 K, where the sample is fully hydrated in a wet atmosphere, the oxygen vacancies in the grain boundary core are still present with a site concentration of about 20%. This corresponds to a Schottky barrier height of 0.45 V and compares well with recent experimental data Kjølseth et al. (2010); Chen, Danel, and Kim (2011); Duval et al. (2007); Babilo, Uda, and Haile (2007); Iguchi, Sata, and Yugami (2010). Our results indicate that oxygen vacancy segregation can be responsible for the low grain boundary proton conductivity in BZO reported in the literature.
Since this paper was submitted for publication further relevant work on space charge and blocking effects at grain boundaries of BZO has been published Shirpour, Merkle, and Maier ; Iguchi, Chen, Yugami, and Kim (2011b); De Souza, Munir, Kim, and Martin (2011b).
We would like to acknowledge Profs Joachim Maier and Truls Norby for useful conversations. The computations have been performed on SNIC resources and the Swedish Energy Agency is acknowledged for financial support.
References
- Ishihara (2009) T. Ishihara, ed., Perovskite Oxide for Solid Oxide Fuel Cells (Springer, Dordrecht, 2009).
- Fabbri, Pergolesi, and Traversa (2010) E. Fabbri, D. Pergolesi, and E. Traversa, Chem. Soc. Rev. 39, 4355 (2010).
- Kreuer (2003) K. D. Kreuer, Annu. Rev. Mater. Res. 33, 333 (2003).
- Bohn and Schober (2000) H. G. Bohn and T. Schober, J. Am. Ceram. Soc. 83, 768 (2000).
- Pergolesi et al. (2010) D. Pergolesi, E. Fabbri, A. D´Epifanio, E. D. Bartolomeo, A. Tebano, S. Sanna, S. Licocca, G. Balestrino, and E. Traversa, Nat. Mater. 9, 846 (2010).
- Iguchi, Sata, and Yugami (2010) F. Iguchi, N. Sata, and H. Yugami, J. Mater. Chem. 20, 6265 (2010).
- Dahl et al. (2011) P. Dahl, H. Lein, Y. Yu, J. Tolchard, T. Grande, M. Einarsrud, C. Kjølseth, T. Norby, and R. Haugsrud, Solid State Ionics 182, 32 (2011).
- Park et al. (2009) H. Park, C. Kwak, K. Lee, S. Lee, and E. Lee, J. Eur. Ceram. Soc. 29, 2429 (2009).
- Kjølseth et al. (2010) C. Kjølseth, H. Fjeld, O. Prytz, P. I. Dahl, C. Estournes, R. Haugsrud, and T. Norby, Solid State Ionics 181, 268 (2010).
- Chen, Danel, and Kim (2011) C. Chen, C. Danel, and S. Kim, J. Mater. Chem. 21, 5435 (2011).
- Kresse and Hafner (1993) G. Kresse and J. Hafner, Phys. Rev. B 48, 13115 (1993).
- Kresse and Furthmüller (1996) G. Kresse and J. Furthmüller, Phys. Rev. B 54, 11169 (1996).
- Blöchl (1994) P. E. Blöchl, Phys. Rev. B 50, 17953 (1994).
- Wang and Perdew (1991) Y. Wang and J. P. Perdew, Phys. Rev. B 44, 13298 (1991).
- Sundell, Björketun, and Wahnström (2006) P. G. Sundell, M. E. Björketun, and G. Wahnström, Phys. Rev. B 73, 104112 (2006).
- K. J. Dudeck and N. A. Benedek and D. J. H. Cockayne (2010) K. J. Dudeck and N. A. Benedek and D. J. H. Cockayne, Phys. Rev. B 81, 134109 (2010).
- (17) The GB energy is defined as , where and are the DFT total energies of the GB and bulk supercell structures respectively, and is the area of the GB interface in the supercell.
- De Souza (2009) R. A. De Souza, Phys. Chem. Chem. Phys. 11, 9939 (2009).
- Guo and Waser (2006) X. Guo and R. Waser, Prog. Mater. Sci. 51, 151 (2006).
- Maier (1995) J. Maier, Progress in Solid State Chemistry 23, 171 (1995).
- Kim, Fleig, and Maier (2003) S. Kim, J. Fleig, and J. Maier, Phys. Chem. Chem. Phys. 5, 2268 (2003).
- Maier (2004) J. Maier, Physical Chemistry of Ionic Materials (John Wiley & Sons, Chichester, West Sussex, 2004).
- Adachi et al. (2001) M. Adachi, Y. Akishige, T. Asahi, K. Deguchi, K. Gesi, K. Hasebe, T. Hikita, T. Ikeda, and Y. Iwata, Landolt-Börnstein, New Series, edited by Y. Shiozaki, E. Nakamura, and T. Mitsui, Vol. III/36a1 (Springer-Verlag, Berlin, 2001).
- Duval et al. (2007) S. B. C. Duval, P. Holtappels, U. F. Vogt, E. Pomjakushina, K. Conder, U. Stimming, and T. Graule, Solid State Ionics 178, 1437 (2007).
- Babilo, Uda, and Haile (2007) P. Babilo, T. Uda, and S. M. Haile, J. Mater. Res. 22, 1322 (2007).
- Gross et al. (2001) B. Gross, C. Beck, F. Meyer, T. Krajewski, R. Hempelmann, and H. Altgeld, Solid State Ionics 145, 325 (2001).
- Bjørheim et al. (2010) T. S. Bjørheim, A. Kuwabara, I. Ahmed, R. Haugsrud, S. Stølen, and T. Norby, Solid State Ionics 181, 130 (2010).
- Nyman, Björketun, and Wahnström (2011) B. J. Nyman, M. E. Björketun, and G. Wahnström, Solid State Ionics 189, 19 (2011).
- (29) M. Shirpour, R. Merkle, and J. Maier, Solid State Ionics 10.1016/j.ssi.2011.09.006.
- Iguchi, Chen, Yugami, and Kim (2011b) F. Iguchi, C.-T. Chen, H. Yugami, and S. Kim,Journal of Materials Chemistry 21, 16517 (2011b).
- De Souza, Munir, Kim, and Martin (2011b) R.A. de Souza, Z.A. Munir, S. Kim, and M. Martin, Solid State Ionics 196, 1 (2011b).